

The DOI matches its Crossref record; 27 of the 27 references it cites were found in a registry or an index.
Establishment and validation of a pseudovirus neutralization assay for SARS-CoV-2
Open accessAbstract
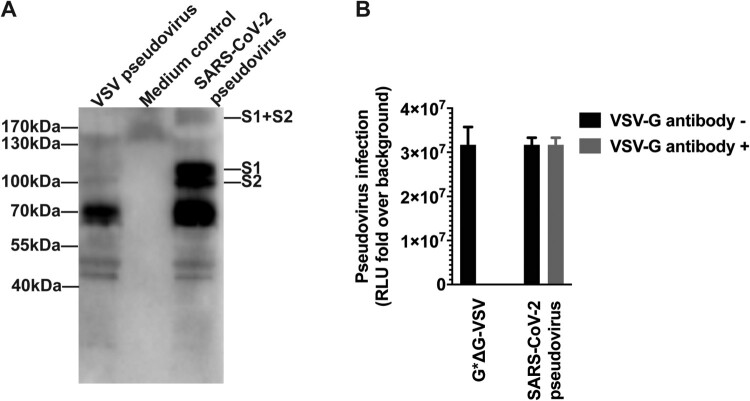
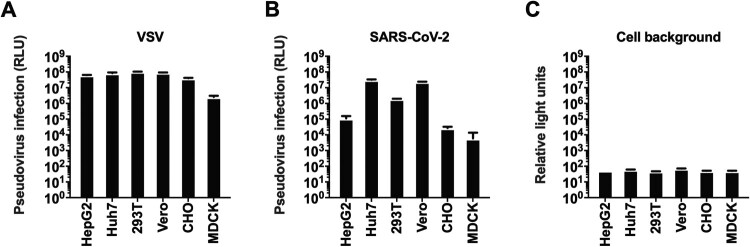
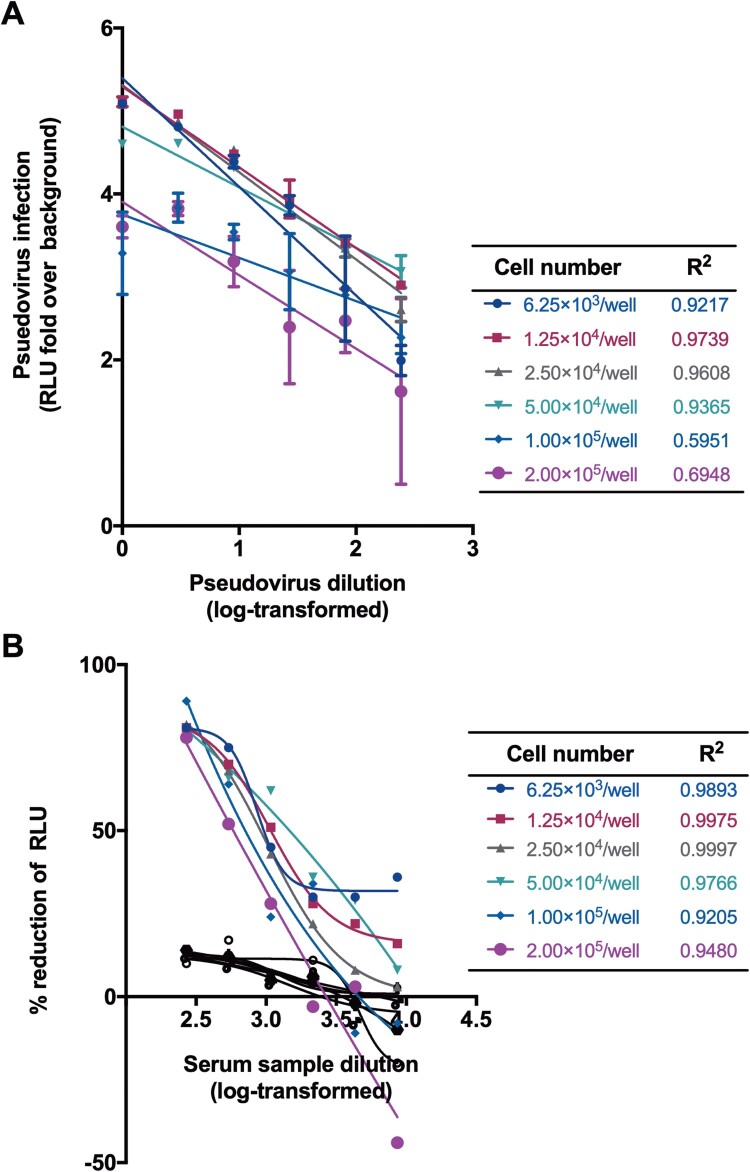
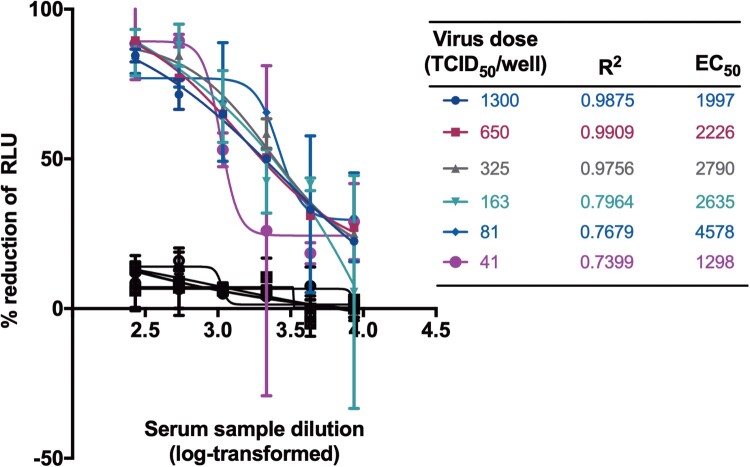
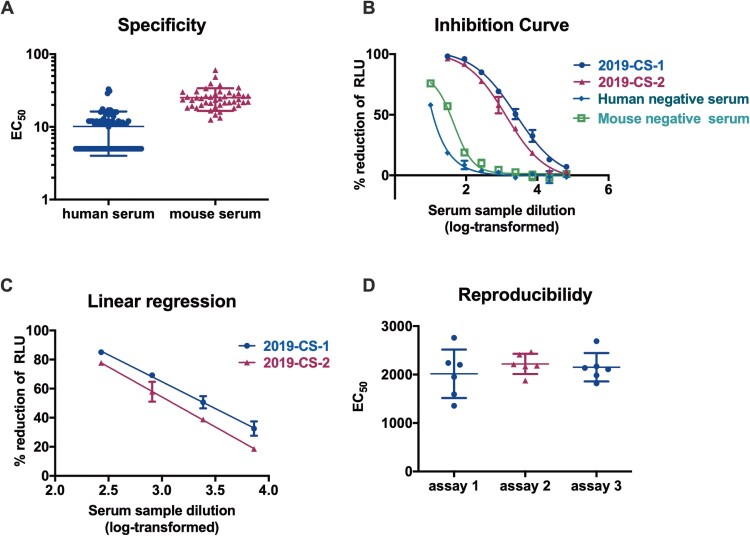
Pseudoviruses are useful virological tools because of their safety and versatility, especially for emerging and re-emerging viruses. Due to its high pathogenicity and infectivity and the lack of effective vaccines and therapeutics, live SARS-CoV-2 has to be handled under biosafety level 3 conditions, which has hindered the development of vaccines and therapeutics. Based on a VSV pseudovirus production system, a pseudovirus-based neutralization assay has been developed for evaluating neutralizing antibodies against SARS-CoV-2 in biosafety level 2 facilities. The key parameters for this assay were optimized, including cell types, cell numbers, virus inoculum. When tested against the SARS-CoV-2 pseudovirus, SARS-CoV-2 convalescent patient sera showed high neutralizing potency, which underscore its potential as therapeutics. The limit of detection for this assay was determined as 22.1 and 43.2 for human and mouse serum samples respectively using a panel of 120 negative samples. The cutoff values were set as 30 and 50 for human and mouse serum samples, respectively. This assay showed relatively low coefficient of variations with 15.9% and 16.2% for the intra- and inter-assay analyses respectively. Taken together, we established a robust pseudovirus-based neutralization assay for SARS-CoV-2 and are glad to share pseudoviruses and related protocols with the developers of vaccines or therapeutics to fight against this lethal virus.
Overview
The claims and statistics of this paper haven’t been checked yet.
Run the check — free, no account needed. It reads the open-access text and checks the sources it cites.
Integrity signals
Registry
Cites
Statistics
Figures
Verification
Claims the paper makes
The claims and statistics of this paper haven’t been checked yet.
Run the check — free, no account needed. It reads the open-access text and checks the sources it cites.
Claims other papers make about this one
Each is checked against this paper’s own text: does it say what the citing paper says it does?
The cited source says what the claim attributes to it.
In the citing paper
“and functionally inhibited entry of a vesicular stomatitis virus (VSV)-based pseudovirus expressing the SARS-CoV-2 S protein (Nie et al., 2020) in Huh7 cells (Figure 1D).”
From A thermostable mRNA vaccine against COVID-19 (2020) · cites this paper as Nie et al., 2020
Self-check
Percentages, sums and reported differences re-computed from the paper’s own numbers.
The self-check needs the paper’s full text.
Citations
Cites
A novel coronavirus from patients with pneumonia in China, 2019
Zhu, N., Zhang, D., Wang, W., Li, X., Yang, B., Song, J., Zhao, X., Huang, B., Shi, W., Lu, R., et al. (2020) · New England Journal of Medicine · doi:10.1056/nejmoa2001017 · Cited by 28,244
Self-citationA pneumonia outbreak associated with a new coronavirus of probable bat origin
Zhou, P., Yang, X.-L., Wang, X.-G., Hu, B., Zhang, L., Zhang, W., Si, H.-R., Zhu, Y., Li, B., Huang, C.-L., et al. (2020) · Nature · doi:10.1038/s41586-020-2012-7 · Cited by 21,969
Self-citationEarly transmission dynamics in Wuhan, China, of novel coronavirus-infected pneumonia
Li, Q., Guan, X., Wu, P., Wang, X., Zhou, L., Tong, Y., Ren, R., Leung, K. S. M., Lau, E. H. Y., Wong, J. Y., et al. (2020) · New England Journal of Medicine · doi:10.1056/nejmoa2001316 · Cited by 16,575
Self-citationHui, D. S., I Azhar, E., Madani, T. A., Ntoumi, F., Kock, R., Dar, O., Ippolito, G., Mchugh, T. D., Memish, Z. A., Drosten, C., et al. (2020) · International Journal of Infectious Diseases · doi:10.1016/j.ijid.2020.01.009 · Cited by 3,809
Chan, J. F., Kok, K., Zhu, Z., Chu, H., To, K. K., Yuan, S., & Yuen, K. (2020) · Emerging Microbes & Infections · doi:10.1080/22221751.2020.1719902 · Cited by 3,127
Emerging coronaviruses: Genome structure, replication, and pathogenesis
Chen, Y. Z., Liu, Q., & Guo, D. (2020) · Journal of Medical Virology · doi:10.1002/jmv.25681 · Cited by 3,069
Genome Composition and Divergence of the Novel Coronavirus (2019-nCoV) Originating in China
Wu, A., Peng, Y., Huang, B., Ding, X. L., Wang, X., Niu, P., Meng, J., Zhu, Z., Zhang, Z., Wang, J., et al. (2020) · Cell Host & Microbe · doi:10.1016/j.chom.2020.02.001 · Cited by 2,386
The spike protein of SARS-CoV — a target for vaccine and therapeutic development
Du, L., He, Y., Zhou, Y., Liu, S., Zheng, B.-J., & Jiang, S. (2009) · Nature Reviews Microbiology · doi:10.1038/nrmicro2090 · Cited by 1,678
The Novel Coronavirus Originating in Wuhan, China
Phelan, A., Katz, R., & Gostin, L. O. (2020) · JAMA · doi:10.1001/jama.2020.1097 · Cited by 1,210
Whitt, M. A. (2010) · Journal of Virological Methods · doi:10.1016/j.jviromet.2010.08.006 · Cited by 431
Cited by
Sorted by citations
Items 101–200 of 696
Zhu, F., Jin, P., Zhu, T., Wang, W., Ye, H., Pan, H., Hou, L., Li, J., Wang, X., Wu, S., et al. (2021) · Clinical Infectious Diseases · doi:10.1093/cid/ciab845 · Cited by 102
Self-citationTrinité, B., Tarrés-Freixas, F., Rodon, J., Pradenas, E., Urrea, V., Marfil, S., de la Concepción, M. L. R., Ávila‐Nieto, C., Aguilar‐Gurrieri, C., Barajas, A., et al. (2021) · Scientific Reports · doi:10.1038/s41598-021-81862-9 · Cited by 104
Chauhan, N., Xiong, Y., Ren, S., Dwivedy, A., Magazine, N., Zhou, L., Jin, X., Zhang, T., Cunningham, B. T., Yao, S., et al. (2022) · Journal of the American Chemical Society · doi:10.1021/jacs.2c04835 · Cited by 99
Self-citationMasi, C. D., Spitalieri, P., Murdocca, M., Novelli, G., & Sangiuolo, F. C. (2020) · Human Genomics · doi:10.1186/s40246-020-00276-2 · Cited by 108
Hu, J., Gao, Q., He, C., Huang, A., Tang, N., & Wang, K. (2020) · Genes & Diseases · doi:10.1016/j.gendis.2020.07.006 · Cited by 98
The Characterization of Disease Severity Associated IgG Subclasses Response in COVID-19 Patients
Luo, H., Jia, T., Chen, J., Zeng, S., Qiu, Z., Wu, S., Li, X., Lei, Y., Wang, X., Wu, W., et al. (2021) · Frontiers in Immunology · doi:10.3389/fimmu.2021.632814 · Cited by 97
Self-citationZhang, J., He, Q., An, C., Mao, Q., Gao, F., Bian, L., Xing, W., Wang, Q., Liu, P., Song, L., et al. (2021) · Emerging Microbes & Infections · doi:10.1080/22221751.2021.1957401 · Cited by 95
Self-citationLiu, J., Bodnar, B. H., Meng, F., Khan, A. I., Wang, X., Luo, G. G., Saribas, S., Wang, T., Lohani, S. C., Wang, P., et al. (2021) · Cell & Bioscience · doi:10.1186/s13578-021-00680-8 · Cited by 97
Self-citationOutbreak of COVID-19: An emerging global pandemic threat
Peng, M. (2020) · Biomedicine & Pharmacotherapy · doi:10.1016/j.biopha.2020.110499 · Cited by 98
Thompson, C., Grayson, N. E., Paton, R. S., Bolton, J. S., Lourenço, J., Penman, B. S., Lee, L. N., Odon, V., Mongkolsapaya, J., Chinnakannan, S. K., et al. (2020) · Eurosurveillance · doi:10.2807/1560-7917.es.2020.25.42.2000685 · Cited by 93
Clinical and Laboratory Diagnosis of SARS-CoV-2, the Virus Causing COVID-19
da Silva, S. J. R., da Silva, C. T. A., Guarines, K. M., Mendes, R. P. G., Pardee, K., Kohl, A., & Pena, L. (2020) · ACS Infectious Diseases · doi:10.1021/acsinfecdis.0c00274 · Cited by 95
Ai, J., Zhang, H., Zhang, Q., Zhang, Y., Lin, K., Fu, Z., Song, J., Zhao, Y., Fan, M., Wang, H., et al. (2021) · Cell Research · doi:10.1038/s41422-021-00590-x · Cited by 89
Curreli, F., Victor, S. M. B., Ahmed, S., Drelich, A. K., Tong, X., Tseng, C.-T. K., Hillyer, C. D., & Debnath, A. K. (2020) · mBio · doi:10.1128/mbio.02451-20 · Cited by 91
An, Y., Li, S., Jin, X., Han, J.-B., Xu, K., Xu, S., Han, Y., Liu, C., Zheng, T., Liu, M., et al. (2022) · Emerging Microbes & Infections · doi:10.1080/22221751.2022.2056524 · Cited by 89
Zeng, C., Evans, J. P., Pearson, R., Qu, P., Zheng, Y.-M., Robinson, R., Hall‐Stoodley, L., Yount, J. S., Pannu, S. R., Mallampalli, R. K., et al. (2020) · JCI Insight · doi:10.1172/jci.insight.143213 · Cited by 87
Yao, H., Sun, Y., Deng, Y., Wang, N., Tan, Y., Zhang, N.-N., Li, X., Kong, C., Xu, Y., Chen, Q., et al. (2020) · Cell Research · doi:10.1038/s41422-020-00444-y · Cited by 87
Self-citationTroyer, Z., Alhusaini, N., Tabler, C. O., Sweet, T. J., Carvalho, K. I., Schlatzer, D., Carias, L. L., King, C. L., Matreyek, K. A., & Tilton, J. C. (2021) · Journal of Extracellular Vesicles · doi:10.1002/jev2.12112 · Cited by 90
Yaqinuddin, A., & Kashir, J. (2020) · Medical Hypotheses · doi:10.1016/j.mehy.2020.109906 · Cited by 86
Harvala, H., Robb, M. L., Watkins, N. A., Ijaz, S., Dicks, S., Patel, M., Supasa, P., Dejnirattisai, W., Liu, C., Mongkolsapaya, J., et al. (2020) · Transfusion Medicine · doi:10.1111/tme.12746 · Cited by 86
Fenwick, C. W., Turelli, P., Pellaton, C., Farina, A., Campos, J., Raclot, C., Pojer, F., Cagno, V., Gonseth, S., D’Acremont, V., et al. (2021) · Science Translational Medicine · doi:10.1126/scitranslmed.abi8452 · Cited by 87
Piergentili, R., Rio, A. D., Signore, F., Ronchi, F. U., Marinelli, E., & Zaami, S. (2021) · Cells · doi:10.3390/cells10050969 · Cited by 87
Yu, J., Li, Z., He, X., Gebre, M. S., Bondzie, E. A., Wan, H., Jacob-Dolan, C., Martinez, D. R., Nkolola, J. P., Baric, R. S., et al. (2021) · Journal of Virology · doi:10.1128/jvi.00044-21 · Cited by 85
Chen, G.-L., Li, X.-F., Dai, X.-H., Li, N., Cheng, M.-L., Huang, Z., Shen, J., Ge, Y.-H., Shen, Z.-W., Deng, Y.-Q., et al. (2022) · The Lancet Microbe · doi:10.1016/s2666-5247(21)00280-9 · Cited by 82
Self-citationPoint-of-care diagnostics: recent developments in a pandemic age
Harpaldas, H., Arumugam, S., Rodriguez, C. C., Kumar, B. A., Shi, V. Y., & Sia, S. K. (2021) · Lab on a Chip · doi:10.1039/d1lc00627d · Cited by 82
Overview of Neutralizing Antibodies and Their Potential in COVID-19
Morales‐Núñez, J. J., Muñóz-Valle, J. F., Torres-Hernández, P. C., & Hernández‐Bello, J. (2021) · Vaccines · doi:10.3390/vaccines9121376 · Cited by 86
Advances in single molecule arrays (SIMOA) for ultra-sensitive detection of biomolecules
Dong, R., Yi, N., & Jiang, D. (2023) · Talanta · doi:10.1016/j.talanta.2023.125529 · Cited by 82
Wang, S., Peng, Y., Wang, R., Jiao, S., Wang, M., Huang, W., Shan, C., Jiang, W., Li, Z., Gu, C., et al. (2020) · Nature Communications · doi:10.1038/s41467-020-19568-1 · Cited by 78
Self-citationSun, S., Cai, Y., Song, T., Yang, P., Cheng, L., Xu, H., Sun, J., Meng, C., Lin, Y., Huang, H., et al. (2021) · Cell Research · doi:10.1038/s41422-021-00531-8 · Cited by 78
Replication and single-cycle delivery of SARS-CoV-2 replicons
Ricardo-Lax, I., Luna, J. M., Thao, T. T. N., Pen, J. L., Yu, Y., Hoffmann, H.-H., Schneider, W. M., Razooky, B. S., Fernández-Martínez, J., Schmidt, F., et al. (2021) · Science · doi:10.1126/science.abj8430 · Cited by 80
Potent Neutralizing Antibodies Directed to Multiple Epitopes on SARS-CoV-2 SpikePreprint
Liu, L., Wang, P., Nair, M. S., Yu, J., Rapp, M., Wang, Q., Luo, Y., Chan, J. F.-W., Sahi, V., Figueroa, A., et al. (2020) · bioRxiv (Cold Spring Harbor Laboratory) · doi:10.1101/2020.06.17.153486 · Cited by 76
Bal, A., Pozzetto, B., Trabaud, M., Escuret, V., Rabilloud, M., Langlois, C., Paul, A., Guibert, N., d’Aubarede, C., Massardier-Pilonchery, A., et al. (2021) · Clinical Chemistry · doi:10.1093/clinchem/hvaa336 · Cited by 74
Xiang, Q., Li, L., Wu, J., Tian, M., & Fu, Y. (2022) · Microbiological Research · doi:10.1016/j.micres.2022.126993 · Cited by 80
Self-citationIsolation of infectious Lloviu virus from Schreiber’s bats in Hungary
Kemenesi, G., Tóth, G. E., Neto, M. M., Scott, S. D., Temperton, N. J., Wright, E., Mühlberger, E., Hume, A. J., Suder, E. L., Zana, B., et al. (2022) · Nature Communications · doi:10.1038/s41467-022-29298-1 · Cited by 74
Hyseni, I., Molesti, E., Benincasa, L., Piu, P., Casa, E., Temperton, N. J., Manenti, A., & Montomoli, E. (2020) · Viruses · doi:10.3390/v12091011 · Cited by 73
Oguntuyo, K. Y., Stevens, C. S., Hung, C.-T., Ikegame, S., Acklin, J. A., Kowdle, S., Carmichael, J. C., Chiu, H.-P., Azarm, K. D., Haas, G. D., et al. (2021) · mBio · doi:10.1128/mbio.02492-20 · Cited by 73
An ACE2 Microbody Containing a Single Immunoglobulin Fc Domain Is a Potent Inhibitor of SARS-CoV-2
Tada, T., Fan, C., Chen, J., Kaur, R., Stapleford, K. A., Gristick, H. B., Dcosta, B. M., Wilen, C. B., Nimigean, C. M., & Landau, N. R. (2020) · Cell Reports · doi:10.1016/j.celrep.2020.108528 · Cited by 72
Self-citationAntibody Responses to Natural SARS-CoV-2 Infection or after COVID-19 Vaccination
Altawalah, H. (2021) · Vaccines · doi:10.3390/vaccines9080910 · Cited by 74
Yang, R., Huang, B., A, R., Li, W., Wang, W., Deng, Y., & Tan, W. (2020) · Biosafety and Health · doi:10.1016/j.bsheal.2020.08.004 · Cited by 70
Durability of neutralizing antibodies and T-cell response post SARS-CoV-2 infection
Tan, Y., Liu, F., Xu, X., Ling, Y., Huang, W., Zhu, Z., Guo, M., Lin, Y., Fu, Z., Liang, D., et al. (2020) · Frontiers of Medicine · doi:10.1007/s11684-020-0822-5 · Cited by 68
Self-citationSARS-CoV-2 neutralizing antibody levels are correlated with severity of COVID-19 pneumonia
Chen, W., Zhang, J., Qin, X., Wang, W., Xu, M., Wang, L., Xu, C., Tang, S., Liu, P., Zhang, L., et al. (2020) · Biomedicine & Pharmacotherapy · doi:10.1016/j.biopha.2020.110629 · Cited by 65
Self-citationThe molecular mechanism of SARS-CoV-2 evading host antiviral innate immunity
Gu, W., Gan, H., Ma, Y., Xu, L., Cheng, Z. J., Li, B., Zhang, X., Jiang, W., Sun, J., Sun, B., et al. (2022) · Virology Journal · doi:10.1186/s12985-022-01783-5 · Cited by 64
Infection of Brain Organoids and 2D Cortical Neurons with SARS-CoV-2 Pseudovirus
Yi, S. A., Nam, K. H., Yun, J., Gim, D., Joe, D., Kim, Y. H., Kim, H., Han, J., & Lee, J. (2020) · Viruses · doi:10.3390/v12091004 · Cited by 65
Zhao, T., Liang, P., Ren, J., Zhu, J., Yang, X., Bian, H., Li, J., Cui, X., Fu, C., Xing, J., et al. (2023) · Analytica Chimica Acta · doi:10.1016/j.aca.2023.341102 · Cited by 62
Walker, S. N., Chokkalingam, N., Reuschel, E. L., Purwar, M., Xu, Z., Gary, E. N., Kim, K. Y., Helble, M., Schultheis, K., Walters, J. N., et al. (2020) · Journal of Clinical Microbiology · doi:10.1128/jcm.01533-20 · Cited by 61
Wang, N., Han, S., Liu, R., Meng, L., He, H., Zhang, Y., Wang, C., Lv, Y., Wang, J., Li, X., et al. (2020) · Phytomedicine · doi:10.1016/j.phymed.2020.153333 · Cited by 62
Self-citationA broadly neutralizing humanized ACE2-targeting antibody against SARS-CoV-2 variants
Du, Y., Shi, R., Zhang, Y., Duan, X., Li, L., Zhang, J., Wang, F., Zhang, R., Shen, H., Wang, Y., et al. (2021) · Nature Communications · doi:10.1038/s41467-021-25331-x · Cited by 62
Self-citationAdvanced Molecular and Immunological Diagnostic Methods to Detect SARS-CoV-2 Infection
Rotondo, J. C., Martini, F., Maritati, M., Caselli, E., Gallenga, C. E., Guarino, M., GIORGIO, R. D., Mazziotta, C., Tramarin, M. L., Badiale, G., et al. (2022) · Microorganisms · doi:10.3390/microorganisms10061193 · Cited by 63
Zhao, H., Wang, T.-C., Li, X.-F., Zhang, N.-N., Li, L., Zhou, C., Deng, Y.-Q., Cao, T.-S., Yang, G., Li, R.-T., et al. (2021) · Signal Transduction and Targeted Therapy · doi:10.1038/s41392-021-00861-4 · Cited by 60
Self-citationTani, H., Kimura, M., Tan, L., Yoshida, Y., Ozawa, T., Kishi, H., Fukushi, S., Saijo, M., Sano, K., Suzuki, T., et al. (2021) · Virology Journal · doi:10.1186/s12985-021-01490-7 · Cited by 60
Generation of SARS-CoV-2 escape mutations by monoclonal antibody therapy
Ragonnet‐Cronin, M., Nutalai, R., Huo, J., Dijokaite-Guraliuc, A., Das, R., Tuekprakhon, A., Supasa, P., Liu, C., Selvaraj, M., Groves, N., et al. (2023) · Nature Communications · doi:10.1038/s41467-023-37826-w · Cited by 61
Li, J., Hou, L., Gou, J.-B., Yin, Z., Wu, S., Wang, F., Zhang, Z., Peng, Z., Zhu, T., Shen, H., et al. (2023) · The Lancet Infectious Diseases · doi:10.1016/s1473-3099(23)00350-x · Cited by 61
Self-citationRole of arachidonic cascade in COVID-19 infection: A review
Ripon, M. A. R., Bhowmik, D. R., Amin, M. T., & Hossain, M. S. (2021) · Prostaglandins & Other Lipid Mediators · doi:10.1016/j.prostaglandins.2021.106539 · Cited by 59
Pan, H., Liu, J., Huang, B., Li, G., Chang, X., Liu, Y., Wang, W., Chu, K., Hu, J., Li, J., et al. (2021) · Chinese Medical Journal · doi:10.1097/cm9.0000000000001573 · Cited by 59
Self-citationKohmer, N., Rühl, C., Ciesek, S., & Rabenau, H. F. (2021) · Journal of Clinical Medicine · doi:10.3390/jcm10102128 · Cited by 59
Advances in Neutralization Assays for SARS‐CoV‐2
Lu, Y., Jin, W., Li, Q., Hu, H., Lu, J., & Chen, Z. (2021) · Scandinavian Journal of Immunology · doi:10.1111/sji.13088 · Cited by 58
Self-citationBanach, B. B., Cerutti, G., Fahad, A. S., Shen, C., de Souza, M. O., Katsamba, P. S., Tsybovsky, Y., Wang, P., Nair, M. S., Huang, Y., et al. (2020) · Cell Reports · doi:10.1016/j.celrep.2021.109771 · Cited by 56
Focosi, D., Maggi, F., Mazzetti, P., & Pistello, M. (2020) · Reviews in Medical Virology · doi:10.1002/rmv.2170 · Cited by 59
Wang, S., Wang, J., Yu, X., Jiang, W., Chen, S., Wang, R., Wang, M., Jiao, S., Wang, W., Wang, W., et al. (2022) · Communications Biology · doi:10.1038/s42003-022-03207-0 · Cited by 57
Self-citationJian, F., Wec, A. Z., Feng, L., Yu, Y., Wang, L., Wang, P., Yu, L., Wang, J., Hou, J., Berrueta, D. M., et al. (2025) · Nature Microbiology · doi:10.1038/s41564-025-02030-7 · Cited by 57
Self-citationKumar, S., Sarma, P., Kaur, H., Prajapat, M., Bhattacharyya, A., Avti, P., Sehkhar, N., Kaur, H., Bansal, S., Mahendiratta, S., et al. (2021) · Tissue and Cell · doi:10.1016/j.tice.2021.101497 · Cited by 60
A delicate balance between antibody evasion and ACE2 affinity for Omicron BA.2.75
Huo, J., Dijokaite-Guraliuc, A., Liu, C., Zhou, D., Ginn, H. M., Das, R., Supasa, P., Selvaraj, M., Nutalai, R., Tuekprakhon, A., et al. (2022) · Cell Reports · doi:10.1016/j.celrep.2022.111903 · Cited by 55
Almahboub, S. A., Algaissi, A. A., Alfaleh, M. A., ElAssouli, M.-Z. M., & Hashem, A. M. (2020) · Frontiers in Microbiology · doi:10.3389/fmicb.2020.02020 · Cited by 55
Contribution of Syndecans to the Cellular Entry of SARS-CoV-2
Hudák, A., Letoha, A., Szilák, L., & Letoha, T. (2021) · International Journal of Molecular Sciences · doi:10.3390/ijms22105336 · Cited by 56
Diagnosis of COVID-19, vitality of emerging technologies and preventive measures
Asif, M., Xu, Y., Xiao, F., & Sun, Y. (2021) · Chemical Engineering Journal · doi:10.1016/j.cej.2021.130189 · Cited by 54
Genova, C. D., Sampson, A., Scott, S., Cantoni, D. M., Neto, M. M., Bentley, E., Mattiuzzo, G., Wright, E., Derveni, M., Auld, B., et al. (2021) · BIO-PROTOCOL · doi:10.21769/bioprotoc.4236 · Cited by 52
A Multifunctional Neutralizing Antibody‐Conjugated Nanoparticle Inhibits and Inactivates SARS‐CoV‐2
Cai, X., Chen, M., Promiński, A., Lin, Y., Ankenbruck, N., Rosenberg, J. N., Nguyen, M., Shi, J., Τοματσίδου, Α., Randall, G. C., et al. (2021) · Advanced Science · doi:10.1002/advs.202103240 · Cited by 52
Fan, H., Hong, B., Luo, Y., Peng, Q., Wang, L., Jin, X., Chen, Y., Hu, Y., Shi, Y., Li, T., et al. (2020) · Signal Transduction and Targeted Therapy · doi:10.1038/s41392-020-00408-z · Cited by 51
Conventional and Nanotechnology-Based Sensing Methods for SARS Coronavirus (2019-nCoV)
Shetti, N. P., Mishra, A., Bukkitgar, S. D., Basu, S., Narang, J., Reddy, K. R., & Aminabhavi, T. M. (2021) · ACS Applied Bio Materials · doi:10.1021/acsabm.0c01545 · Cited by 50
Kim, H. K., Cho, J., Kim, E., Kim, J., Yang, J., Kim, K.-C., Lee, J., Shin, Y., Palomera, L. F., Park, J., et al. (2022) · Journal of Extracellular Vesicles · doi:10.1002/jev2.12179 · Cited by 50
Xu, F., Wu, S., Yi, L., Peng, S., Wang, F., Si, W., Hou, L., & Zhu, T. (2022) · Emerging Microbes & Infections · doi:10.1080/22221751.2022.2030199 · Cited by 50
Wu, J., Yu, J., Shi, X., Li, W., Song, S., Zhao, L., Zhao, X., Liu, J., Wang, D., Liu, C., et al. (2020) · Journal of Viral Hepatitis · doi:10.1111/jvh.13404 · Cited by 49
Self-citationRapid lateral flow tests for the detection of SARS-CoV-2 neutralizing antibodies
Wang, J. J., Zhang, N., Richardson, S. A., & Wu, J. V. (2021) · Expert Review of Molecular Diagnostics · doi:10.1080/14737159.2021.1913123 · Cited by 49
Self-citationGarrido, C., Hurst, J. H., Lorang, C. G., Aquino, J. N., Rodriguez, J., Pfeiffer, T. S., Singh, T., Semmes, E. C., Lugo, D. J., Rotta, A. T., et al. (2021) · JCI Insight · doi:10.1172/jci.insight.150909 · Cited by 51
Wang, W., Li, Q., Wu, J., Hu, Y., Wu, G., Yu, C., Xu, K., Liu, X., Wang, Q., Huang, W., et al. (2021) · Emerging Microbes & Infections · doi:10.1080/22221751.2021.1957720 · Cited by 50
Self-citationDiagnostics and analysis of SARS-CoV-2: current status, recent advances, challenges and perspectives
Dong, T., Wang, M., Liu, J., Ma, P., Pang, S., Liu, W., & Liu, A. (2023) · Chemical Science · doi:10.1039/d2sc06665c · Cited by 50
Self-citationDuarte, R. R. R., Copertino, D. C., Iñiguez, L., Marston, J. L., Bram, Y., Han, Y., Schwartz, R. E., Chen, S., Nixon, D. F., & Powell, T. R. (2021) · Molecular Medicine · doi:10.1186/s10020-021-00356-6 · Cited by 49
COVID-19 Pandemic: Review of Contemporary and Forthcoming Detection Tools
Oishee, M. J., Ali, T., Jahan, N., Khandker, S. S., Haq, M. A., Khondoker, M. U., Sil, B. K., Lugova, H., Krishnapillai, A. D. S., Abubakar, A. R., et al. (2021) · Infection and Drug Resistance · doi:10.2147/idr.s289629 · Cited by 48
The Impact on Infectivity and Neutralization Efficiency of SARS-CoV-2 Lineage B.1.351 Pseudovirus
Kim, Y. J., Jang, U. S., Soh, S. M., Lee, J., & Lee, H.-R. (2021) · Viruses · doi:10.3390/v13040633 · Cited by 48
Evaluation of serum IgM and IgG antibodies in COVID‐19 patients by enzyme linked immunosorbent assay
Zhou, C. S., Bu, G., Sun, Y. C., Ren, C., Qu, M., Gao, Y., Zhu, Y., Wang, L., Sun, L., & Liu, Y. (2020) · Journal of Medical Virology · doi:10.1002/jmv.26741 · Cited by 47
CAR Macrophages for SARS-CoV-2 Immunotherapy
Fu, W., Lei, C., Qian, K., Ma, Z., Tian, L., Lin, F., Zhang, W., Zhao, J., & Hu, S. (2021) · Frontiers in Immunology · doi:10.3389/fimmu.2021.669103 · Cited by 47
Impaired Cellular Immunity to SARS-CoV-2 in Severe COVID-19 Patients
Ni, L., Cheng, M., Zhao, H., Feng, Y., Liu, J., Ye, F., Ye, Q., Zhu, G., Li, X., Wang, P., et al. (2021) · Frontiers in Immunology · doi:10.3389/fimmu.2021.603563 · Cited by 46
Self-citationZhou, T., Tsybovsky, Y., Olia, A. S., Gorman, J., Rapp, M., Cerutti, G., Chuang, G., Katsamba, P. S., Nazzari, A. F., Sampson, J. M., et al. (2020) · bioRxiv (Cold Spring Harbor Laboratory) · doi:10.1101/2020.07.04.187989 · Cited by 48
Rapid escape of new SARS-CoV-2 Omicron variants from BA.2-directed antibody responses
Dijokaite-Guraliuc, A., Das, R., Zhou, D., Ginn, H. M., Liu, C., Duyvesteyn, H. M. E., Huo, J., Nutalai, R., Supasa, P., Selvaraj, M., et al. (2023) · Cell Reports · doi:10.1016/j.celrep.2023.112271 · Cited by 46
Bray, R. A., Lee, J.-H., Brescia, P., Kumar, D., Nong, T., Shih, R. N. J., Woodle, E. S., Maltzman, J. S., & Gebel, H. M. (2020) · Transplantation · doi:10.1097/tp.0000000000003524 · Cited by 44
Li, H., Zhao, C., Zhang, Y., Yuan, F., Zhang, Q., Shi, X., Zhang, L., Qin, C., & Zheng, A. (2020) · Emerging Microbes & Infections · doi:10.1080/22221751.2020.1830715 · Cited by 44
Self-citationDuan, F., Guo, L., Yang, L., Han, Y., Thakur, A., Nilsson-Payant, B. E., Wang, P., Zhang, Z., Ma, C. Y., Zhou, X., et al. (2020) · doi:10.21203/rs.3.rs-62758/v1 · Cited by 44
Hofmann, N., Grossegesse, M., Neumann, M., Schaade, L., & Nitsche, A. (2022) · Scientific Reports · doi:10.1038/s41598-022-07597-3 · Cited by 43
Schöler, L., Le‐Trilling, V. T. K., Eilbrecht, M., Mennerich, D., Anastasiou, O. E., Krawczyk, A., Herrmann, A., Dittmer, U., & Trilling, M. (2020) · Frontiers in Immunology · doi:10.3389/fimmu.2020.573526 · Cited by 42
Dexamethasone inhibits SARS-CoV-2 spike pseudotyped virus viropexis by binding to ACE2
Zhang, Y., Hu, S., Wang, J., Xue, Z., Wang, C., & Wang, N. (2020) · Virology · doi:10.1016/j.virol.2020.12.001 · Cited by 42
Hilterbrand, A. T., Daly, R. E., & Heldwein, E. E. Z. (2021) · mBio · doi:10.1128/mbio.00143-21 · Cited by 42
Gao, T., Ren, Y., Li, S., Lü, X., & Han, L. (2021) · Microbial Cell Factories · doi:10.1186/s12934-021-01584-5 · Cited by 42
Design of a mutation-integrated trimeric RBD with broad protection against SARS-CoV-2
Liang, Y., Zhang, J., Yuan, R. Y., Wang, M. Y., He, P., Su, J. G., Han, Z. B., Jin, Y. Q., Hou, J. W., Zhang, H., et al. (2022) · Cell Discovery · doi:10.1038/s41421-022-00383-5 · Cited by 42
Self-citationSARS-CoV-2 pseudovirus enters the host cells through spike protein-CD147 in an Arf6-dependent manner
Zhou, Y.-Q., Wang, K., Wang, X., Cui, H., Zhao, Y., Zhu, P., & Chen, Z. (2022) · Emerging Microbes & Infections · doi:10.1080/22221751.2022.2059403 · Cited by 42
Zeng, H., Wang, D., Nie, J., Liang, H., Gu, J., Zhao, A., Xu, L., Lang, C., Cui, X., Guo, X., et al. (2020) · Signal Transduction and Targeted Therapy · doi:10.1038/s41392-020-00329-x · Cited by 41
Self-citationA Simplified SARS-CoV-2 Pseudovirus Neutralization Assay
Donofrío, G., Franceschi, V., Macchi, F., Russo, L., Rocci, A., Marchica, V., Costa, F., Giuliani, N., Ferrari, C. I., & Missale, G. (2021) · Vaccines · doi:10.3390/vaccines9040389 · Cited by 42
Impact of mutations in SARS-COV-2 spike on viral infectivity and antigenicity
Zhou, W., Xu, C., Wang, P., Anashkina, A. A., & Jiang, Q. (2021) · Briefings in Bioinformatics · doi:10.1093/bib/bbab375 · Cited by 42
Younes, S. N., Al-Jighefee, H. T., Shurrab, F. M., Al‐Sadeq, D. W., Younes, N., Dargham, S. R., Al-Dewik, N. I. E., Qotba, H. A., Syed, M. A., Alnuaimi, A. S., et al. (2021) · Microorganisms · doi:10.3390/microorganisms9020245 · Cited by 41
Antibody Affinity Governs the Inhibition of SARS-CoV-2 Spike/ACE2 Binding in Patient Serum
Fiedler, S., Piziorska, M. A., Denninger, V., Morgunov, A. S., Ilsley, A., Malik, A. Y., Schneider, M. M., Devenish, S. R. A., Meisl, G., Kosmoliaptsis, V., et al. (2021) · ACS Infectious Diseases · doi:10.1021/acsinfecdis.1c00047 · Cited by 43
Danshensu alleviates pseudo-typed SARS-CoV-2 induced mouse acute lung inflammation
Wang, W., Li, S., Xu, X., Yang, C., Niu, X., Yin, S., Pan, X., Xü, W., Hu, G., Wang, C., et al. (2021) · Acta Pharmacologica Sinica · doi:10.1038/s41401-021-00714-4 · Cited by 40
SARS-CoV-2 Vaccine Development: An Overview and Perspectives
Liu, Y., Wang, K., Massoud, T. F., & Paulmurugan, R. (2020) · ACS Pharmacology & Translational Science · doi:10.1021/acsptsci.0c00109 · Cited by 40
Metadata
- Authors
- Nie, J., Li, Q., Wu, J., Zhao, C., Hao, H., Liu, H., Zhang, L., Nie, L., Qin, H., Wang, M., Lu, Q., Li, X., Sun, Q., Liu, J., Fan, C., Huang, W., Xu, M., & Wang, Y.
- Affiliations
- National Institutes for Food and Drug Control (CN)
- Chinese Academy of Medical Sciences & Peking Union Medical College (CN)
- Corresponding author
- Huang, Weijin
- Xu, Miao
- Wang, Youchun
- ORCID
- Venue
- Emerging Microbes & Infections
- Publisher
- Informa UK Limited
- Published
- 2020-01
- Volume
- 9
- Issue
- 1
- Pages
- 680-686
- ISSN
- 2222-1751 (ISSN-L)
- PMC
- PMC7144318
- OpenAlex
- W3012650581
- Cited by
- 711
- References
- 27
- Citations by year
- 2026: 21 · 2025: 37 · 2024: 73 · 2023: 95 · 2022: 157 · 2021: 186 · 2020: 141
- FWCI
- 19.06
- Type
- journal article
- Language
- en
- Open access
- gold
- doi.org
- Locations
- Emerging Microbes & Infections (publishedVersion, cc-by)
- PubMed Central (publishedVersion, cc-by)
- PubMed (publishedVersion)
- DOAJ (DOAJ: Directory of Open Access Journals) (submittedVersion)
- Informationszentrum Lebenswissenschaften (ZB MED) (submittedVersion, cc-by)
- Topics
- Health Sciences › Medicine › Infectious Diseases › SARS-CoV-2 and COVID-19 Research
- Health Sciences › Medicine › Infectious Diseases › SARS-CoV-2 detection and testing
- Life Sciences › Agricultural and Biological Sciences › Animal Science and Zoology › Animal Virus Infections Studies
- Keywords
- SARS-CoV-2, pseudovirus neutralization assay, neutralizing antibodies, biosafety level 2, convalescent sera, assay validation, detection limit, cut-off values, COVID-19 treatment
- MeSH terms
- Betacoronavirus, COVID-19, SARS-CoV-2, COVID-19 Serotherapy, Animals, Antibodies, Viral, Cell Line, Humans, Immune Sera, Immunization, Passive, Membrane Glycoproteins, Neutralization Tests, Plasmids, Pneumonia, Viral, Sensitivity and Specificity, Vesicular stomatitis Indiana virus, Viral Envelope Proteins, Reproducibility of Results, Coronavirus Infections, Mice, Virus Internalization, Antibodies, Neutralizing, Limit of Detection, Spike Glycoprotein, Coronavirus
About these checks
Registry, retraction, Cites and statistics results are computed, not judged, with one exception: a printed reference that no index lists is read once by a model before it counts as a citation error. Claims are extracted by a model and kept only when their quote appears verbatim in the text; each cited source is then checked, with a model’s help, for whether it says what the claim relies on. Those verdicts can be wrong — read the claim’s quote and the cited source before relying on one.
Statistics and arithmetic are recomputed, not judged.
Confidence bands are shown only for fields calibrated on our annotated test set. None is calibrated yet, so no band is shown.
What counts as a claim ›How we measure confidence ›How we check this ›
Are you an author, or do you see a problem with this page? Request a review
