

Pro-BDNF–induced synaptic depression and retraction at developing neuromuscular synapses
Open accessThe DOI matches its Crossref record; 52 of the 52 references it cites were found in a registry or an index.
Abstract
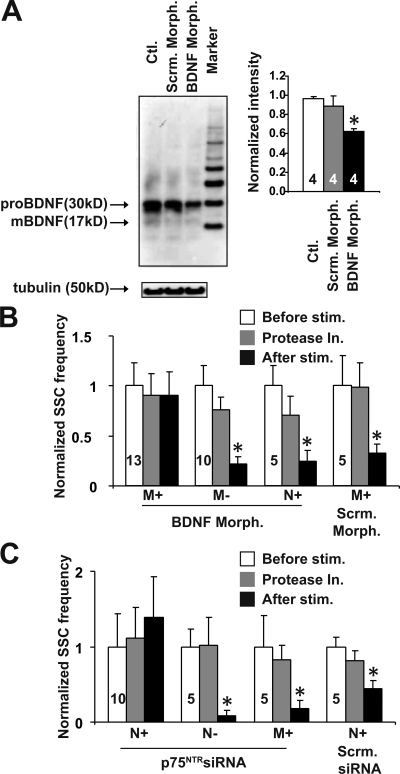
Postsynaptic cells generate positive and negative signals that retrogradely modulate presynaptic function. At developing neuromuscular synapses, prolonged stimulation of muscle cells induces sustained synaptic depression. We provide evidence that pro–brain-derived neurotrophic factor (BDNF) is a negative retrograde signal that can be converted into a positive signal by metalloproteases at the synaptic junctions. Application of pro-BDNF induces a dramatic decrease in synaptic efficacy followed by a retraction of presynaptic terminals, and these effects are mediated by presynaptic pan-neurotrophin receptor p75 (p75NTR), the pro-BDNF receptor. A brief stimulation of myocytes expressing cleavable or uncleavable pro-BDNF elicits synaptic potentiation or depression, respectively. Extracellular application of metalloprotease inhibitors, which inhibits the cleavage of endogenous pro-BDNF, facilitates the muscle stimulation–induced synaptic depression. Inhibition of presynaptic p75NTR or postsynaptic BDNF expression also blocks the activity-dependent synaptic depression and retraction. These results support a model in which postsynaptic secretion of a single molecule, pro-BDNF, may stabilize or eliminate presynaptic terminals depending on its proteolytic conversion at the synapses.
Overview
The claims and statistics of this paper haven’t been checked yet.
Free: it reads the open-access text and checks the first 5 claims that cite a source we can check. Create a free account to check every claim.
Integrity signals
Registry
Cites
Statistics
Figures



Verification
Claims the paper makes
The claims and statistics of this paper haven’t been checked yet.
Free: it reads the open-access text and checks the first 5 claims that cite a source we can check. Create a free account to check every claim.
Claims other papers make about this one
Each is checked against this paper’s own text: does it say what the citing paper says it does?
The source backs part of the claim, not all of it — or backs it for a different population, condition or comparison.
In the citing paper
“Pro-BDNF binding to p75NTR has also been shown to induce pruning of axons and dendrites85,88–91 and promote long-term depression (LTD)92–94.”
From Neuronal plasticity and neurotrophic factors in drug responses (2017) · cites this paper as [91]
Experimental — accuracy not yet measured
Self-check
Percentages, sums and reported differences re-computed from the paper’s own numbers.
The self-check needs the paper’s full text.
Citations
Cites
Egan, M. F., Kojima, M., Callicott, J. H., Goldberg, T. E., Kolachana, B. S., Bertolino, A., Zaitsev, E., Gold, B., Goldman, D., Dean, M., et al. (2003) · Cell · doi:10.1016/s0092-8674(03)00035-7 · Cited by 3,888 · cited 2×
“DNA constructs, embryo injection, and Xenopus nerve–muscle coculture EGFP–pro-BDNF and AA–pro-BDNF–GFP cDNA constructs were made as previously described (Egan et al., 2003).”
Self-citationSynaptic Activity and the Construction of Cortical Circuits
Katz, L. C., & Shatz, C. J. (1996) · Science · doi:10.1126/science.274.5290.1133 · Cited by 3,048 · cited 2×
“JCB: ARTICLE”
Critical period plasticity in local cortical circuits
Hensch, T. K. (2005) · Nature Reviews Neuroscience · doi:10.1038/nrn1787 · Cited by 2,323 · cited 2×
“Activity-dependent synaptic stabilization and elimination play a critical role in shaping patterns of neuronal connections during brain development (Constantine-Paton et al., 1990; Lichtman and Colman, 2000; Debski and Cline, 2002; Goda and Davis, 2003; Hensch, 2005; Taha and Stryker, 2005).”
Neurotrophins as synaptic modulators
Poo, M.-M. (2001) · Nature Reviews Neuroscience · doi:10.1038/35049004 · Cited by 1,775 · cited 5×
“JCB: ARTICLE”
InfluentialRegulation of Cell Survival by Secreted Proneurotrophins
Lee, R., Kermani, P., Teng, K. K., & Hempstead, B. L. (2001) · Science · doi:10.1126/science.1065057 · Cited by 1,670 · cited 7×
“The discovery that pro-BDNF preferentially binds and activates p75NTR (Lee et al., 2001) suggests that pro-BDNF is not a biologically inactive precursor but could elicit through its own receptor physiological functions distinct from mBDNF.”
InfluentialSelf-citationHippocampal long-term potentiation is impaired in mice lacking brain-derived neurotrophic factor.
Korte, M., Carroll, P., Wolf, E., Brem, G., Thoenen, H., & Bonhoeffer, T. (1995) · Proceedings of the National Academy of Sciences · doi:10.1073/pnas.92.19.8856 · Cited by 1,426 · cited 1×
“In contrast, mBDNF-TrkB signaling is essential for the early phase of longterm potentiation (LTP; Korte et al., 1995; Figurov et al., 1996; Patterson et al., 1996).”
The yin and yang of neurotrophin action
Lu, B., Pang, P. T., & Woo, N. H. (2005) · Nature Reviews Neuroscience · doi:10.1038/nrn1726 · Cited by 1,356 · cited 3×
“…neurons (Lee et al., 2001) and facilitates hippocampal long-term depression (Woo et al., 2005), provides further support for the yin-yang hypothesis (Lu et al., 2005): proneurotrophins and mature neurotrophins elicit opposite effects through activation of p75NTR and Trk receptors, respectively.”
Self-citationPatterson, S. L., Abel, T., Deuel, T. A. S., Martin, K. C., Rose, J. C., & Kandel, E. R. (1996) · Neuron · doi:10.1016/s0896-6273(00)80140-3 · Cited by 1,233 · cited 2×
“…system; COM, center of mass; ESC, evoked synaptic current; LTP, long-term potentiation; mBDNF, mature BDNF; MMP, matrix metalloprotease; NMJ, neuromuscular junction; p75NTR, pan-neurotrophin receptor p75; ROI, region of interest; SSC, spontaneous synaptic current; Trk, tropomyosin-related kinase.”
Cleavage of proBDNF by tPA/Plasmin Is Essential for Long-Term Hippocampal Plasticity
Pang, P. T., Teng, H. K., Zaitsev, E., Woo, N. T., Sakata, K., Zhen, S., Teng, K. K., Yung, W.-H., Hempstead, B. L., & Lu, B. (2004) · Science · doi:10.1126/science.1100135 · Cited by 1,136 · cited 8×
“…system; COM, center of mass; ESC, evoked synaptic current; LTP, long-term potentiation; mBDNF, mature BDNF; MMP, matrix metalloprotease; NMJ, neuromuscular junction; p75NTR, pan-neurotrophin receptor p75; ROI, region of interest; SSC, spontaneous synaptic current; Trk, tropomyosin-related kinase.”
InfluentialSelf-citationFigurov, A., Pozzo-Miller, L. D., Olafsson, P., Wang, T., & Lu, B. (1996) · Nature · doi:10.1038/381706a0 · Cited by 1,106 · cited 4×
“…system; COM, center of mass; ESC, evoked synaptic current; LTP, long-term potentiation; mBDNF, mature BDNF; MMP, matrix metalloprotease; NMJ, neuromuscular junction; p75NTR, pan-neurotrophin receptor p75; ROI, region of interest; SSC, spontaneous synaptic current; Trk, tropomyosin-related kinase.”
InfluentialSelf-citationProBDNF Induces Neuronal Apoptosis via Activation of a Receptor Complex of p75NTRand Sortilin
Teng, H. K., Teng, K. K., Lee, R., Wright, S., Tevar, S., Almeida, R. D., Kermani, P., Torkin, R., Chen, Z.-Y., Lee, F. S., et al. (2005) · The Journal of Neuroscience · doi:10.1523/jneurosci.5123-04.2005 · Cited by 1,013 · cited 2×
“Although the secretion of pro-BDNF was initially questioned (Matsumoto et al., 2008), substantial evidence now demonstrates that a significant proportion of BDNF in the brain is secreted in the pro form (Teng et al., 2005; Nagappan et al., 2009; Yang et al., 2009).”
Self-citationBDNF and Activity-Dependent Synaptic Modulation: Figure 1.
Lu, B. (2003) · Learning & Memory · doi:10.1101/lm.54603 · Cited by 945 · cited 3×
“JCB: ARTICLE”
InfluentialSelf-citationActivation of p75NTR by proBDNF facilitates hippocampal long-term depression
Woo, N. H., Teng, H. K., Siao, C.-J., Chiaruttini, C., Pang, P. T., Milner, T. A., Hempstead, B. L., & Lu, B. (2005) · Nature Neuroscience · doi:10.1038/nn1510 · Cited by 815 · cited 5×
“Vol. 185 No. 4 727–741 www.jcb.org/cgi/doi/10.1083/jcb.200811147 JCB 727 F. Yang and H.-S. Je contributed equally to this paper.”
InfluentialSelf-citationPatterned Activity, Synaptic Convergence, and the NMDA Receptor in Developing Visual Pathways
Constantine-Paton, M., Cline, H. T., & Debski, E. (1990) · Annual Review of Neuroscience · doi:10.1146/annurev.ne.13.030190.001021 · Cited by 784 · cited 1×
“Activity-dependent synaptic stabilization and elimination play a critical role in shaping patterns of neuronal connections during brain development (Constantine-Paton et al., 1990; Lichtman and Colman, 2000; Debski and Cline, 2002; Goda and Davis, 2003; Hensch, 2005; Taha and Stryker, 2005).”
Potentiation of developing neuromuscular synapses by the neurotrophins NT-3 and BDNF
Lohof, A. M., Ip, N. Y., & Poo, M.-M. (1993) · Nature · doi:10.1038/363350a0 · Cited by 755 · cited 17×
“The blots were probed with the following primary antibodies: polyclonal antibody against mouse intracellular domain of p75NTR (1:3,000; provided by B. Carter and P. Barker [Vanderbilt University Medical Center, Nashville, TN], M. Bothwell [University of Washington, Seattle, WA], and M. Chao [New York University, New Y…”
InfluentialAn immunohistochemical study of the nerve growth factor receptor in developing rats
Yan, Q., & Johnson, E. (1988) · The Journal of Neuroscience · doi:10.1523/jneurosci.08-09-03481.1988 · Cited by 602 · cited 1×
“JCB: ARTICLE”
Inhibition of Ocular Dominance Column Formation by Infusion of NT-4/5 or BDNF
Cabelli, R. J., Hohn, A., & Shatz, C. J. (1995) · Science · doi:10.1126/science.7886458 · Cited by 566 · cited 15×
“7 C), suggesting that MMP3 and MMP9 may be the proteases that convert pro-BDNF into mBDNF upon synaptic activity.”
InfluentialThe kinetics of synaptic vesicle recycling measured at single presynaptic boutons
Ryan, T. A., Reuter, H., Wendland, B., Schweizer, F. E., Tsien, R. W., & Smith, S. J. (1993) · Neuron · doi:10.1016/0896-6273(93)90081-2 · Cited by 517 · cited 2×
“Finally, we used high powered differential interference contrast optics to trace the remnant of the axon terminals to ensure the entire axon arbor was efficiently visualized.”
Yang, J., Siao, C.-J., Nagappan, G., Marinic, T., Jing, D., McGrath, K., Chen, Z.-Y., Mark, W., Tessarollo, L., Lee, F. S., et al. (2009) · Nature Neuroscience · doi:10.1038/nn.2244 · Cited by 449 · cited 7×
“…system; COM, center of mass; ESC, evoked synaptic current; LTP, long-term potentiation; mBDNF, mature BDNF; MMP, matrix metalloprotease; NMJ, neuromuscular junction; p75NTR, pan-neurotrophin receptor p75; ROI, region of interest; SSC, spontaneous synaptic current; Trk, tropomyosin-related kinase.”
InfluentialSelf-citationSynapse elimination and indelible memory
Lichtman, J. W., & Colman, H. (2000) · Neuron · doi:10.1016/s0896-6273(00)80893-4 · Cited by 380 · cited 2×
“Activity-dependent synaptic stabilization and elimination play a critical role in shaping patterns of neuronal connections during brain development (Constantine-Paton et al., 1990; Lichtman and Colman, 2000; Debski and Cline, 2002; Goda and Davis, 2003; Hensch, 2005; Taha and Stryker, 2005).”
Biosynthesis and processing of endogenous BDNF: CNS neurons store and secrete BDNF, not pro-BDNF
Matsumoto, T., Rauskolb, S., Polack, M., Klose, J., Kolbeck, R., Korte, M., & Barde, Y.-A. (2008) · Nature Neuroscience · doi:10.1038/nn2038 · Cited by 360 · cited 4×
“Although the secretion of pro-BDNF was initially questioned (Matsumoto et al., 2008), substantial evidence now demonstrates that a significant proportion of BDNF in the brain is secreted in the pro form (Teng et al., 2005; Nagappan et al., 2009; Yang et al., 2009).”
InfluentialBlockade of Endogenous Ligands of TrkB Inhibits Formation of Ocular Dominance Columns
Cabelli, R. J., Shelton, D. L., Segal, R. A., & Shatz, C. J. (1997) · Neuron · doi:10.1016/s0896-6273(00)80348-7 · Cited by 306 · cited 1×
“…pro-BDNF, leading to synaptic depression, we expressed p75NTR siRNA (together with GFP) in either JCB • VOLUME 185 • NUMBER 4 • 2009 734 735PRO-BDNF–INDUCED SYNAPTIC DEPRESSION AND RETRACTION • Yang et al. ocular dominance in the visual cortex (Cabelli et al., 1995, 1997; Figurov et al., 1996).”
Signalling and crosstalk of Rho GTPases in mediating axon guidance
Yuan, X.-B., Jin, M., Xu, X., Song, Y.-Q., Wu, C.-P., Poo, M.-M., & Duan, S. (2003) · Nature Cell Biology · doi:10.1038/ncb895 · Cited by 302 · cited 1×
“Several MMPs using embryo injection techniques (Yuan et al., 2003).”
Mechanisms of Synapse Assembly and Disassembly
Goda, Y., & Davis, G. W. (2003) · Neuron · doi:10.1016/s0896-6273(03)00608-1 · Cited by 298 · cited 2×
“Activity-dependent synaptic stabilization and elimination play a critical role in shaping patterns of neuronal connections during brain development (Constantine-Paton et al., 1990; Lichtman and Colman, 2000; Debski and Cline, 2002; Goda and Davis, 2003; Hensch, 2005; Taha and Stryker, 2005).”
Walsh, M. K., & Lichtman, J. W. (2003) · Neuron · doi:10.1016/s0896-6273(02)01142-x · Cited by 298 · cited 1×
“The synaptic sites were visualized by labeling postsynaptic AChRs with a low concentration of -BTX (100 nM), which blocked only 30% of neurotransmission at these synapses (Walsh and Lichtman, 2003; unpublished data).”
Chao, M. V., & Bothwell, M. (2002) · Neuron · doi:10.1016/s0896-6273(01)00573-6 · Cited by 278 · cited 13×
“The blots were probed with the following primary antibodies: polyclonal antibody against mouse intracellular domain of p75NTR (1:3,000; provided by B. Carter and P. Barker [Vanderbilt University Medical Center, Nashville, TN], M. Bothwell [University of Washington, Seattle, WA], and M. Chao [New York University, New Y…”
InfluentialControl of extracellular cleavage of ProBDNF by high frequency neuronal activity
Nagappan, G., Zaitsev, E., Senatorov, V. V., Yang, J., Hempstead, B. L., & Lu, B. (2009) · Proceedings of the National Academy of Sciences · doi:10.1073/pnas.0807322106 · Cited by 270 · cited 11×
“Western blotting of brain homogenates from wild-type and BDNF mutant mice indicated that this antibody specifically detects pro-BDNF but not mBDNF (Nagappan et al., 2009).”
InfluentialSelf-citationNeurotrophins promote maturation of developing neuromuscular synapses
Wang, T., Xie, K., & Lu, B. (1995) · The Journal of Neuroscience · doi:10.1523/jneurosci.15-07-04796.1995 · Cited by 249 · cited 9×
“In this system, mBDNF elicits an acute effect on synaptic transmission and long-term effects on synapse maturation through the activation of presynaptic TrkB (Lohof et al., 1993; Wang et al., 1995).”
InfluentialSelf-citationActivation of the Trk Signaling Pathway by Extracellular Zinc
Hwang, J. J., Park, M.-H., Choi, S.-Y., & Koh, J.-Y. (2005) · Journal of Biological Chemistry · doi:10.1074/jbc.m403172200 · Cited by 206
The fight and flight responses of crickets depleted of biogenic amines
Stevenson, P. A., Hofmann, H. A., Schoch, K., & Schildberger, K. (2000) · Journal of Neurobiology · doi:10.1002/(sici)1097-4695(200005)43:2<107::aid-neu1>3.0.co;2-c · Cited by 202
Rösch, H., Schweigreiter, R., Bonhoeffer, T., Barde, Y.-A., & Korte, M. (2005) · Proceedings of the National Academy of Sciences · doi:10.1073/pnas.0502460102 · Cited by 184 · cited 2×
“…system; COM, center of mass; ESC, evoked synaptic current; LTP, long-term potentiation; mBDNF, mature BDNF; MMP, matrix metalloprotease; NMJ, neuromuscular junction; p75NTR, pan-neurotrophin receptor p75; ROI, region of interest; SSC, spontaneous synaptic current; Trk, tropomyosin-related kinase.”
Activity-Dependent Synaptic Competition in Vitro: Heterosynaptic Suppression of Developing Synapses
Lo, Y.-J., & Poo, M.-M. (1991) · Science · doi:10.1126/science.1658939 · Cited by 155 · cited 6×
“Furthermore, to circumvent focal point changes during long-term imaging, several z stacks (7–10 stacks) were acquired and later”
InfluentialJekyll–Hyde neurotrophins: the story of proNGF
Ibáñez, C. F. (2002) · Trends in Neurosciences · doi:10.1016/s0166-2236(02)02169-0 · Cited by 146 · cited 2×
“…system; COM, center of mass; ESC, evoked synaptic current; LTP, long-term potentiation; mBDNF, mature BDNF; MMP, matrix metalloprotease; NMJ, neuromuscular junction; p75NTR, pan-neurotrophin receptor p75; ROI, region of interest; SSC, spontaneous synaptic current; Trk, tropomyosin-related kinase.”
Activity-dependent mapping in the retinotectal projection
Debski, E. A., & Cline, H. T. (2002) · Current Opinion in Neurobiology · doi:10.1016/s0959-4388(02)00295-7 · Cited by 129 · cited 2×
“Activity-dependent synaptic stabilization and elimination play a critical role in shaping patterns of neuronal connections during brain development (Constantine-Paton et al., 1990; Lichtman and Colman, 2000; Debski and Cline, 2002; Goda and Davis, 2003; Hensch, 2005; Taha and Stryker, 2005).”
Hebbian Depression of Isolated Neuromuscular Synapses in Vitro
Dan, Y., & Poo, M. (1992) · Science · doi:10.1126/science.1317971 · Cited by 127 · cited 5×
“JCB: ARTICLE”
InfluentialGradual loss of synaptic cartels precedes axon withdrawal at developing neuromuscular junctions
Balice‐Gordon, R. J., Chua, C. K., Nelson, C. C., & Lichtman, J. W. (1993) · Neuron · doi:10.1016/0896-6273(93)90110-d · Cited by 125 · cited 2×
“JCB: ARTICLE”
PI-3 kinase and IP3 are both necessary and sufficient to mediate NT3-induced synaptic potentiation
Yang, F., He, X., Feng, L., Mizuno, K., Liu, X.-W., Russell, J. T., Xiong, W., & Lu, B. (2001) · Nature Neuroscience · doi:10.1038/82858 · Cited by 116 · cited 5×
“…of Mental Health, National Institutes of Health, Bethesda, MD 20892 3Division of Hematology and Medical Oncology, Department of Medicine, Weill Cornell Medical College of Cornell University, New York, NY 10021 This article is distributed under the terms of an Attribution–Noncommercial–Share…”
InfluentialSelf-citationMatrix metalloproteinases MMP‐2 and MMP‐9 in denervated muscle and injured nerve
Kherif, Dehaupas, Lafuma, Fardeau, M., & Alameddine (1998) · Neuropathology and Applied Neurobiology · doi:10.1046/j.1365-2990.1998.00118.x · Cited by 90 · cited 13×
“A threshold was set to 30 pA for SSCs because very few SSC amplitudes were 30 pA at the Xenopus NMJ. SSC frequency is defined as the number of SSC events per minute.”
InfluentialXie, K., Wang, T., Olafsson, P., Mizuno, K., & Lu, B. (1997) · The Journal of Neuroscience · doi:10.1523/jneurosci.17-09-02947.1997 · Cited by 85 · cited 2×
“Moreover, both morphological and physiological effects were completely blocked by inhibiting presynaptic but not postsynaptic p75NTR.”
Self-citationMatrix metalloproteinase-3 removes agrin from synaptic basal lamina
VanSaun, M., & Werle, M. J. (2000) · Journal of Neurobiology · doi:10.1002/(sici)1097-4695(200005)43:2<140::aid-neu4>3.0.co;2-k · Cited by 76
Matrix metalloproteinases MMP-2, MMP-7 and MMP-9 in denervated human muscle
Schoser, B. G. H., & Blottner, D. (1999) · NeuroReport · doi:10.1097/00001756-199909090-00018 · Cited by 65 · cited 4×
“All of the electrophysiological and imaging experiments on synaptic depression and retraction were performed in blind manners such that the experimenter did not know whether the fluorescent cells expressed siRNAs/morpholinos for scrambled or target genes.”
InfluentialHeterosynaptic suppression of developing neuromuscular synapses in culture
Lo, Y., & Poo, M. (1994) · The Journal of Neuroscience · doi:10.1523/jneurosci.14-08-04684.1994 · Cited by 56 · cited 7×
“JCB: ARTICLE”
InfluentialHutson, L. D., & Bothwell, M. (2001) · Journal of Neurobiology · doi:10.1002/neu.1067 · Cited by 45 · cited 3×
“Position 45–67 relative to the start codon of the open reading frame, which is shared between the two Xenopus p75NTR genes (p75NTRa and p75NTRb; Hutson and Bothwell, 2001), was selected (5-AGAGCCAUGUUGGUCAGGGCA-3) to generate p75NTR siRNA.”
Activity-Induced Potentiation of Developing Neuromuscular Synapses
Wan, J., & Poo, M. (1999) · Science · doi:10.1126/science.285.5434.1725 · Cited by 45 · cited 8×
“JCB: ARTICLE”
InfluentialJe, H.-S., Yang, F., Zhou, J., & Lu, B. (2006) · The Journal of Cell Biology · doi:10.1083/jcb.200603061 · Cited by 42 · cited 2×
“Activity-dependent synaptic stabilization and elimination play a critical role in shaping patterns of neuronal connections during brain development (Constantine-Paton et al., 1990; Lichtman and Colman, 2000; Debski and Cline, 2002; Goda and Davis, 2003; Hensch, 2005; Taha and Stryker, 2005).”
Self-citationNeurotrophic regulation of the development and function of the neuromuscular synapses
Lu, B., & Je, H. S. (2003) · Journal of Neurocytology · doi:10.1023/b:neur.0000020633.93430.db · Cited by 40 · cited 1×
“Substantial evidence suggests that one of the main functions of mBDNF in the nervous system is to strengthen synaptic connection and facilitate synaptic transmission (Poo, 2001; Lu and Je, 2003).”
Self-citationPostsynaptic Elevation of Calcium Induces Persistent Depression of Developing Neuromuscular Synapses
Cash, S., Dan, Y., Poo, M.-M., & Zucker, R. (1996) · Neuron · doi:10.1016/s0896-6273(00)80095-1 · Cited by 35 · cited 6×
“JCB: ARTICLE”
InfluentialMolecular substrates of plasticity in the developing visual cortex
Taha, S. A., & Stryker, M. P. (2005) · Progress in Brain Research · doi:10.1016/s0079-6123(04)47008-3 · Cited by 31 · cited 2×
“Activity-dependent synaptic stabilization and elimination play a critical role in shaping patterns of neuronal connections during brain development (Constantine-Paton et al., 1990; Lichtman and Colman, 2000; Debski and Cline, 2002; Goda and Davis, 2003; Hensch, 2005; Taha and Stryker, 2005).”
Distinct Mechanisms for Neurotrophin-3-Induced Acute and Long-Term Synaptic Potentiation
Je, H. S., Zhou, J., Yang, F., & Lu, B. (2005) · Journal of Neuroscience · doi:10.1523/jneurosci.4087-05.2005 · Cited by 30 · cited 1×
“FM dye destaining experiments were performed as described previously (Ryan et al., 1993; Je et al., 2005) with minor modifications.”
MethodSelf-citationDepression of developing neuromuscular synapses induced by repetitive postsynaptic depolarizations
Lo, Y., Lin, Y.-C., Sanes, D., & Poo, M. (1994) · Journal of Neuroscience · doi:10.1523/jneurosci.14-08-04694.1994 · Cited by 25 · cited 11×
“…motor neurons (Lo and Poo, 1991), repetitive acetylcholine puffing to the myocyte surface (Dan and Poo, 1992), or direct injection of depolarizing pulses into postsynaptic myocytes (Lo et al., 1994) resulted in a marked and sustained reduction in synaptic efficacy at the neuromuscular synapses.”
InfluentialChapter 19 Plasticity of developing neuromuscular synapses
Dan, Y., Lo, Y.-J., & Poo, M. (1995) · Progress in brain research · doi:10.1016/s0079-6123(08)63297-5 · Cited by 12 · cited 1×
“These results suggest that postsynaptic Ca2+ signaling is important for the release of a retrograde factor, which in turn acts on presynaptic terminals to induce synaptic depression (Dan et al., 1995; Poo, 2001).”
Matrix metalloproteinase-3 removes agrin from synaptic basal lamina.
池田, 彩., & 野村, 早. (2000) · PubMed · doi:10.20632/vso.87.7_382
Cited by
Neurotrophin regulation of neural circuit development and function
Park, H., & Poo, M.-M. (2013) · Nature Reviews Neuroscience · doi:10.1038/nrn3379 · Cited by 2,060
BDNF and synaptic plasticity, cognitive function, and dysfunction
Lu, B., Nagappan, G., & Lu, Y. (2014) · Handbook of Experimental Pharmacology · doi:10.1007/978-3-642-45106-5_9 · Cited by 1,043
Self-citationCastrén, E., & Rantamäki, T. (2010) · Developmental Neurobiology · doi:10.1002/dneu.20758 · Cited by 864
“These data suggest that under conditions whereby pro-BDNF is secreted, its extracellular cleavage is of critical importance for its functional response (Lu et al., 2005; Martinowich et al., 2007; Yang et al., 2009a).”
BackgroundBDNF and Hippocampal Synaptic Plasticity
Leal, G., Bramham, C. R., & Duarte, C. B. (2017) · Vitamins and Hormones · doi:10.1016/bs.vh.2016.10.004 · Cited by 425
Neuromuscular Junction Formation, Aging, and Disorders
Li, L., Xiong, W.-C., & Mei, L. (2018) · Annual Review of Physiology · doi:10.1146/annurev-physiol-022516-034255 · Cited by 370
Metadata
- Authors
- Yang, F., Je, H.-S., Ji, Y., Nagappan, G., Hempstead, B., & Lu, B.
- Affiliations
- National Institutes of Health (US)
- Section on Neural Development and Plasticity, National Institute of Child Health and Human Development 1 and 2
- Cornell University (US)
- Corresponding author
- Lu, Bai
- Venue
- Journal of Cell Biology
- Publisher
- Rockefeller University Press
- Published
- 2009-05-18
- Volume
- 185
- Issue
- 4
- Pages
- 727-741
- ISSN
- 0021-9525 (ISSN-L)
- 1540-8140
- PMC
- PMC2711569
- OpenAlex
- W2091428840
- Cited by
- 130
- References
- 50
- Citations by year
- 2026: 4 · 2025: 1 · 2024: 5 · 2022: 6 · 2021: 7 · 2020: 10 · 2019: 10 · 2018: 8 · 2017: 12 · 2016: 7 · 2015: 5 · 2014: 10 · 2013: 9 · 2012: 13
- FWCI
- 4.97
- Type
- journal article
- Language
- en
- Open access
- hybrid
- doi.org
- Licence
- cc-by-nc-sa
- Locations
- The Journal of Cell Biology (publishedVersion, cc-by-nc-sa)
- PubMed Central (publishedVersion, cc-by-nc-sa)
- PubMed (publishedVersion)
- Funders
- National Institutes of Health
- Topics
- Life Sciences › Neuroscience › Cellular and Molecular Neuroscience › Nerve injury and regeneration
- Life Sciences › Neuroscience › Cellular and Molecular Neuroscience › Neuroscience and Neuropharmacology Research
- Life Sciences › Biochemistry, Genetics and Molecular Biology › Molecular Biology › Muscle Physiology and Disorders
- Keywords
- synaptic depression, p75 neurotrophin receptor, metalloprotease cleavage, retrograde signaling, presynaptic terminals, synaptic potentiation, muscle stimulation, activity-dependent synaptic plasticity
- MeSH terms
- Animals, Synaptic Transmission, Neuromuscular Junction, Protein Precursors, Synapses, Xenopus, Presynaptic Terminals, Brain-Derived Neurotrophic Factor, Receptor, Nerve Growth Factor, Muscle Cells
About these checks
Registry, retraction, Cites and statistics results are computed, not judged, with one exception: a printed reference that no index lists is read once by a model before it counts as a citation error. Claims are extracted by a model and kept only when their quote appears verbatim in the text; each cited source is then checked, with a model’s help, for whether it says what the claim relies on. Those verdicts can be wrong — read the claim’s quote and the cited source before relying on one.
Statistics and arithmetic are recomputed, not judged.
Confidence bands are shown only for fields calibrated on our annotated test set. None is calibrated yet, so no band is shown.
What counts as a claim ›How we measure confidence ›How we check this ›
Are you an author, or do you see a problem with this page? Request a review
Data sources
Bibliographic data: Semantic Scholar, OpenAlex, Crossref.
Contains information from the Semantic Scholar Academic Graph Datasets, made available under the ODC Attribution License (ODC-BY 1.0).
Semantic Scholar’s data is described in: Kinney, R., et al. (2023). The Semantic Scholar Open Data Platform. arXiv:2301.10140.
