

The DOI matches its Crossref record; 5 of the 5 references it cites were found in a registry or an index.
Regulation of the autophagy protein LC3 by phosphorylation
Abstract
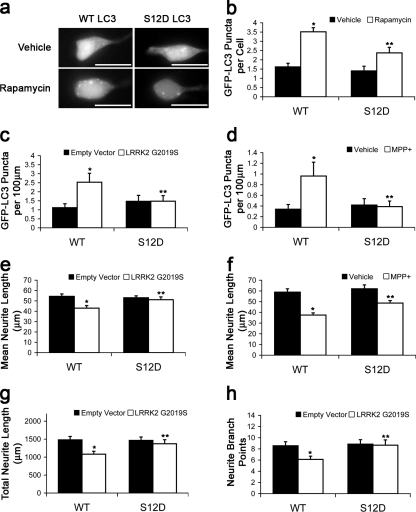
Macroautophagy is a major catabolic pathway that impacts cell survival, differentiation, tumorigenesis, and neurodegeneration. Although bulk degradation sustains carbon sources during starvation, autophagy contributes to shrinkage of differentiated neuronal processes. Identification of autophagy-related genes has spurred rapid advances in understanding the recruitment of microtubule-associated protein 1 light chain 3 (LC3) in autophagy induction, although braking mechanisms remain less understood. Using mass spectrometry, we identified a direct protein kinase A (PKA) phosphorylation site on LC3 that regulates its participation in autophagy. Both metabolic (rapamycin) and pathological (MPP+) inducers of autophagy caused dephosphorylation of endogenous LC3. The pseudophosphorylated LC3 mutant showed reduced recruitment to autophagosomes, whereas the nonphosphorylatable mutant exhibited enhanced puncta formation. Finally, autophagy-dependent neurite shortening induced by expression of a Parkinson disease–associated G2019S mutation in leucine-rich repeat kinase 2 was inhibited by dibutyryl–cyclic adenosine monophosphate, cytoplasmic expression of the PKA catalytic subunit, or the LC3 phosphorylation mimic. These data demonstrate a role for phosphorylation in regulating LC3 activity.
Overview
The claims and statistics of this paper haven’t been checked yet.
Run the check — free, no account needed. It reads the open-access text and checks the sources it cites.
Integrity signals
Registry
Cites
Statistics
Figures
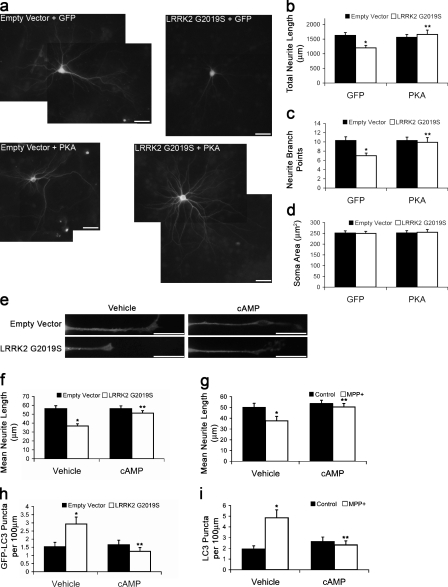
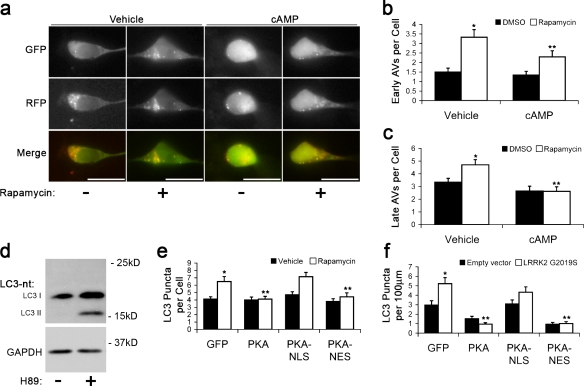
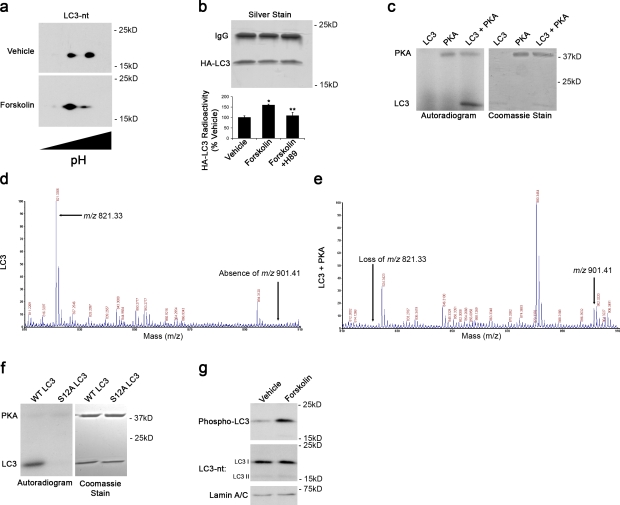
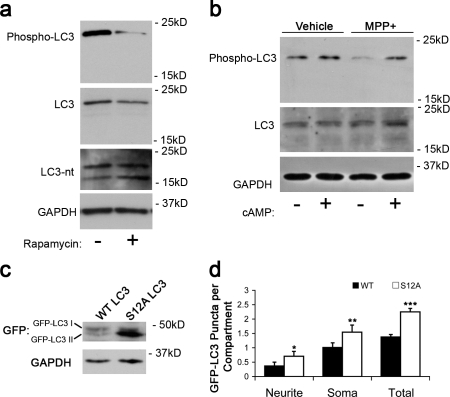
Verification
Claims the paper makes
The claims and statistics of this paper haven’t been checked yet.
Run the check — free, no account needed. It reads the open-access text and checks the sources it cites.
Claims other papers make about this one
Each is checked against this paper’s own text: does it say what the citing paper says it does?
The check wasn’t confident either way, so it gives no verdict — never disputed.
In the citing paper
“However, in human cells, pro-LC3B and LC3B-II are indistinguishable by western blotting [293], and a PLD cleavage assay may be required to discriminate between the two isoforms [289], which is particularly important under conditions where ATG4 activity is reduced.”
From Guidelines for the use and interpretation of assays for monitoring autophagy (4th edition) 1 (2021) · cites this paper as [293]
Experimental — accuracy not yet measured
Self-check
Percentages, sums and reported differences re-computed from the paper’s own numbers.
The self-check needs the paper’s full text.
Citations
Cites
Pankiv, S., Clausen, T. H., Lamark, T., Brech, A., Bruun, J.-A., Outzen, H., Øvervatn, A., Bjørkøy, G., & Johansen, T. (2007) · Journal of Biological Chemistry · doi:10.1074/jbc.m702824200 · Cited by 4,578
Regulation mechanisms and signaling pathways of autophagy
He, C., & Klionsky, D. J. (2009) · Annual Review of Genetics · doi:10.1146/annurev-genet-102808-114910 · Cited by 3,609
Kimura, S., Noda, T., & Yoshimori, T. (2007) · Autophagy · doi:10.4161/auto.4451 · Cited by 2,278
Induction of Autophagy in Axonal Dystrophy and Degeneration
Wang, Q. J., Ding, Y., Kohtz, S., Mizushima, N., Cristea, I. M., Rout, M. P., Chait, B. T., Zhong, Y., Heintz, N., & Yue, Z. (2006) · The Journal of Neuroscience · doi:10.1523/jneurosci.2261-06.2006 · Cited by 308
Control of autophagy initiation by phosphoinositide 3‐phosphatase jumpy
Vergne, I., Roberts, E., Elmaoued, R. A., Tosch, V., Delgado, M. A., Proikas‐Cezanne, T., Laporte, J., & Deretic, V. (2009) · The EMBO Journal · doi:10.1038/emboj.2009.159 · Cited by 270
Research works printed but not linked: 23
- Bok, 2003, An extranuclear locus of cAMP-dependent protein kinase action is necessary and sufficient for promotion of spiral ganglion neuronal survival by cAMP, J. Neurosci., 23, 777, 10.1523/JNEUROSCI.23-03-00777.2003 · DOI
- Boland, 2006, Neuronal macroautophagy: from development to degeneration, Mol. Aspects Med., 27, 503, 10.1016/j.mam.2006.08.009 · DOI
- Budovskaya, 2004, The Ras/cAMP-dependent protein kinase signaling pathway regulates an early step of the autophagy process in Saccharomyces cerevisiae, J. Biol. Chem., 279, 20663, 10.1074/jbc.M400272200 · DOI
- Budovskaya, 2005, An evolutionary proteomics approach identifies substrates of the cAMP-dependent protein kinase, Proc. Natl. Acad. Sci. USA., 102, 13933, 10.1073/pnas.0501046102 · DOI
- Chalovich, 2006, Functional repression of cAMP response element in 6-hydroxydopamine-treated neuronal cells, J. Biol. Chem., 281, 17870, 10.1074/jbc.M602632200 · DOI
- Chu, 2009, Autophagy in neurite injury and neurodegeneration: in vitro and in vivo models, Methods Enzymol., 453, 217, 10.1016/S0076-6879(08)04011-1 · DOI · Paper page
- Cuervo, 2004, Autophagy: in sickness and in health, Trends Cell Biol., 14, 70, 10.1016/j.tcb.2003.12.002 · DOI
- Holen, 1996, Role of cAMP in the regulation of hepatocytic autophagy, Eur. J. Biochem., 236, 163, 10.1111/j.1432-1033.1996.00163.x · DOI
- Jaeger, 2009, All-you-can-eat: autophagy in neurodegeneration and neuroprotection, Mol. Neurodegener., 4, 16, 10.1186/1750-1326-4-16 · DOI
- Klionsky, 2008, Guidelines for the use and interpretation of assays for monitoring autophagy in higher eukaryotes, Autophagy., 4, 151, 10.4161/auto.5338 · DOI · Paper page
- Kouno, 2005, Solution structure of microtubule-associated protein light chain 3 and identification of its functional subdomains, J. Biol. Chem., 280, 24610, 10.1074/jbc.M413565200 · DOI
- MacLeod, 2006, The familial parkinsonism gene LRRK2 regulates neurite process morphology, Neuron., 52, 587, 10.1016/j.neuron.2006.10.008 · DOI
- Plowey, 2008, Role of autophagy in G2019S-LRRK2-associated neurite shortening in differentiated SH-SY5Y cells, J. Neurochem., 105, 1048, 10.1111/j.1471-4159.2008.05217.x · DOI
- Scarlatti, 2008, Role of non-canonical beclin 1-independent autophagy in cell death induced by resveratrol in human breast cancer cells, Cell Death Differ., 15, 1318, 10.1038/cdd.2008.51 · DOI · Paper page
- Shevchenko, 2006, In-gel digestion for mass spectrometric characterization of proteins and proteomes, Nat. Protoc., 1, 2856, 10.1038/nprot.2006.468 · DOI
- Stephan, 2009, The Tor and PKA signaling pathways independently target the Atg1/Atg13 protein kinase complex to control autophagy, Proc. Natl. Acad. Sci. USA., 106, 17049, 10.1073/pnas.0903316106 · DOI
- Sugawara, 2004, The crystal structure of microtubule-associated protein light chain 3, a mammalian homologue of Saccharomyces cerevisiae Atg8, Genes Cells., 9, 611, 10.1111/j.1356-9597.2004.00750.x · DOI · Paper page
- Yamada, 2007, The crystal structure of Atg3, an autophagy-related ubiquitin carrier protein (E2) enzyme that mediates Atg8 lipidation, J. Biol. Chem., 282, 8036, 10.1074/jbc.M611473200 · DOI
- Yang, 2007, Induction of autophagy in neurite degeneration of mouse superior cervical ganglion neurons, Eur. J. Neurosci., 26, 2979, 10.1111/j.1460-9568.2007.05914.x · DOI
- Yorimitsu, 2007, Protein kinase A and Sch9 cooperatively regulate induction of autophagy in Saccharomyces cerevisiae, Mol. Biol. Cell., 18, 4180, 10.1091/mbc.E07-05-0485 · DOI
- Yue, 2009, The cellular pathways of neuronal autophagy and their implication in neurodegenerative diseases, Biochim. Biophys. Acta., 1793, 1496, 10.1016/j.bbamcr.2009.01.016 · DOI
- Zhang, 2007, Small molecule regulators of autophagy identified by an image-based high-throughput screen, Proc. Natl. Acad. Sci. USA., 104, 19023, 10.1073/pnas.0709695104 · DOI
- Zhu, 2007, Regulation of autophagy by extracellular signal-regulated protein kinases during 1-methyl-4-phenylpyridinium-induced cell death, Am. J. Pathol., 170, 75, 10.2353/ajpath.2007.060524 · DOI
Cited by
Sorted by citations
Guidelines for the use and interpretation of assays for monitoring autophagy (3rd edition).
Klionsky, D. J., Abdelmohsen, K., Abe, A., Abedin, M. J., Abeliovich, H., Acevedo Arozena, A., Adachi, H., Adams, C. M., Adams, P. D., Adeli, K., et al. (2016) · Autophagy · doi:10.1080/15548627.2015.1100356 · Cited by 5,894
Self-citationGuidelines for the use and interpretation of assays for monitoring autophagy
Klionsky, D. J., Abdalla, F. C., Abeliovich, H., Abraham, R. T., Acevedo-Arozena, A., Adeli, K., Agholme, L., Agnello, M., Agostinis, P., Aguirre-Ghiso, J. A., et al. (2012) · Autophagy · doi:10.4161/auto.19496 · Cited by 3,996
Self-citationGuidelines for the use and interpretation of assays for monitoring autophagy (4th edition) 1
Klionsky, D. J., Abdel-Aziz, A. K., Abdelfatah, S., Abdellatif, M., Abdoli, A., Abel, S., Abeliovich, H., Abildgaard, M. H., Abudu, Y. P., Acevedo-Arozena, A., et al. (2021) · Autophagy · doi:10.1080/15548627.2020.1797280 · Cited by 2,897
Self-citationAn Overview of Autophagy: Morphology, Mechanism, and Regulation
Parzych, K. R., & Klionsky, D. J. (2014) · Antioxidants & Redox Signaling · doi:10.1089/ars.2013.5371 · Cited by 2,521
Molecular definitions of autophagy and related processes
Galluzzi, L., Baehrecke, E. H., Ballabio, A., Boya, P., Bravo‐San Pedro, J. M., Cecconi, F., Choi, A. M., Chu, C. T., Codogno, P., Colombo, M. I., et al. (2017) · The EMBO Journal · doi:10.15252/embj.201796697 · Cited by 1,646
Self-citationAutophagy in major human diseases
Klionsky, D. J., Petroni, G., Amaravadi, R. K., Baehrecke, E. H., Ballabio, A., Boya, P., Bravo‐San Pedro, J. M., Cadwell, K., Cecconi, F., Choi, A. M. K., et al. (2021) · The EMBO Journal · doi:10.15252/embj.2021108863 · Cited by 1,585
Self-citationAutophagy, mitochondria and oxidative stress: cross-talk and redox signalling.
Lee, J., Giordano, S., & Zhang, J. (2012) · Biochemical Journal · doi:10.1042/bj20111451 · Cited by 1,438
Phosphorylation of the Autophagy Receptor Optineurin Restricts Salmonella Growth
Wild, P., Farhan, H., McEwan, D. G., Wagner, S., Rogov, V. V., Brady, N. R., Richter, B., Korac, J., Waidmann, O., Choudhary, C., et al. (2011) · Science · doi:10.1126/science.1205405 · Cited by 1,298
Emerging regulation and functions of autophagy
Boya, P., Reggiori, F., & Codogno, P. (2013) · Nature Cell Biology · doi:10.1038/ncb2788 · Cited by 1,216
Atg8: an autophagy-related ubiquitin-like protein family.
Shpilka, T., Weidberg, H., Pietrokovski, S., & Elazar, Z. (2011) · Genome biology · doi:10.1186/gb-2011-12-7-226 · Cited by 543
Biogenesis and Cargo Selectivity of Autophagosomes
Weidberg, H., Shvets, E., & Elazar, Z. (2011) · Annual Review of Biochemistry · doi:10.1146/annurev-biochem-052709-094552 · Cited by 466
Excitotoxicity, calcium and mitochondria: a triad in synaptic neurodegeneration
Verma, M., Lizama, B. N., & Chu, C. T. (2022) · Translational Neurodegeneration · doi:10.1186/s40035-021-00278-7 · Cited by 451
Self-citationMyeku, N., Clelland, C. L., Emrani, S., Kukushkin, N. V., Yu, W. H., Goldberg, A. L., & Duff, K. E. (2016) · Nature Medicine · doi:10.1038/nm.4011 · Cited by 446
Ribas, V., Drew, B. G., Zhou, Z., Phun, J., Kalajian, N. Y., Soleymani, T., Daraei, P., Widjaja, K., Wanagat, J., de Aguiar Vallim, T. Q., et al. (2016) · Science Translational Medicine · doi:10.1126/scitranslmed.aad3815 · Cited by 259
Autophagy in bone homeostasis and the onset of osteoporosis
Yin, X., Zhou, C., Li, J., Liu, R., Shi, B., Yuan, Q., & Zou, S. (2019) · Bone Research · doi:10.1038/s41413-019-0058-7 · Cited by 235
Mechanisms of selective autophagy and mitophagy: Implications for neurodegenerative diseases
Chu, C. T. (2019) · Neurobiology of Disease · doi:10.1016/j.nbd.2018.07.015 · Cited by 218
Self-citationATP13A2 regulates mitochondrial bioenergetics through macroautophagy
Gusdon, A. M., Zhu, J., Van Houten, B., & Chu, C. T. (2012) · Neurobiology of Disease · doi:10.1016/j.nbd.2011.12.015 · Cited by 167
Self-citationVerma, M., Callio, J., Otero, P. A., Sekler, I., Wills, Z. P., & Chu, C. T. (2017) · The Journal of Neuroscience · doi:10.1523/jneurosci.3791-16.2017 · Cited by 128
Self-citationPINK1: The guard of mitochondria
Wang, N., Zhu, P., Huang, R., Wang, C., Sun, L., Lan, B., He, Y., Zhao, H., & Gao, Y. (2020) · Life Sciences · doi:10.1016/j.lfs.2020.118247 · Cited by 107
Decreased sirtuin deacetylase activity in LRRK2 G2019S iPSC-derived dopaminergic neurons
Schwab, A. J., Sison, S. L., Meade, M. R., Broniowska, K. A., Corbett, J. A., & Ebert, A. D. (2017) · Stem Cell Reports · doi:10.1016/j.stemcr.2017.10.010 · Cited by 80
LC3B is indispensable for selective autophagy of p62 but not basal autophagy.
Maruyama, Y., Sou, Y.-S., Kageyama, S., Takahashi, T., Ueno, T., Tanaka, K., Komatsu, M., & Ichimura, Y. (2014) · Biochemical and Biophysical Research Communications · doi:10.1016/j.bbrc.2014.02.093 · Cited by 56
The role of autophagy in brown and beige adipose tissue plasticity
Cairó, M., & Villarroya, J. (2020) · Journal of Physiology and Biochemistry · doi:10.1007/s13105-019-00708-1 · Cited by 53
Transcription factors and cognate signalling cascades in the regulation of autophagy
Chandra, V., Bhagyaraj, E., Parkesh, R., & Gupta, P. (2016) · Biological Reviews · doi:10.1111/brv.12177 · Cited by 26
Forskolin Increases cAMP Levels and Enhances Recombinant Antibody Production in CHO Cell Cultures
Yoon, C., Kim, D., Lim, J. H., & Lee, G. M. (2020) · Biotechnology Journal · doi:10.1002/biot.202000264 · Cited by 13
Rezabakhsh, A., Habtemariam, S., Khani, E., Ghorbani Yekta, B., Rahmani, R., Iraji, H., & Nabavi, S. M. (2025) · European Journal of Pharmacology · doi:10.1016/j.ejphar.2025.178253 · Cited by 3
Metadata
- Authors
- Cherra, S. J., Kulich, S. M., Uechi, G., Balasubramani, M., Mountzouris, J., Day, B. W., & Chu, C. T.
- Affiliations
- Department of Pathology 1 , 2 , 3 , and 4
- Abgent Inc., San Diego, CA 92121 6
- Venue
- Journal of Cell Biology
- Publisher
- Rockefeller University Press
- Published
- 2010-08-16
- Volume
- 190
- Issue
- 4
- Pages
- 533-539
- ISSN
- 1540-8140
- 0021-9525
- PMC
- PMC2928022
- Cited by
- 304
- References
- 5
- Language
- en
About these checks
Registry, retraction, Cites and statistics results are computed, not judged, with one exception: a printed reference that no index lists is read once by a model before it counts as a citation error. Claims are extracted by a model and kept only when their quote appears verbatim in the text; each cited source is then checked, with a model’s help, for whether it says what the claim relies on. Those verdicts can be wrong — read the claim’s quote and the cited source before relying on one.
Statistics and arithmetic are recomputed, not judged.
Confidence bands are shown only for fields calibrated on our annotated test set. None is calibrated yet, so no band is shown.
What counts as a claim ›How we measure confidence ›How we check this ›
Are you an author, or do you see a problem with this page? Request a review
