

The DOI matches its Crossref record; 62 of the 62 references it cites were found in a registry or an index.
Mff is an essential factor for mitochondrial recruitment of Drp1 during mitochondrial fission in mammalian cells
Open accessAbstract
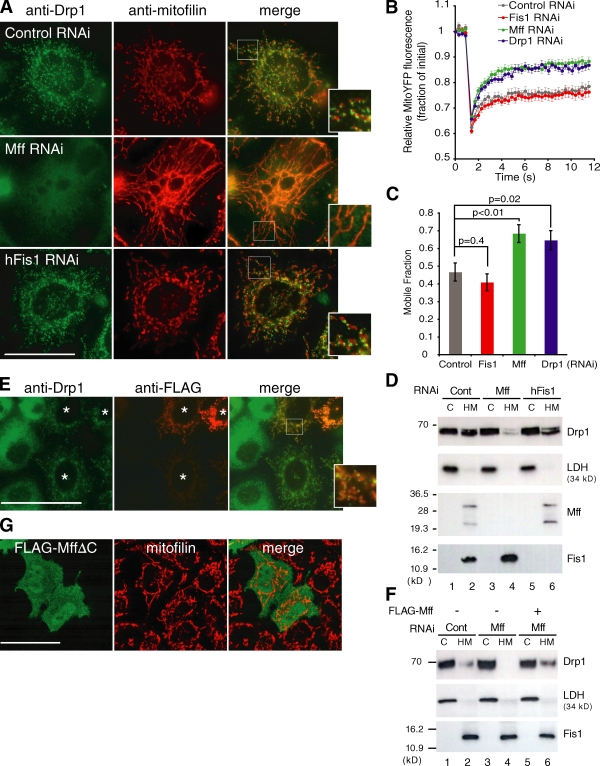
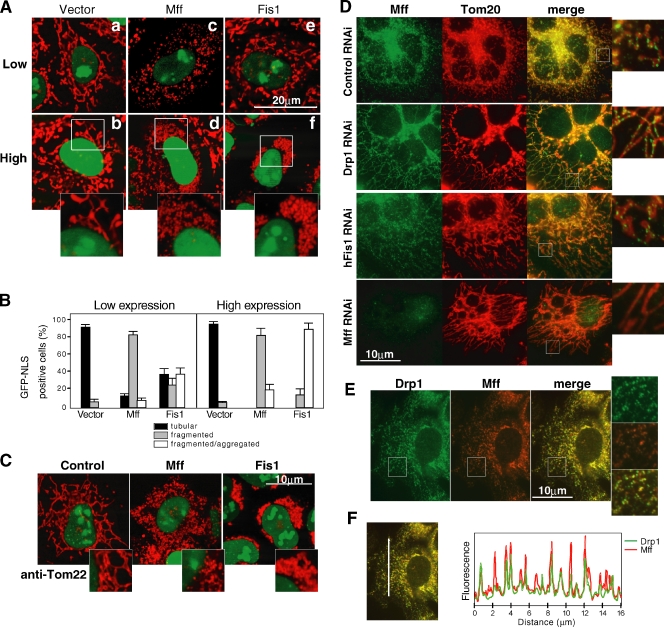
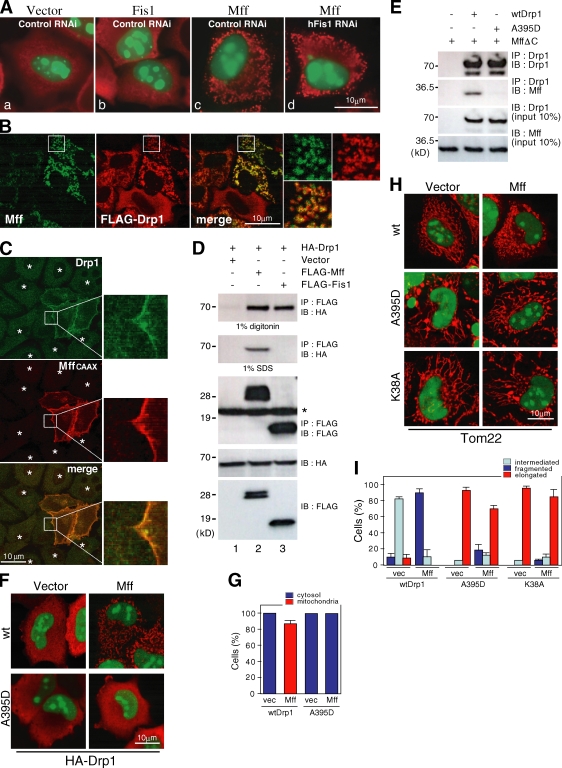
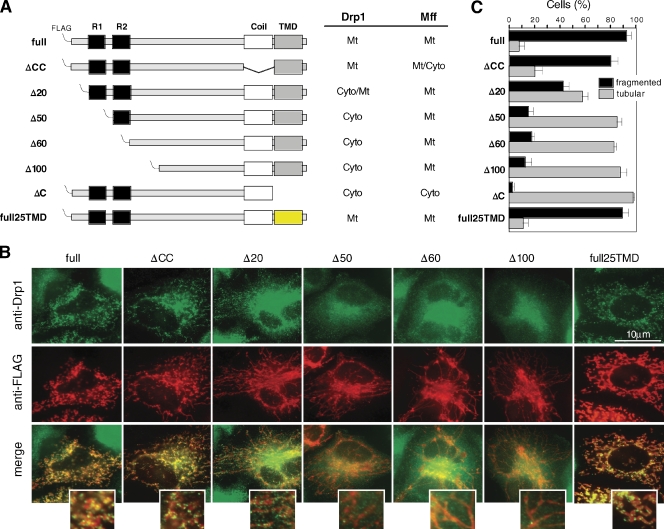
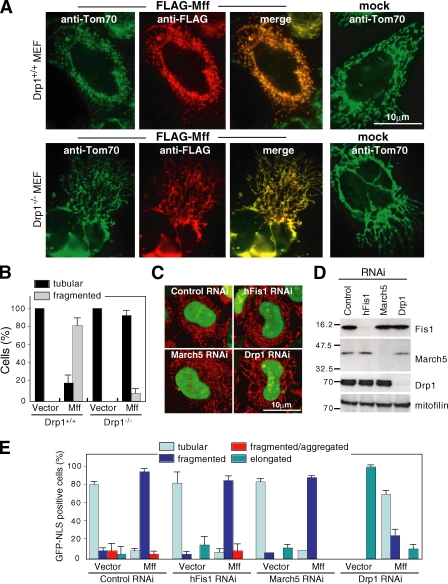
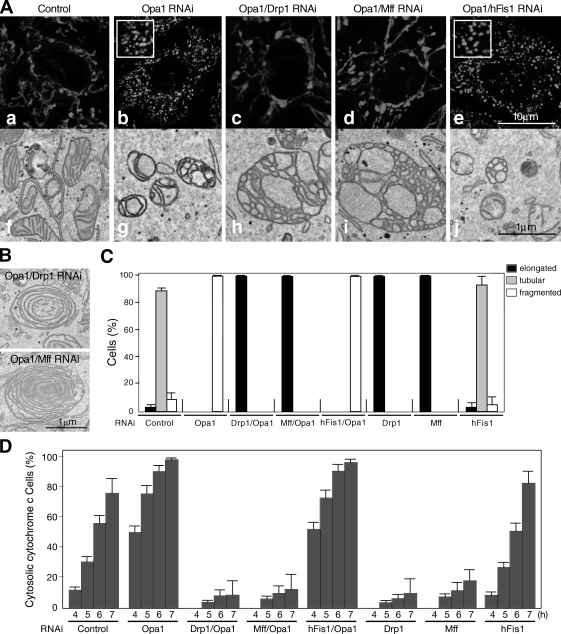
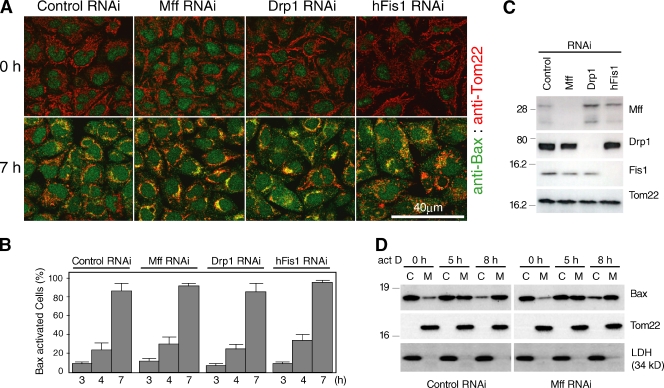
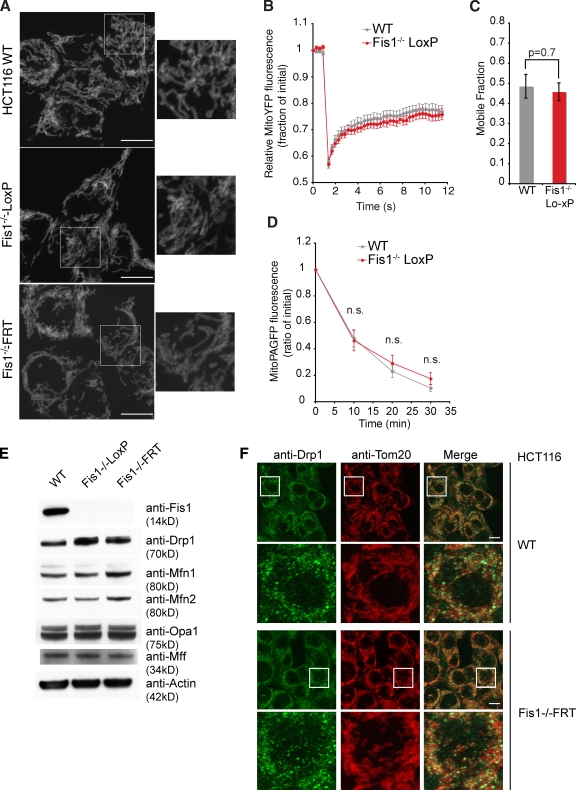
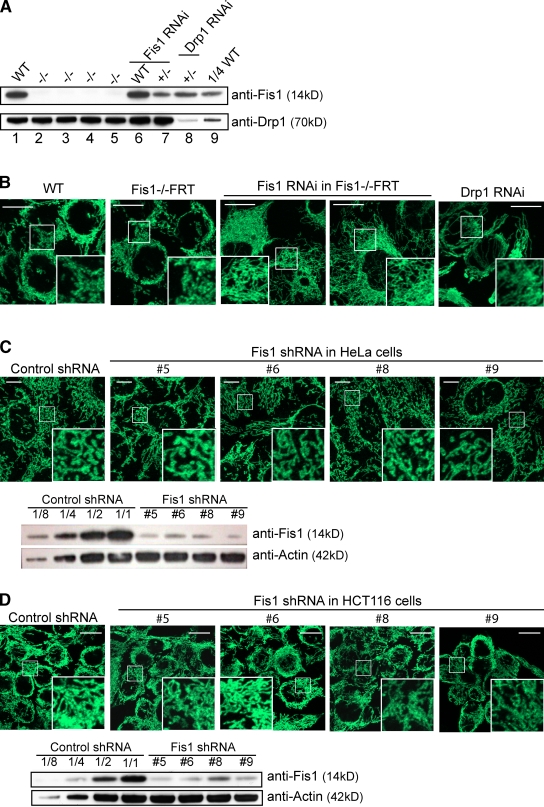
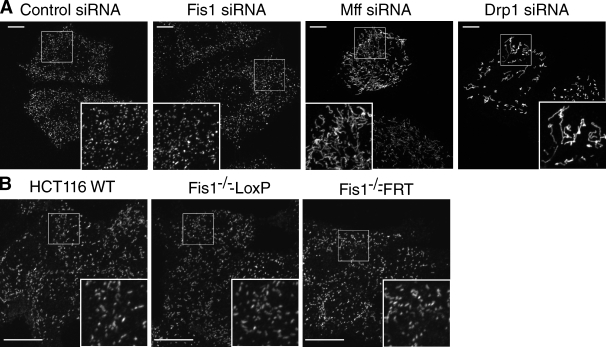
The cytoplasmic dynamin-related guanosine triphosphatase Drp1 is recruited to mitochondria and mediates mitochondrial fission. Although the mitochondrial outer membrane (MOM) protein Fis1 is thought to be a Drp1 receptor, this has not been confirmed. To analyze the mechanism of Drp1 recruitment, we manipulated the expression of mitochondrial fission and fusion proteins and demonstrated that (a) mitochondrial fission factor (Mff) knockdown released the Drp1 foci from the MOM accompanied by network extension, whereas Mff overexpression stimulated mitochondrial recruitment of Drp1 accompanied by mitochondrial fission; (b) Mff-dependent mitochondrial fission proceeded independent of Fis1; (c) a Mff mutant with the plasma membrane–targeted CAAX motif directed Drp1 to the target membrane; (d) Mff and Drp1 physically interacted in vitro and in vivo; (e) exogenous stimuli–induced mitochondrial fission and apoptosis were compromised by knockdown of Drp1 and Mff but not Fis1; and (f) conditional knockout of Fis1 in colon carcinoma cells revealed that it is dispensable for mitochondrial fission. Thus, Mff functions as an essential factor in mitochondrial recruitment of Drp1.
Overview
The claims and statistics of this paper haven’t been checked yet.
Run the check — free, no account needed. It reads the open-access text and checks the sources it cites.
Integrity signals
Registry
Cites
Statistics
Figures
Verification
Claims the paper makes
The claims and statistics of this paper haven’t been checked yet.
Run the check — free, no account needed. It reads the open-access text and checks the sources it cites.
Claims other papers make about this one
Each is checked against this paper’s own text: does it say what the citing paper says it does?
In the citing paper
“MFF overexpression results in increased mitochondrial fission [90, 93].”
From The connection between the dynamic remodeling of the mitochondrial network and the regulation of muscle mass (2021) · cites this paper as [90]
In the citing paper
“In mammals, there are no orthologues for MDV1 and Cav 4, and recent evidence suggests that Fis1 is not required for fission [89, 90].”
From The connection between the dynamic remodeling of the mitochondrial network and the regulation of muscle mass (2021) · cites this paper as [90]
In the citing paper
“Instead, it has been reported that other components of the mammalian fission bind to DRP1 and arrange the assembly of DRP1 oligomers at constriction sites: mitochondrial fission factor (MFF), mitochondrial elongation factor 2/mitochondrial dynamics protein 49 (MIEF2/MiD49), and MIEF1/MiD51 [90–93].”
From The connection between the dynamic remodeling of the mitochondrial network and the regulation of muscle mass (2021) · cites this paper as [90]
In the citing paper
“On the contrary, silencing MFF generates elongated mitochondria and DRP1 cytosolic distribution [90, 93].”
From The connection between the dynamic remodeling of the mitochondrial network and the regulation of muscle mass (2021) · cites this paper as [90]
Self-check
Percentages, sums and reported differences re-computed from the paper’s own numbers.
The self-check needs the paper’s full text.
Citations
Cites
Mitochondria: More Than Just a Powerhouse
McBride, H. M., Neuspiel, M., & Wasiak, S. (2006) · Current Biology · doi:10.1016/j.cub.2006.06.054 · Cited by 1,985
Dynamin-related Protein Drp1 Is Required for Mitochondrial Division in Mammalian Cells
Smirnova, E., Griparić, L., Shurland, D., & van der Bliek, A. M. (2001) · Molecular Biology of the Cell · doi:10.1091/mbc.12.8.2245 · Cited by 1,938
OPA1 Controls Apoptotic Cristae Remodeling Independently from Mitochondrial Fusion
Frezza, C., Cipolat, S., Martins de Brito, O., Micaroni, M., Beznoussenko, G. V., Rudka, T., Bartoli, D., Polishuck, R. S., Danial, N. N., De Strooper, B., et al. (2006) · Cell · doi:10.1016/j.cell.2006.06.025 · Cited by 1,673
Delettre, C., Lenaers, G., Griffoin, J.-M., Gigarel, N., Lorenzo, C., Belenguer, P., Pelloquin, L., Grosgeorge, J., Turc-Carel, C., Perret, E., et al. (2000) · Nature Genetics · doi:10.1038/79936 · Cited by 1,446
Alexander, C., Votruba, M., Pesch, U. E. A., Thiselton, D. L., Mayer, S., Moore, A., Rodriguez, M., Kellner, U., Leo-Kottler, B., Auburger, G., et al. (2000) · Nature Genetics · doi:10.1038/79944 · Cited by 1,330
Mitochondrial dynamics and apoptosis
Suen, D.-F., Norris, K. L., & Youle, R. J. (2008) · Genes & Development · doi:10.1101/gad.1658508 · Cited by 1,270
Self-citationOlichon, A., Baricault, L., Gas, N., Guillou, E., Valette, A., Belenguer, P., & Lenaers, G. (2003) · Journal of Biological Chemistry · doi:10.1074/jbc.c200677200 · Cited by 1,168
A Distinct Pathway Remodels Mitochondrial Cristae and Mobilizes Cytochrome c during Apoptosis
Scorrano, L., Ashiya, M., Buttle, K., Weiler, S., Oakes, S. A., Mannella, C. A., & Korsmeyer, S. J. (2002) · Developmental Cell · doi:10.1016/s1534-5807(01)00116-2 · Cited by 1,072
Ishihara, N., Nomura, M., Jofuku, A., Kato, H., Suzuki, S. O., Masuda, K., Otera, H., Nakanishi, Y., Nonaka, I., Goto, Y.-I., et al. (2009) · Nature Cell Biology · doi:10.1038/ncb1907 · Cited by 1,066
Self-citationRoles of the mammalian mitochondrial fission and fusion mediators Fis1, Drp1, and Opa1 in apoptosis
Lee, Y.-J., Jeong, S.-Y., Karbowski, M., Smith, C. L., & Youle, R. J. (2004) · Molecular Biology of the Cell · doi:10.1091/mbc.e04-04-0294 · Cited by 1,042
Control of mitochondrial morphology by a human mitofusin
Santel, A., & Fuller, M. T. (2001) · Journal of Cell Science · doi:10.1242/jcs.114.5.867 · Cited by 1,012
Mitochondrial Fusion and Fission in Mammals
Chan, D. C. (2006) · Annual Review of Cell and Developmental Biology · doi:10.1146/annurev.cellbio.22.010305.104638 · Cited by 972
Regulation of mitochondrial morphology through proteolytic cleavage of OPA1
Ishihara, N., Fujita, Y., Oka, T., & Mihara, K. (2006) · The EMBO Journal · doi:10.1038/sj.emboj.7601184 · Cited by 899
Self-citationYoon, Y., Krueger, E. W., Oswald, B. J., & McNiven, M. A. (2003) · Molecular and Cellular Biology · doi:10.1128/mcb.23.15.5409-5420.2003 · Cited by 820
The Machines that Divide and Fuse Mitochondria
Hoppins, S., Lackner, L., & Nunnari, J. (2007) · Annual Review of Biochemistry · doi:10.1146/annurev.biochem.76.071905.090048 · Cited by 790
Dynamics of mitochondrial morphology in healthy cells and during apoptosis
Karbowski, M., & Youle, R. J. (2003) · Cell Death and Differentiation · doi:10.1038/sj.cdd.4401260 · Cited by 780
Self-citationMitochondrial fission in apoptosis
Youle, R. J., & Karbowski, M. (2005) · Nature Reviews Molecular Cell Biology · doi:10.1038/nrm1697 · Cited by 773
Self-citationGandre-Babbe, S., & van der Bliek, A. M. (2008) · Molecular Biology of the Cell · doi:10.1091/mbc.e07-12-1287 · Cited by 769
A Lethal Defect of Mitochondrial and Peroxisomal Fission
Waterham, H. R., Koster, J., van Roermund, C. W. T., Mooyer, P. A. W., Wanders, R. J. A., & Leonard, J. V. (2007) · New England Journal of Medicine · doi:10.1056/nejmoa064436 · Cited by 749
Mitochondrial Morphology and Dynamics in Yeast and Multicellular Eukaryotes
Okamoto, K., & Shaw, J. M. (2005) · Annual Review of Genetics · doi:10.1146/annurev.genet.38.072902.093019 · Cited by 737
Mozdy, A. D., McCaffery, J. M., & Shaw, J. M. (2000) · The Journal of Cell Biology · doi:10.1083/jcb.151.2.367 · Cited by 731
hFis1, a Novel Component of the Mammalian Mitochondrial Fission Machinery
James, D. I., Parone, P. A., Mattenberger, Y., & Martinou, J. (2003) · Journal of Biological Chemistry · doi:10.1074/jbc.m303758200 · Cited by 653
Role of Bax and Bak in mitochondrial morphogenesis
Karbowski, M., Norris, K. L., Cleland, M. M., Jeong, S.-Y., & Youle, R. J. (2006) · Nature · doi:10.1038/nature05111 · Cited by 625
Self-citationWasiak, S., Zunino, R., & McBride, H. M. (2007) · The Journal of Cell Biology · doi:10.1083/jcb.200610042 · Cited by 537
The mitochondrial E3 ubiquitin ligase MARCH5 is required for Drp1 dependent mitochondrial division
Karbowski, M., Neutzner, A., & Youle, R. J. (2007) · The Journal of Cell Biology · doi:10.1083/jcb.200611064 · Cited by 485
Self-citationEura, Y. (2003) · Journal of Biochemistry · doi:10.1093/jb/mvg150 · Cited by 445 · cited 3×
“EM For EM, cells were fixed in 4% PFA and 1% glutaraldehyde at 25°C for 30 min and analyzed as described previously (Eura et al., 2003).”
BackgroundMethodGanglioside-induced differentiation associated protein 1 is a regulator of the mitochondrial network
Niemann, A., Rüegg, M., Padula, V. L., Schenone, A. E., & Suter, U. (2005) · The Journal of Cell Biology · doi:10.1083/jcb.200507087 · Cited by 402
High-Efficiency FLP and ΦC31 Site-Specific Recombination in Mammalian Cells
Raymond, C. S., & Soriano, P. M. (2007) · PLoS ONE · doi:10.1371/journal.pone.0000162 · Cited by 385
Tieu, Q., & Nunnari, J. M. (2000) · The Journal of Cell Biology · doi:10.1083/jcb.151.2.353 · Cited by 375
Regulation of CSF1 Promoter by the SWI/SNF-like BAF Complex
Liu, R., Liu, H. S., Chen, X., Kirby, M., Brown, P. O., & Zhao, K. (2001) · Cell · doi:10.1016/s0092-8674(01)00446-9 · Cited by 346
Mitochondrial Function and Actin Regulate Dynamin-Related Protein 1-Dependent Mitochondrial Fission
Vos, K. J. D., Allan, V., Grierson, A. J., & Sheetz, M. P. (2005) · Current Biology · doi:10.1016/j.cub.2005.02.064 · Cited by 345
Levels of human Fis1 at the mitochondrial outer membrane regulate mitochondrial morphology
Stojanovski, D., Koutsopoulos, O. S., Okamoto, K., & Ryan, M. T. (2004) · Journal of Cell Science · doi:10.1242/jcs.01058 · Cited by 332
A role for Fis1 in both mitochondrial and peroxisomal fission in mammalian cells
Koch, A., Yoon, Y., Bonekamp, N. A., McNiven, M. A., & Schrader, M. (2005) · Molecular Biology of the Cell · doi:10.1091/mbc.e05-02-0159 · Cited by 308
Regulation of mitochondrial fusion and division
Cerveny, K. L., Tamura, Y., Zhang, Z., Jensen, R. E., & Sesaki, H. (2007) · Trends in Cell Biology · doi:10.1016/j.tcb.2007.08.006 · Cited by 271
Griffin, E. E., Graumann, J., & Chan, D. C. (2005) · The Journal of Cell Biology · doi:10.1083/jcb.200503148 · Cited by 265
Endophilin B1 is required for the maintenance of mitochondrial morphology
Karbowski, M., Jeong, S., & Youle, R. J. (2004) · The Journal of Cell Biology · doi:10.1083/jcb.200407046 · Cited by 264
Self-citationVáradi, A., Johnson-Cadwell, L. I., Cirulli, V., Yoon, Y., Allan, V., & Rutter, G. A. (2004) · Journal of Cell Science · doi:10.1242/jcs.01299 · Cited by 242
Characterization of the Signal That Directs Tom20 to the Mitochondrial Outer Membrane
Kanaji, S., Iwahashi, J., Kida, Y., Sakaguchi, M., & Mihara, K. (2000) · The Journal of Cell Biology · doi:10.1083/jcb.151.2.277 · Cited by 215
Self-citationEgger, G., Jeong, S., Escobar, S. G., Cortez, C. C., Li, T. W. H., Saito, Y., Yoo, C. B., Jones, P. A., & Liang, G. (2006) · Proceedings of the National Academy of Sciences · doi:10.1073/pnas.0604602103 · Cited by 208
Otera, H., Setoguchi, K., Hamasaki, M., Kumashiro, T., Shimizu, N., & Fujiki, Y. (2002) · Molecular and Cellular Biology · doi:10.1128/mcb.22.6.1639-1655.2002 · Cited by 200
Self-citationSpada, F., Haemmer, A., Kuch, D., Rothbauer, U., Schermelleh, L., Kremmer, E., Carell, T., Längst, G., & Leonhardt, H. (2007) · The Journal of Cell Biology · doi:10.1083/jcb.200610062 · Cited by 199
Mitochondrial fusion and division: Regulation and role in cell viability
Bénard, G., & Karbowski, M. (2009) · Seminars in Cell and Developmental Biology · doi:10.1016/j.semcdb.2008.12.012 · Cited by 186
Chang, C., Manlandro, C. M., Arnoult, D., Stadler, J., Posey, A. E., Hill, R. B., & Blackstone, C. D. (2010) · Journal of Biological Chemistry · doi:10.1074/jbc.m110.142430 · Cited by 184
Mitochondrial fragmentation in apoptosis
Arnoult, D. (2006) · Trends in Cell Biology · doi:10.1016/j.tcb.2006.11.001 · Cited by 173
Setoguchi, K., Otera, H., & Mihara, K. (2006) · The EMBO Journal · doi:10.1038/sj.emboj.7601438 · Cited by 163
Self-citationSuzuki, M., Jeong, S.-Y., Karbowski, M., Youle, R. J., & Tjandra, N. (2003) · Journal of Molecular Biology · doi:10.1016/j.jmb.2003.09.064 · Cited by 161
Self-citationBreckenridge, D. G., Kang, B., Kokel, D., Mitani, S., Staehelin, L. A., & Xue, D. (2008) · Molecular Cell · doi:10.1016/j.molcel.2008.07.015 · Cited by 149
Structural basis for recruitment of mitochondrial fission complexes by Fis1
Zhang, Y., & Chan, D. C. (2007) · Proceedings of the National Academy of Sciences · doi:10.1073/pnas.0706441104 · Cited by 141
The changing shape of mitochondrial apoptosis
Wasilewski, M., & Scorrano, L. (2009) · Trends in Endocrinology and Metabolism · doi:10.1016/j.tem.2009.03.007 · Cited by 135
Shared components of mitochondrial and peroxisomal division
Schrader, M. (2006) · Biochimica et Biophysica Acta (BBA) - Molecular Cell Research · doi:10.1016/j.bbamcr.2006.01.004 · Cited by 134
Eura, Y., Ishihara, N., Oka, T., & Mihara, K. (2006) · Journal of Cell Science · doi:10.1242/jcs.03253 · Cited by 115
Self-citationBcl-2 family interaction with the mitochondrial morphogenesis machinery
Harwig, M. C., Norris, K. L., Karbowski, M., Wang, C., Suen, D., Jiao, S., George, N. M., Luo, X., Li, Z., & Youle, R. J. (2010) · Cell Death and Differentiation · doi:10.1038/cdd.2010.89 · Cited by 108
Self-citationYeast Mitochondrial Division and Distribution Require the Cortical Num1 Protein
Cerveny, K. L., Studer, S. L., Jensen, R. E., & Sesaki, H. (2007) · Developmental Cell · doi:10.1016/j.devcel.2007.01.017 · Cited by 106
FISSION1A and FISSION1B Proteins Mediate the Fission of Peroxisomes and Mitochondria in Arabidopsis
Zhang, X., & Hu, J. (2008) · Molecular Plant · doi:10.1093/mp/ssn056 · Cited by 78
Improved methods for the generation of human gene knockout and knockin cell lines
Topaloglu, Ö. (2005) · Nucleic Acids Research · doi:10.1093/nar/gni160 · Cited by 77
Oka, T., Sayano, T., Tamai, S., Yokota, S., Kato, H., Fujii, G., & Mihara, K. (2008) · Molecular Biology of the Cell · doi:10.1091/mbc.e07-12-1205 · Cited by 76
Self-citationSuzuki, H., Maeda, M., & Mihara, K. (2002) · Journal of Cell Science · doi:10.1242/jcs.115.9.1895 · Cited by 74
Self-citationJofuku, A., Ishihara, N., & Mihara, K. (2005) · Biochemical and Biophysical Research Communications · doi:10.1016/j.bbrc.2005.05.154 · Cited by 73
Self-citationSuzuki, M., Neutzner, A., Tjandra, N., & Youle, R. J. (2005) · Journal of Biological Chemistry · doi:10.1074/jbc.m414092200 · Cited by 71
Self-citationMitochondrial fission and apoptosis: An ongoing trial
Parone, P. A., & Martinou, J. (2006) · Biochimica et Biophysica Acta (BBA) - Molecular Cell Research · doi:10.1016/j.bbamcr.2006.04.005 · Cited by 60
Mdm36 Is a Mitochondrial Fission-promoting Protein inSaccharomyces cerevisiae
Hammermeister, M., Schödel, K., & Westermann, B. (2010) · Molecular Biology of the Cell · doi:10.1091/mbc.e10-02-0096 · Cited by 57
Distinct cell death pathways triggered by the adenovirus early region 4 ORF 4 protein
Robert, A., Miron, M.-J., Champagne, C., Gingras, M., Branton, P. E., & Lavoie, J. N. (2002) · The Journal of Cell Biology · doi:10.1083/jcb.200201106 · Cited by 53
Cited by
Sorted by citations
AMPK: guardian of metabolism and mitochondrial homeostasis
Herzig, S., & Shaw, R. J. (2017) · Nature Reviews Molecular Cell Biology · doi:10.1038/nrm.2017.95 · Cited by 4,192
ER Tubules Mark Sites of Mitochondrial Division
Friedman, J. R., Lackner, L. L., West, M., DiBenedetto, J. R., Nunnari, J., & Voeltz, G. K. (2011) · Science · doi:10.1126/science.1207385 · Cited by 2,072
Mitochondrial form and function
Friedman, J. R., & Nunnari, J. (2014) · Nature · doi:10.1038/nature12985 · Cited by 1,803
The cell biology of mitochondrial membrane dynamics
Giacomello, M., Pyakurel, A., Glytsou, C., & Scorrano, L. (2020) · Nature Reviews Molecular Cell Biology · doi:10.1038/s41580-020-0210-7 · Cited by 1,550
Mitochondrial Dynamics and Its Involvement in Disease
Chan, D. C. (2020) · Annual Review of Pathology: Mechanisms of Disease · doi:10.1146/annurev-pathmechdis-012419-032711 · Cited by 1,416
Metadata
- Authors
- Otera, H., Wang, C., Cleland, M. M., Setoguchi, K., Yokota, S., Youle, R. J., & Mihara, K.
- Affiliations
- Kyushu University (JP)
- National Institutes of Health (US)
- Biochemistry Section, Surgical Neurology Branch, National Institute of Neurological Disorders and Stroke, National Institutes of Health, Bethesda, MD 20892 2
- Nagasaki International University (JP)
- Corresponding author
- Mihara, Katsuyoshi
- Venue
- Journal of Cell Biology
- Publisher
- Rockefeller University Press
- Published
- 2010-12-13
- Volume
- 191
- Issue
- 6
- Pages
- 1141-1158
- ISSN
- 0021-9525 (ISSN-L)
- 1540-8140
- PMC
- PMC3002033
- OpenAlex
- W2149108521
- Cited by
- 1,110
- References
- 62
- Citations by year
- 2026: 42 · 2025: 67 · 2024: 74 · 2023: 72 · 2022: 88 · 2021: 91 · 2020: 80 · 2019: 69 · 2018: 70 · 2017: 70 · 2016: 77 · 2015: 71 · 2014: 78 · 2013: 60 · 2012: 67
- FWCI
- 20.43
- Type
- journal article
- Language
- en
- Open access
- hybrid
- doi.org
- Licence
- cc-by-nc-sa
- Locations
- The Journal of Cell Biology (publishedVersion, cc-by-nc-sa)
- Europe PMC (PubMed Central) (publishedVersion, cc-by-nc-sa)
- PubMed Central (publishedVersion, cc-by-nc-sa)
- PubMed (publishedVersion)
- Funders
- National Institutes of Health
- Topics
- Life Sciences › Biochemistry, Genetics and Molecular Biology › Molecular Biology › Mitochondrial Function and Pathology
- Life Sciences › Biochemistry, Genetics and Molecular Biology › Cell Biology › Autophagy in Disease and Therapy
- Life Sciences › Biochemistry, Genetics and Molecular Biology › Molecular Biology › Cell death mechanisms and regulation
- Keywords
- Mff, Drp1, mitochondrial fission, mitochondrial recruitment, Fis1, mitochondrial outer membrane, dynamin-related GTPase, mitochondrial fusion, CAAX motif, apoptosis, colon cancer cells, conditional knockout
- MeSH terms
- Animals, Cells, Cultured, Cytoplasm, Cytoskeletal Proteins, HeLa Cells, Humans, Membrane Proteins, Mitochondria, Down-Regulation, GTP Phosphohydrolases, Mitochondrial Proteins, RNA, Small Interfering
About these checks
Registry, retraction, Cites and statistics results are computed, not judged, with one exception: a printed reference that no index lists is read once by a model before it counts as a citation error. Claims are extracted by a model and kept only when their quote appears verbatim in the text; each cited source is then checked, with a model’s help, for whether it says what the claim relies on. Those verdicts can be wrong — read the claim’s quote and the cited source before relying on one.
Statistics and arithmetic are recomputed, not judged.
Confidence bands are shown only for fields calibrated on our annotated test set. None is calibrated yet, so no band is shown.
What counts as a claim ›How we measure confidence ›How we check this ›
Are you an author, or do you see a problem with this page? Request a review
