

The DOI matches its Crossref record; 58 of the 58 references it cites were found in a registry or an index.
Local palmitoylation cycles define activity-regulated postsynaptic subdomains
Open accessAbstract
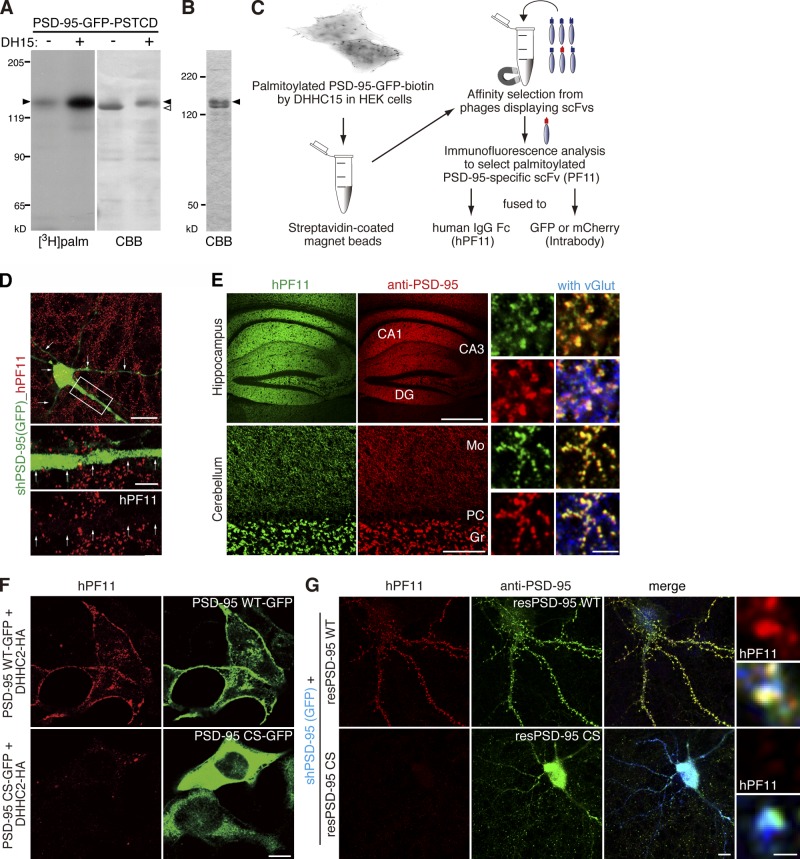
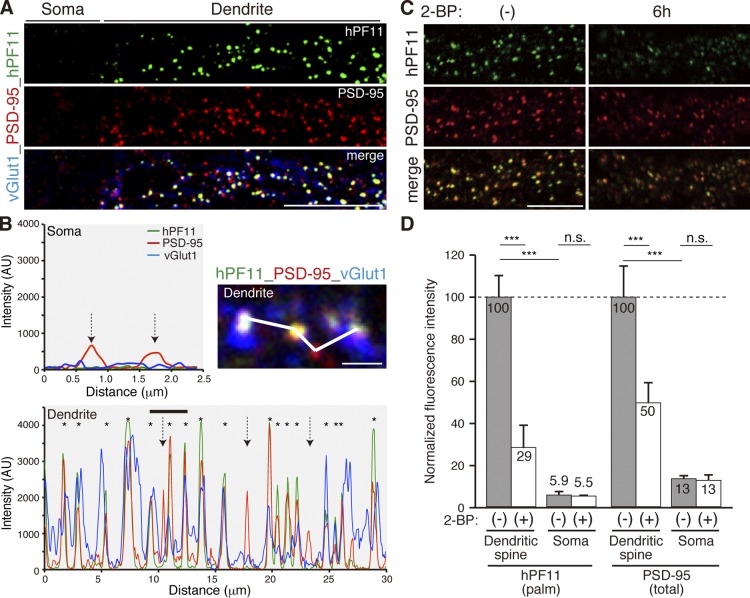
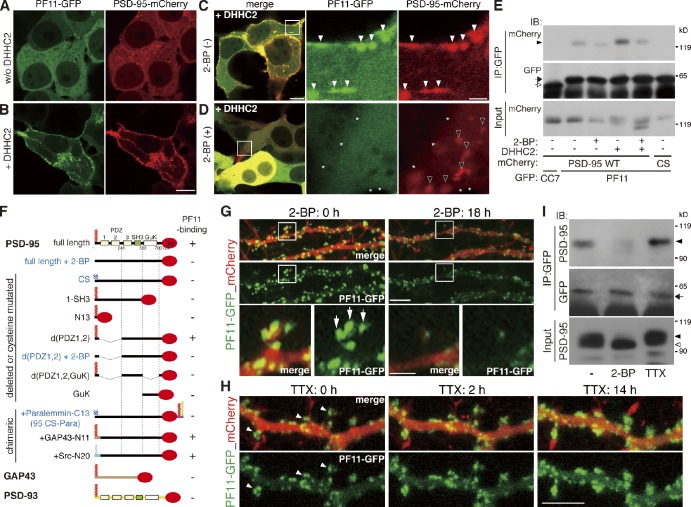
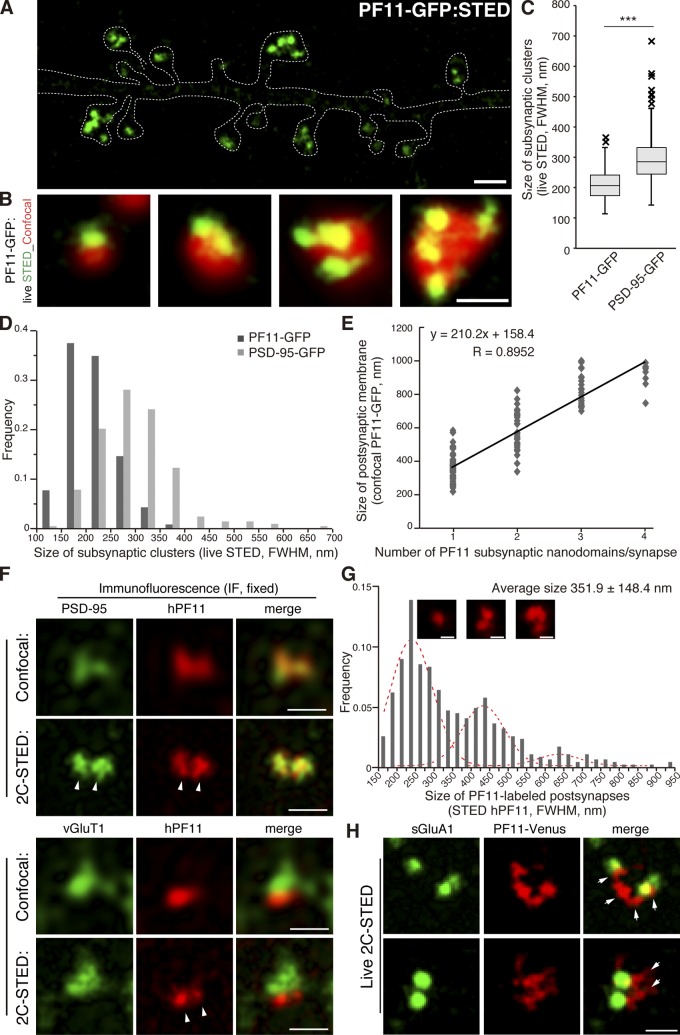
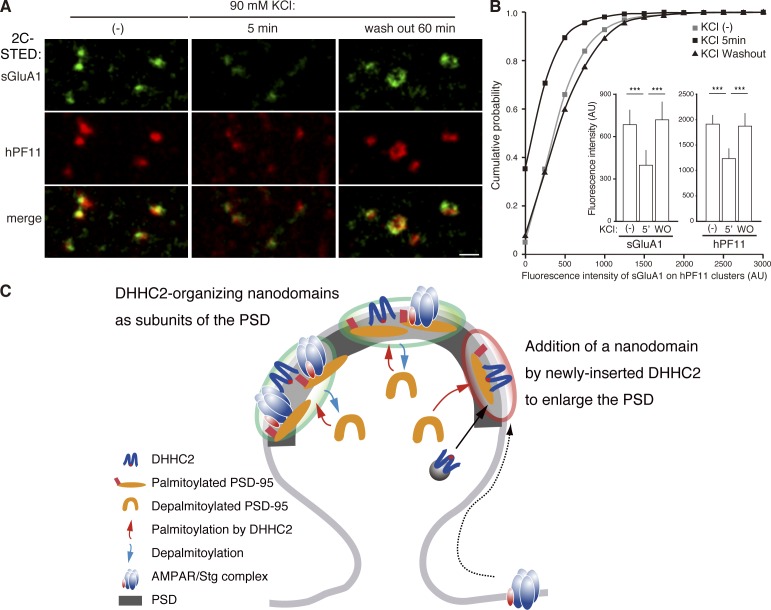
Distinct PSD-95 clusters are primary landmarks of postsynaptic densities (PSDs), which are specialized membrane regions for synapses. However, the mechanism that defines the locations of PSD-95 clusters and whether or how they are reorganized inside individual dendritic spines remains controversial. Because palmitoylation regulates PSD-95 membrane targeting, we combined a conformation-specific recombinant antibody against palmitoylated PSD-95 with live-cell super-resolution imaging and discovered subsynaptic nanodomains composed of palmitoylated PSD-95 that serve as elementary units of the PSD. PSD-95 in nanodomains underwent continuous de/repalmitoylation cycles driven by local palmitoylating activity, ensuring the maintenance of compartmentalized PSD-95 clusters within individual spines. Plasma membrane targeting of DHHC2 palmitoyltransferase rapidly recruited PSD-95 to the plasma membrane and proved essential for postsynaptic nanodomain formation. Furthermore, changes in synaptic activity rapidly reorganized PSD-95 nano-architecture through plasma membrane-inserted DHHC2. Thus, the first genetically encoded antibody sensitive to palmitoylation reveals an instructive role of local palmitoylation machinery in creating activity-responsive PSD-95 nanodomains, contributing to the PSD (re)organization.
Overview
The claims and statistics of this paper haven’t been checked yet.
Run the check — free, no account needed. It reads the open-access text and checks the sources it cites.
Integrity signals
Registry
Cites
Statistics
Figures
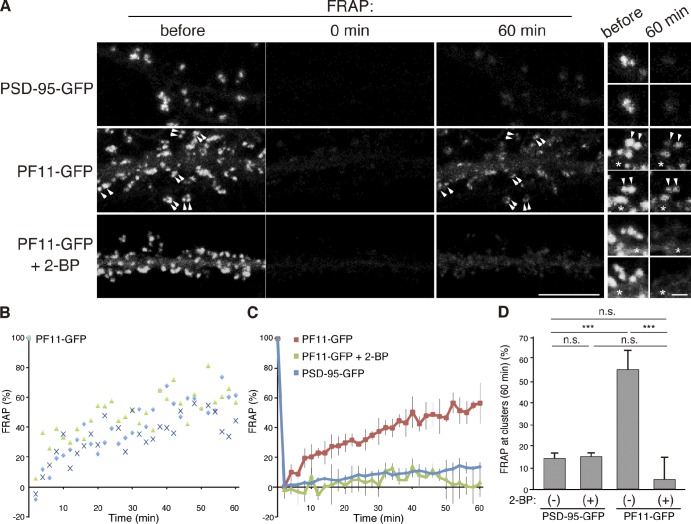
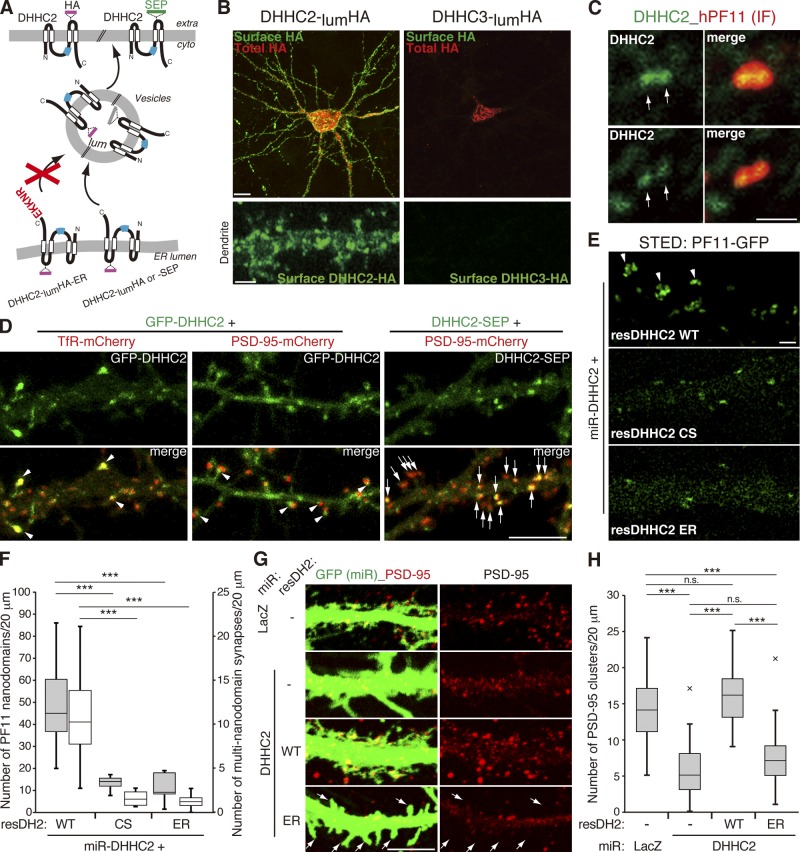
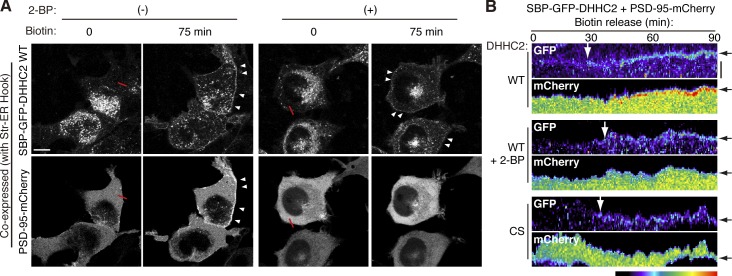
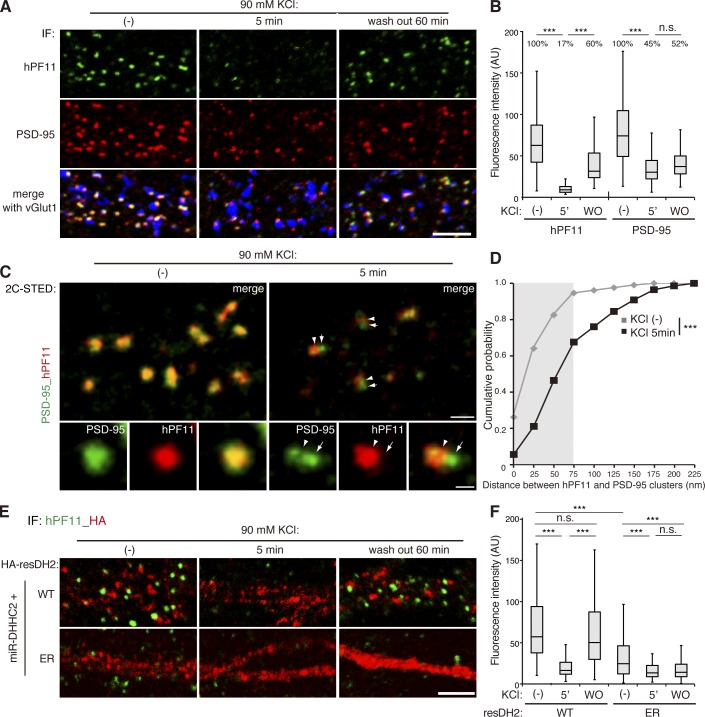
Verification
Claims the paper makes
The claims and statistics of this paper haven’t been checked yet.
Run the check — free, no account needed. It reads the open-access text and checks the sources it cites.
Claims other papers make about this one
Each is checked against this paper’s own text: does it say what the citing paper says it does?
The cited source doesn’t support the claim as written.
In the citing paper
“The average estimated diameter of ~80 nm for RIM1/2 NCs was very close to the reported size of PSD-95 and AMPA receptor (AMPAR) NCs4–6.”
From A trans-synaptic nanocolumn aligns neurotransmitter release to receptors (2016) · cites this paper as [6]
Checked by a reasoning model — may be wrong.
Experimental — accuracy not yet measuredThe source backs part of the claim, not all of it — or backs it for a different population, condition or comparison.
In the citing paper
“These presynaptic RIM nanoclusters closely aligned with concentrated postsynaptic receptors and scaffolding proteins4–6, suggesting a transsynaptic molecular “nanocolumn.””
From A trans-synaptic nanocolumn aligns neurotransmitter release to receptors (2016) · cites this paper as [6]
Experimental — accuracy not yet measuredThe cited source says what the claim attributes to it.
In the citing paper
“The alignment of pre and postsynaptic nanoscale subdomains4–6 suggests that even small synapses may be composed of dynamic functional modules28,29.”
From A trans-synaptic nanocolumn aligns neurotransmitter release to receptors (2016) · cites this paper as [6]
Self-check
Percentages, sums and reported differences re-computed from the paper’s own numbers.
The self-check needs the paper’s full text.
Citations
Cites
A guide to choosing fluorescent proteins
Shaner, N. C., Steinbach, P. A., & Tsien, R. Y. (2005) · Nature Methods · doi:10.1038/nmeth819 · Cited by 2,823
Visualizing secretion and synaptic transmission with pH-sensitive green fluorescent proteins
Miesenböck, G., Angelis, D. A. D., & Rothman, J. E. (1998) · Nature · doi:10.1038/28190 · Cited by 2,569
PDZ domain proteins of synapses
Kim, E., & Sheng, M. (2004) · Nature reviews. Neuroscience · doi:10.1038/nrn1517 · Cited by 1,630
PSD-95 Involvement in Maturation of Excitatory Synapses
El-Husseini, A. E.-D., Schnell, E., Chetkovich, D. M., Nicoll, R. A., & Bredt, D. S. (2000) · Science · doi:10.1126/science.290.5495.1364 · Cited by 1,303
Palmitoylation: policing protein stability and traffic
Linder, M. E., & Deschenes, R. J. (2006) · Nature Reviews Molecular Cell Biology · doi:10.1038/nrm2084 · Cited by 1,192
Neurexins Induce Differentiation of GABA and Glutamate Postsynaptic Specializations via Neuroligins
Graf, E. R., Zhang, X., Jin, S., Linhoff, M. W., & Craig, A. M. (2004) · Cell · doi:10.1016/j.cell.2004.11.035 · Cited by 1,029
An Acylation Cycle Regulates Localization and Activity of Palmitoylated Ras Isoforms
Rocks, O., Peyker, A., Kahms, M., Verveer, P., Koerner, C., Lumbierres, M., Kuhlmann, J., Waldmann, H., Wittinghofer, A., & Bastiaens, P. (2005) · Science · doi:10.1126/science.1105654 · Cited by 866
Neuroligins Determine Synapse Maturation and Function
Varoqueaux, F., Aramuni, G., Rawson, R. L., Mohrmann, R., Missler, M., Gottmann, K., Zhang, W., Südhof, T. C., & Brose, N. (2006) · Neuron · doi:10.1016/j.neuron.2006.09.003 · Cited by 837
Superresolution Imaging of Chemical Synapses in the Brain
Dani, A., Huang, B., Bergan, J. F., Dulac, C. G., & Zhuang, X. (2010) · Neuron · doi:10.1016/j.neuron.2010.11.021 · Cited by 748
Control of Excitatory and Inhibitory Synapse Formation by Neuroligins
Chih, B., Engelman, H. S., & Scheiffele, P. (2005) · Science · doi:10.1126/science.1107470 · Cited by 730
Synchronization of secretory protein traffic in populations of cells
Boncompain, G., Divoux, S., Gareil, N., de Forges, H., Lescure, A., Latreche, L., Mercanti, V., Jollivet, F., Raposo, G., & Perez, F. (2012) · Nature Methods · doi:10.1038/nmeth.1928 · Cited by 630
Self-citationProtein palmitoylation in neuronal development and synaptic plasticity
Fukata, Y., & Fukata, M. (2010) · Nature reviews. Neuroscience · doi:10.1038/nrn2788 · Cited by 625
Self-citationPhotoactivatable mCherry for high-resolution two-color fluorescence microscopy
Subach, F. V., Patterson, G. H., Manley, S., Gillette, J. M., Lippincott‐Schwartz, J., & Verkhusha, V. V. (2009) · Nature Methods · doi:10.1038/nmeth.1298 · Cited by 608
Synaptic Strength Regulated by Palmitate Cycling on PSD-95
El-Husseini, A., Schnell, E., Dakoji, S., Sweeney, N. T., Zhou, Q., Prange, O., Gauthier-Campbell, C., Aguilera-Moreno, A., Nicoll, R. A., & Bredt, D. S. (2002) · Cell · doi:10.1016/s0092-8674(02)00683-9 · Cited by 569
Tomita, S., Chen, L., Kawasaki, Y., Petralia, R. S., Wenthold, R. J., Nicoll, R. A., & Bredt, D. S. (2003) · The Journal of Cell Biology · doi:10.1083/jcb.200212116 · Cited by 545
Neural palmitoyl-proteomics reveals dynamic synaptic palmitoylation
Kang, R., Wan, J., Arstikaitis, P., Takahashi, H., Huang, K., Bailey, A. O., Thompson, J. X., Roth, A. F., Drisdel, R. C., Mastro, R., et al. (2008) · Nature · doi:10.1038/nature07605 · Cited by 533
Identification of PSD-95 Palmitoylating Enzymes
Fukata, M., Fukata, Y., Adesnik, H., Nicoll, R. A., & Bredt, D. S. (2004) · Neuron · doi:10.1016/j.neuron.2004.12.005 · Cited by 532
Self-citationUltrastructure of dendritic spines: correlation between synaptic and spine morphologies
Arellano, J. I. (2007) · Frontiers in Neuroscience · doi:10.3389/neuro.01.1.1.010.2007 · Cited by 529
MEMBRANE-ASSOCIATED GUANYLATE KINASES REGULATE ADHESION AND PLASTICITY AT CELL JUNCTIONS
Funke, L., Dakoji, S., & Bredt, D. S. (2005) · Annual Review of Biochemistry · doi:10.1146/annurev.biochem.74.082803.133339 · Cited by 482
PSD-95 is required for activity-driven synapse stabilization.
Ehrlich, I., Klein, M., Rumpel, S., & Malinow, R. (2007) · Proceedings of the National Academy of Sciences · doi:10.1073/pnas.0609307104 · Cited by 470
Palmitoylation of Ligands, Receptors, and Intracellular Signaling Molecules
Resh, M. D. (2006) · Science s STKE · doi:10.1126/stke.3592006re14 · Cited by 423
Dynamin-dependent endocytosis of ionotropic glutamate receptors
Carroll, R. C., Beattie, E. C., Xia, H., Lüscher, C., Altschuler, Y., Nicoll, R. A., Malenka, R. C., & von Zastrow, M. (1999) · Proceedings of the National Academy of Sciences · doi:10.1073/pnas.96.24.14112 · Cited by 423
Elias, G. M., Funke, L., Stein, V., Grant, S., Bredt, D., & Nicoll, R. (2006) · Neuron · doi:10.1016/j.neuron.2006.09.012 · Cited by 413
Rao, A., Kim, E., Sheng, M., & Craig, A. M. (1998) · Journal of Neuroscience · doi:10.1523/jneurosci.18-04-01217.1998 · Cited by 399
Synapse-specific regulation of AMPA receptor function by PSD-95.
Béïque, J.-C., Lin, D.-T., Kang, M.-G., Aizawa, H., Takamiya, K., & Huganir, R. L. (2006) · Proceedings of the National Academy of Sciences · doi:10.1073/pnas.0608492103 · Cited by 398
The intracellular dynamic of protein palmitoylation
Salaün, C., Greaves, J., & Chamberlain, L. H. (2010) · The Journal of Cell Biology · doi:10.1083/jcb.201008160 · Cited by 367
The postsynaptic density proteins Homer and Shank form a polymeric network structure
Hayashi, M. K., Tang, C., Verpelli, C., Narayanan, R., Stearns, M. H., Xu, R.-M., Li, H., Sala, C., & Hayashi, Y. (2009) · Cell · doi:10.1016/j.cell.2009.01.050 · Cited by 356
Protein palmitoylation: a regulator of neuronal development and function
El-Husseini, A., & Bredt, D. S. (2002) · Nature reviews. Neuroscience · doi:10.1038/nrn940 · Cited by 341
Synaptic Targeting of the Postsynaptic Density Protein PSD-95 Mediated by Lipid and Protein Motifs
Craven, S. E., El-Husseini, A., & Bredt, D. S. (1999) · Neuron · doi:10.1016/s0896-6273(00)80705-9 · Cited by 326
PSD-95 Is Required to Sustain the Molecular Organization of the Postsynaptic Density
Chen, X., Nelson, C. D., Li, X., Winters, C. A., Azzam, R. N., Sousa, A. A., Leapman, R. D., Gainer, H., Sheng, M., & Reese, T. S. (2011) · Journal of Neuroscience · doi:10.1523/jneurosci.5968-10.2011 · Cited by 320
Postsynaptic assembly induced by neurexin-neuroligin interaction and neurotransmitter
Nam, C. I., & Chen, L. (2005) · Proceedings of the National Academy of Sciences · doi:10.1073/pnas.0502038102 · Cited by 314
Detection of GTP-Tubulin Conformation in Vivo Reveals a Role for GTP Remnants in Microtubule Rescues
Dimitrov, A., Quesnoit, M., Moutel, S., Cantaloube, I., Poüs, C., & Perez, F. (2008) · Science · doi:10.1126/science.1165401 · Cited by 313
Self-citationTopinka, J. R., & Bredt, D. S. (1998) · Neuron · doi:10.1016/s0896-6273(00)80440-7 · Cited by 302
Laminar Organization of the NMDA Receptor Complex within the Postsynaptic Density
Valtschanoff, J. G., & Weinberg, R. J. (2001) · Journal of Neuroscience · doi:10.1523/jneurosci.21-04-01211.2001 · Cited by 301
Synaptic trafficking of glutamate receptors by MAGUK scaffolding proteins
Elias, G. M., & Nicoll, R. A. (2007) · Trends in Cell Biology · doi:10.1016/j.tcb.2007.07.005 · Cited by 288
El-Husseini, A., Craven, S. E., Chetkovich, D. M., Firestein, B. L., Schnell, E., Aoki, C. J., & Bredt, D. S. (2000) · The Journal of Cell Biology · doi:10.1083/jcb.148.1.159 · Cited by 272
Nakagawa, T., Futai, K., Lashuel, H. A., Lo, I., Okamoto, K., Walz, T., Hayashi, Y., & Sheng, M. (2004) · Neuron · doi:10.1016/j.neuron.2004.10.012 · Cited by 250
Dynamic Interaction of Stargazin-like TARPs with Cycling AMPA Receptors at Synapses
Tomita, S., Fukata, M., Nicoll, R. A., & Bredt, D. S. (2004) · Science · doi:10.1126/science.1090262 · Cited by 234
Self-citationKuriu, T., Inoue, A., Bito, H., Sobue, K., & Okabe, S. (2006) · Journal of Neuroscience · doi:10.1523/jneurosci.0522-06.2006 · Cited by 219
Mobile DHHC palmitoylating enzyme mediates activity-sensitive synaptic targeting of PSD-95
Noritake, J., Fukata, Y., Iwanaga, T., Hosomi, N., Tsutsumi, R., Matsuda, N., Tani, H., Iwanari, H., Mochizuki, Y., Kodama, T., et al. (2009) · The Journal of Cell Biology · doi:10.1083/jcb.200903101 · Cited by 217
Self-citationPetersen, J. D., Chen, X., Vinadé, L., Döṣemeci, A., Lisman, J. E., & Reese, T. S. (2003) · Journal of Neuroscience · doi:10.1523/jneurosci.23-35-11270.2003 · Cited by 212
Palmitoylation by DHHC5/8 Targets GRIP1 to Dendritic Endosomes to Regulate AMPA-R Trafficking
Thomas, G. M., Hayashi, T., Chiu, S., Chen, C.-M., & Huganir, R. L. (2012) · Neuron · doi:10.1016/j.neuron.2011.11.021 · Cited by 186
TARP Phosphorylation Regulates Synaptic AMPA Receptors through Lipid Bilayers
Sumioka, A., Yan, D., & Tomita, S. (2010) · Neuron · doi:10.1016/j.neuron.2010.04.035 · Cited by 167
Structural plasticity with preserved topology in the postsynaptic protein network
Blanpied, T. A., Kerr, J. M., & Ehlers, M. (2008) · Proceedings of the National Academy of Sciences · doi:10.1073/pnas.0711669105 · Cited by 139
Identification of G Protein α Subunit-Palmitoylating Enzyme
Tsutsumi, R., Fukata, Y., Noritake, J., Iwanaga, T., Perez, F., & Fukata, M. (2008) · Molecular and Cellular Biology · doi:10.1128/mcb.01144-08 · Cited by 139
Self-citationRecombinant Antibodies to the Small GTPase Rab6 as Conformation Sensors
Nizak, C., Monier, S., Nery, E. D., Moutel, S., Goud, B., & Perez, F. (2003) · Science · doi:10.1126/science.1083911 · Cited by 130
Self-citationNizak, C., Lluesma, S. M., Moutel, S., Roux, A., Kreis, T. E., Goud, B., & Perez, F. (2003) · Traffic · doi:10.1034/j.1600-0854.2003.00132.x · Cited by 113
Self-citationPickard, L., Noël, J., Duckworth, J. K., Fitzjohn, S. M., Henley, J. M., Collingridge, G. L., & Molnár, E. (2001) · Neuropharmacology · doi:10.1016/s0028-3908(01)00127-7 · Cited by 109
Shuttling of G Protein Subunits between the Plasma Membrane and Intracellular Membranes
Chisari, M., Saini, D. K., Kalyanaraman, V., & Gautam, N. (2007) · Journal of Biological Chemistry · doi:10.1074/jbc.m704246200 · Cited by 98
Gorleku, O. A., Barns, A.-M., Prescott, G. R., Greaves, J., & Chamberlain, L. H. (2011) · Journal of Biological Chemistry · doi:10.1074/jbc.m111.272369 · Cited by 82
Presynaptic Trafficking of Synaptotagmin I Is Regulated by Protein Palmitoylation
Kang, R., Swayze, R. D., Lisé, M.-F., Gerrow, K., Mullard, A., Honer, W. G., & El-Husseini, A. (2004) · Journal of Biological Chemistry · doi:10.1074/jbc.m404981200 · Cited by 80
Greaves, J., Carmichael, J. A., & Chamberlain, L. H. (2011) · Molecular Biology of the Cell · doi:10.1091/mbc.e10-11-0924 · Cited by 75
A multi-Fc-species system for recombinant antibody production
Moutel, S., Marjou, A. E., Vielemeyer, O., Nizak, C., Benaroch, P., Dübel, S., & Perez, F. (2009) · BMC Biotechnology · doi:10.1186/1472-6750-9-14 · Cited by 71
Self-citationProtein modifications involved in neurotransmitter and gasotransmitter signaling
Sen, N., & Snyder, S. H. (2010) · Trends in Neurosciences · doi:10.1016/j.tins.2010.07.004 · Cited by 54
Structure and composition of the postsynaptic density during development
Swulius, M. T., Kubota, Y., Forest, A., & Waxham, M. N. (2010) · The Journal of Comparative Neurology · doi:10.1002/cne.22451 · Cited by 51
Lorenzon, N. M., Haarmann, C., Norris, E., Papadopoulos, S., & Beam, K. G. (2004) · Journal of Biological Chemistry · doi:10.1074/jbc.m405318200 · Cited by 27
Tagging of NS5A expressed from a functional hepatitis C virus replicon
McCormick, C. J., Maucourant, S., Griffin, S. D. C., Rowlands, D. J., & Harris, M. (2006) · Journal of General Virology · doi:10.1099/vir.0.81553-0 · Cited by 22
Characterization of single chain antibody targets through yeast two hybrid
Vielemeyer, O., Nizak, C., Jiménez, A. J., Échard, A., Goud, B., Camonis, J., Rain, J., & Perez, F. (2010) · BMC Biotechnology · doi:10.1186/1472-6750-10-59 · Cited by 21
Self-citation
Cited by
Sorted by citations
Fluorescence nanoscopy in cell biology
Sahl, S. J., Hell, S. W., & Jakobs, S. (2017) · Nature Reviews Molecular Cell Biology · doi:10.1038/nrm.2017.71 · Cited by 996
Structure, Function, and Pharmacology of Glutamate Receptor Ion Channels
Hansen, K. B., Wollmuth, L. P., Bowie, D., Furukawa, H., Menniti, F. S., Sobolevsky, A. I., Swanson, G. T., Swanger, S. A., Greger, I. H., Nakagawa, T., et al. (2021) · Pharmacological Reviews · doi:10.1124/pharmrev.120.000131 · Cited by 686
A trans-synaptic nanocolumn aligns neurotransmitter release to receptors
Tang, A.-H., Chen, H., Li, T. P., Metzbower, S. R., MacGillavry, H. D., & Blanpied, T. A. (2016) · Nature · doi:10.1038/nature19058 · Cited by 677
MINFLUX nanoscopy delivers 3D multicolor nanometer resolution in cells
Gwosch, K. C., Pape, J. K., Balzarotti, F., Hoess, P., Ellenberg, J., Ries, J., & Hell, S. W. (2020) · Nature Methods · doi:10.1038/s41592-019-0688-0 · Cited by 570
Choquet, D., & Triller, A. (2013) · Neuron · doi:10.1016/j.neuron.2013.10.013 · Cited by 560
Metadata
- Authors
- Fukata, Y., Dimitrov, A., Boncompain, G., Vielemeyer, O., Perez, F., & Fukata, M.
- Affiliations
- National Institute for Physiological Sciences (JP)
- Centre National de la Recherche Scientifique (FR)
- Centre National de la Recherche Scientifique, Unité Mixte de Recherche 144 2 and 3
- Corresponding author
- Perez, Franck
- Fukata, Masaki
- Venue
- Journal of Cell Biology
- Publisher
- Rockefeller University Press
- Published
- 2013-07-08
- Volume
- 202
- Issue
- 1
- Pages
- 145-161
- ISSN
- 0021-9525 (ISSN-L)
- 1540-8140
- PMC
- PMC3704990
- OpenAlex
- W2168234829
- Cited by
- 262
- References
- 58
- Citations by year
- 2026: 8 · 2025: 13 · 2024: 23 · 2023: 12 · 2022: 20 · 2021: 28 · 2020: 24 · 2019: 21 · 2018: 23 · 2017: 27 · 2016: 20 · 2015: 20 · 2014: 17 · 2013: 6
- FWCI
- 10.31
- Type
- journal article
- Language
- en
- Open access
- hybrid
- doi.org
- Licence
- cc-by-nc-sa
- Locations
- The Journal of Cell Biology (publishedVersion, cc-by-nc-sa)
- Europe PMC (PubMed Central) (publishedVersion, cc-by-nc-sa)
- PubMed Central (publishedVersion, cc-by-nc-sa)
- PubMed (publishedVersion)
- Funders
- Agence Nationale de la Recherche (ANR-09-BLAN-0290)
- Japan Society for the Promotion of Science
- Topics
- Life Sciences › Neuroscience › Cellular and Molecular Neuroscience › Neuroscience and Neuropharmacology Research
- Life Sciences › Biochemistry, Genetics and Molecular Biology › Molecular Biology › Protein Kinase Regulation and GTPase Signaling
- Life Sciences › Biochemistry, Genetics and Molecular Biology › Cell Biology › Cellular transport and secretion
- Keywords
- palmitoylation, PSD-95, postsynaptic density, dendritic spines, plasma membrane targeting, synaptic organization
- MeSH terms
- Disks Large Homolog 4 Protein, Animals, Chlorocebus aethiops, Fluorescent Dyes, Hippocampus, Humans, Membrane Proteins, Synaptic Transmission, Neuronal Plasticity, Neurons, Palmitates, Sensitivity and Specificity, Structure-Activity Relationship, Transfection, COS Cells, Dendritic Spines, Green Fluorescent Proteins, Mice, Rats, Guanylate Kinases, Lipoylation, HEK293 Cells, Post-Synaptic Density
About these checks
Registry, retraction, Cites and statistics results are computed, not judged, with one exception: a printed reference that no index lists is read once by a model before it counts as a citation error. Claims are extracted by a model and kept only when their quote appears verbatim in the text; each cited source is then checked, with a model’s help, for whether it says what the claim relies on. Those verdicts can be wrong — read the claim’s quote and the cited source before relying on one.
Statistics and arithmetic are recomputed, not judged.
Confidence bands are shown only for fields calibrated on our annotated test set. None is calibrated yet, so no band is shown.
What counts as a claim ›How we measure confidence ›How we check this ›
Are you an author, or do you see a problem with this page? Request a review
