

The DOI matches its Crossref record; 49 of the 49 references it cites were found in a registry or an index.
Schwann cell autophagy, myelinophagy, initiates myelin clearance from injured nerves
Open accessAbstract
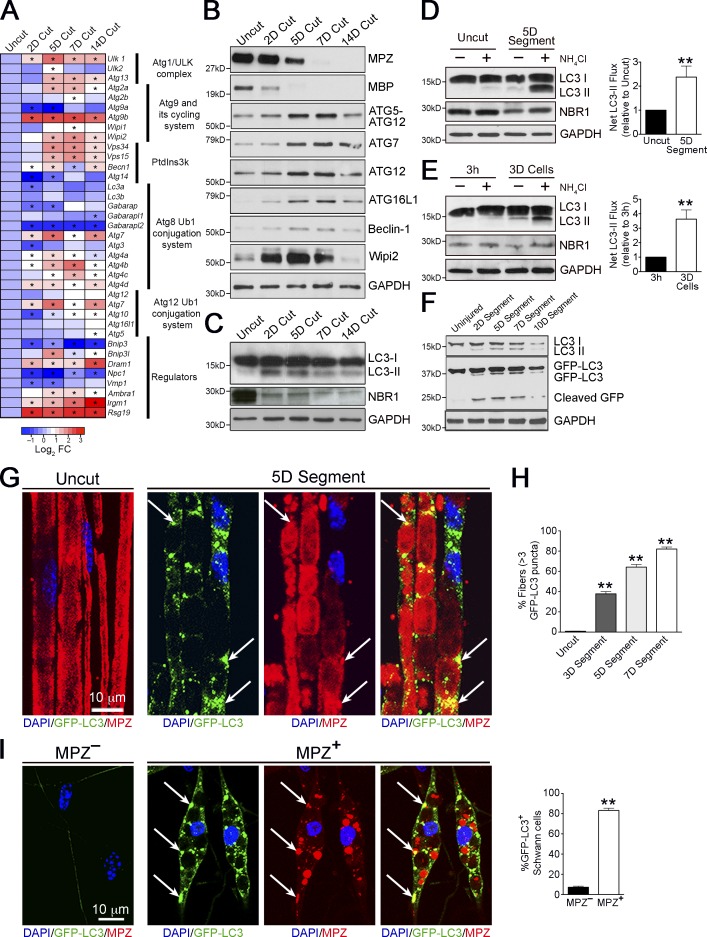
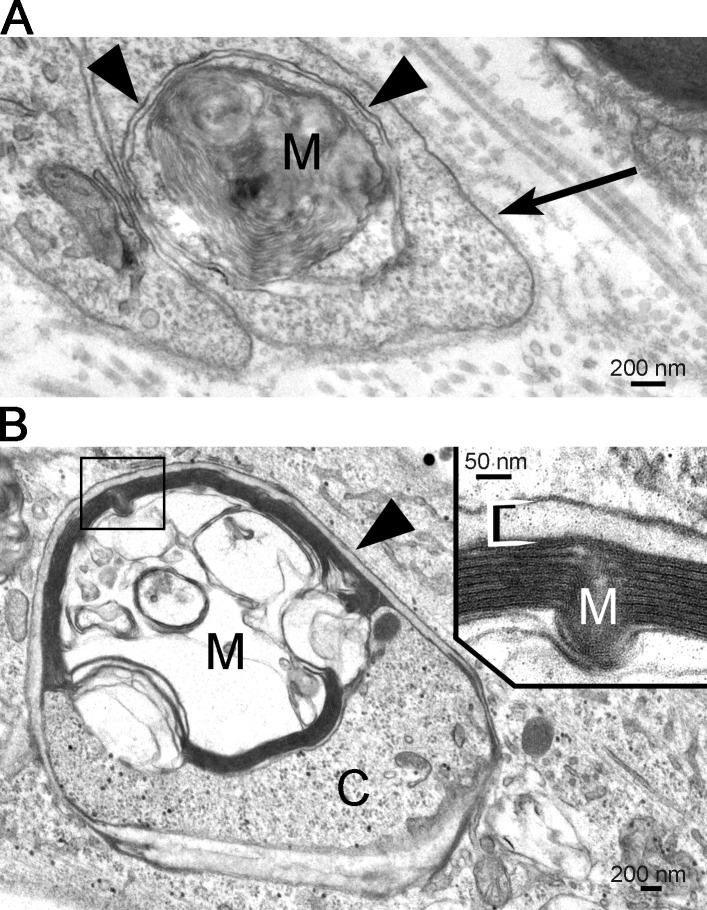
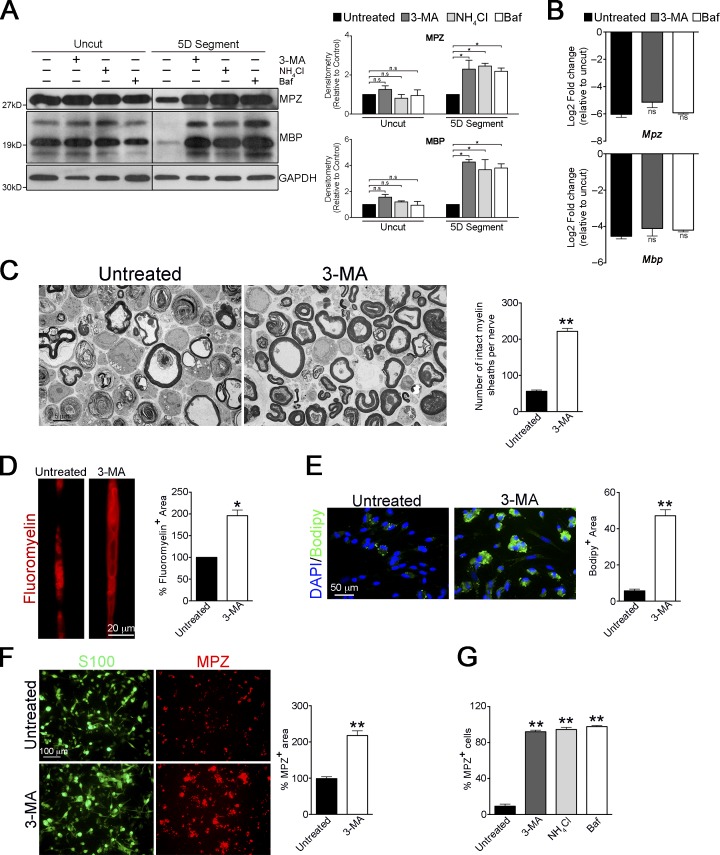
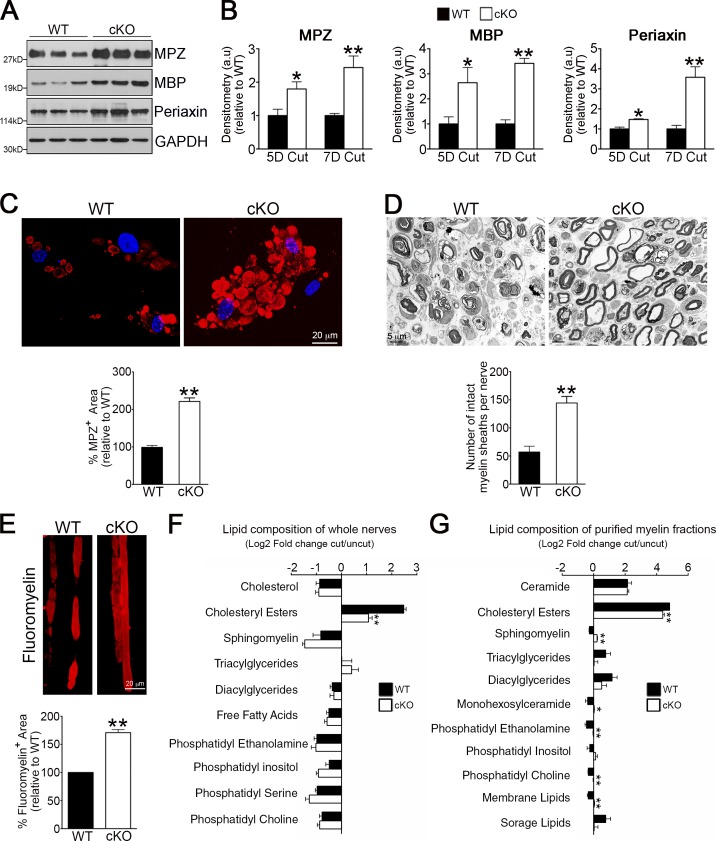
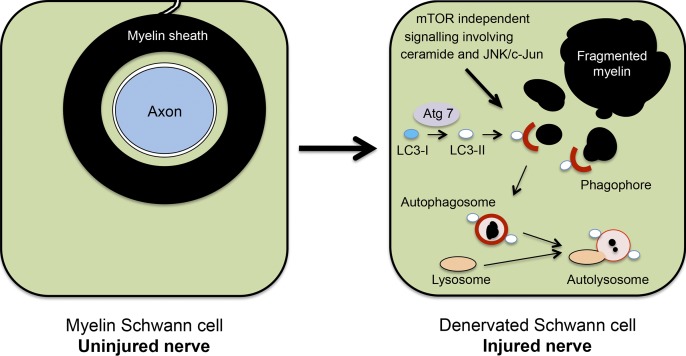
Although Schwann cell myelin breakdown is the universal outcome of a remarkably wide range of conditions that cause disease or injury to peripheral nerves, the cellular and molecular mechanisms that make Schwann cell–mediated myelin digestion possible have not been established. We report that Schwann cells degrade myelin after injury by a novel form of selective autophagy, myelinophagy. Autophagy was up-regulated by myelinating Schwann cells after nerve injury, myelin debris was present in autophagosomes, and pharmacological and genetic inhibition of autophagy impaired myelin clearance. Myelinophagy was positively regulated by the Schwann cell JNK/c-Jun pathway, a central regulator of the Schwann cell reprogramming induced by nerve injury. We also present evidence that myelinophagy is defective in the injured central nervous system. These results reveal an important role for inductive autophagy during Wallerian degeneration, and point to potential mechanistic targets for accelerating myelin clearance and improving demyelinating disease.
Overview
The claims and statistics of this paper haven’t been checked yet.
Run the check — free, no account needed. It reads the open-access text and checks the sources it cites.
Integrity signals
Registry
Cites
Statistics
Figures
Verification
Claims the paper makes
The claims and statistics of this paper haven’t been checked yet.
Run the check — free, no account needed. It reads the open-access text and checks the sources it cites.
Claims other papers make about this one
Each is checked against this paper’s own text: does it say what the citing paper says it does?
In the citing paper
“After nerve injury, Schwann cells oversee the capture of myelin debris in autophagosomes in a process termed “myelinophagy” [459,462,463],”
From Autophagy and ALS: mechanistic insights and therapeutic implications (2022) · cites this paper as [463]
Self-check
Percentages, sums and reported differences re-computed from the paper’s own numbers.
The self-check needs the paper’s full text.
Citations
Cites
A RAPID METHOD OF TOTAL LIPID EXTRACTION AND PURIFICATION
Bligh, E. G., & Dyer, W. J. (1959) · Canadian Journal of Biochemistry and Physiology · doi:10.1139/o59-099 · Cited by 54,751
Repertoires of Autophagy in the Pathogenesis of Ocular Diseases
Li, Y., Jiang, Q. L., Cao, G.-F., Yao, J., & Yan, B. (2015) · Cellular Physiology and Biochemistry · doi:10.1159/000373980 · Cited by 16,351
Calamita, E., Schmid, M., Kunz, M., Ndebele-Murisa, M. R., Magadza, C. H. D., Nyambe, I., & Wehrli, B. (2019) · Figshare · doi:10.26181/6153922fe919c · Cited by 4,239
Guidelines for the use and interpretation of assays for monitoring autophagy
Klionsky, D. J., Abdalla, F. C., Abeliovich, H., Abraham, R. T., Acevedo-Arozena, A., Adeli, K., Agholme, L., Agnello, M., Agostinis, P., Aguirre-Ghiso, J. A., et al. (2012) · Autophagy · doi:10.4161/auto.19496 · Cited by 3,996 · cited 15×
“Conversely, levels of the autophagy substrate NBR1 (Klionsky et al., 2012) showed a clear decrease in injured nerves (Fig.”
InfluentialAutophagy regulates lipid metabolism
Singh, R., Kaushik, S., Wang, Y., Xiang, Y., Novak, I., Komatsu, M., Tanaka, K., Cuervo, A. M., & Czaja, M. J. (2009) · Nature · doi:10.1038/nature07976 · Cited by 3,975
Autophagy and the Integrated Stress Response
Kroemer, G., Mariño, G., & Levine, B. (2010) · Molecular Cell · doi:10.1016/j.molcel.2010.09.023 · Cited by 3,506
Autophagy in immunity and inflammation
Levine, B., Mizushima, N., & Virgin, H. W. (2011) · Nature · doi:10.1038/nature09782 · Cited by 3,289
Impairment of starvation-induced and constitutive autophagy in Atg7 -deficient mice
Komatsu, M., Waguri, S., Ueno, T., Iwata, J., Murata, S., Tanida, I., Ezaki, J., Mizushima, N., Ohsumi, Y., Uchiyama, Y., et al. (2005) · The Journal of Cell Biology · doi:10.1083/jcb.200412022 · Cited by 2,331
Mizushima, N., Yamamoto, A., Matsui, M., Yoshimori, T., & Ohsumi, Y. (2004) · Molecular Biology of the Cell · doi:10.1091/mbc.e03-09-0704 · Cited by 2,105
The machinery of macroautophagy
Feng, Y., He, D., Yao, Z., & Klionsky, D. J. (2014) · Cell Research · doi:10.1038/cr.2013.168 · Cited by 2,083
Cited by
Sorted by citations
Guidelines for the use and interpretation of assays for monitoring autophagy (4th edition) 1
Klionsky, D. J., Abdel-Aziz, A. K., Abdelfatah, S., Abdellatif, M., Abdoli, A., Abel, S., Abeliovich, H., Abildgaard, M. H., Abudu, Y. P., Acevedo-Arozena, A., et al. (2021) · Autophagy · doi:10.1080/15548627.2020.1797280 · Cited by 2,897
Molecular definitions of autophagy and related processes
Galluzzi, L., Baehrecke, E. H., Ballabio, A., Boya, P., Bravo‐San Pedro, J. M., Cecconi, F., Choi, A. M., Chu, C. T., Codogno, P., Colombo, M. I., et al. (2017) · The EMBO Journal · doi:10.15252/embj.201796697 · Cited by 1,646
Autophagy in major human diseases
Klionsky, D. J., Petroni, G., Amaravadi, R. K., Baehrecke, E. H., Ballabio, A., Boya, P., Bravo‐San Pedro, J. M., Cadwell, K., Cecconi, F., Choi, A. M. K., et al. (2021) · The EMBO Journal · doi:10.15252/embj.2021108863 · Cited by 1,585
The repair Schwann cell and its function in regenerating nerves
Jessen, K. R., & Mirsky, R. (2016) · The Journal of Physiology · doi:10.1113/jp270874 · Cited by 1,178
Self-citationAutophagy and Neurodegeneration: Pathogenic Mechanisms and Therapeutic Opportunities
Menzies, F. M., Fleming, A., Caricasole, A., Bento, C. F., Andrews, S. P., Ashkenazi, A., Füllgrabe, J., Jackson, A., Jimenez Sanchez, M., Karabiyik, C., et al. (2017) · Neuron · doi:10.1016/j.neuron.2017.01.022 · Cited by 1,134
Autophagy-Dependent Ferroptosis: Machinery and Regulation
Liu, J., Kuang, F., Kroemer, G., Klionsky, D. J., Kang, R., & Tang, D. (2020) · Cell chemical biology · doi:10.1016/j.chembiol.2020.02.005 · Cited by 819
A human cell atlas of fetal gene expression
Cao, J., O’Day, D. R., Pliner, H. A., Kingsley, P. D., Deng, M., Daza, R. M., Zager, M. A., Aldinger, K. A., Blecher-Gonen, R., Zhang, F., et al. (2020) · Science · doi:10.1126/science.aba7721 · Cited by 764
Ubiquitin-Dependent And Independent Signals In Selective Autophagy
Khaminets, A., Behl, C., & Đikić, I. (2015) · Trends in Cell Biology · doi:10.1016/j.tcb.2015.08.010 · Cited by 750
The Success and Failure of the Schwann Cell Response to Nerve Injury
Jessen, K. R., & Mirsky, R. (2019) · Frontiers in Cellular Neuroscience · doi:10.3389/fncel.2019.00033 · Cited by 465
Self-citationMechanisms of Schwann cell plasticity involved in peripheral nerve repair after injury
Nocera, G., & Jacob, C. (2020) · Cellular and Molecular Life Sciences · doi:10.1007/s00018-020-03516-9 · Cited by 450
Mechanistic insights into selective autophagy pathways: lessons from yeast
Farré, J., & Subramani, S. E. (2016) · Nature Reviews Molecular Cell Biology · doi:10.1038/nrm.2016.74 · Cited by 403
Repair Schwann cell update: Adaptive reprogramming, EMT, and stemness in regenerating nerves
Jessen, K. R., & Arthur‐Farraj, P. (2019) · Glia · doi:10.1002/glia.23532 · Cited by 350
Self-citationAutophagy and Microglia: Novel Partners in Neurodegeneration and Aging
Plaza-Zabala, A., Sierra-Torre, V., & Sierra, A. (2017) · International Journal of Molecular Sciences · doi:10.3390/ijms18030598 · Cited by 323
Gomez-Sanchez, J. A., Pilch, K. S., van der Lans, M., Fazal, S. V., Benito, C., Wagstaff, L. J., Mirsky, R., & Jessen, K. R. (2017) · Journal of Neuroscience · doi:10.1523/jneurosci.1453-17.2017 · Cited by 287
Self-citationLi, R., Li, D., Wu, C., Ye, L., Wu, Y., Yuan, Y., Yang, S., Xie, L., Mao, Y., Jiang, T., et al. (2020) · Theranostics · doi:10.7150/thno.40919 · Cited by 292
Emerging Mechanisms in Initiating and Terminating Autophagy
Antonioli, M., Rienzo, M. D., Piacentini, M., & Fimia, G. M. (2016) · Trends in Biochemical Sciences · doi:10.1016/j.tibs.2016.09.008 · Cited by 271
Migrating Schwann cells direct axon regeneration within the peripheral nerve bridge
Min, Q., Parkinson, D. B., & Dun, X. (2020) · Glia · doi:10.1002/glia.23892 · Cited by 249
The Axon-Myelin Unit in Development and Degenerative Disease
Stassart, R. M., Möbius, W., Nave, K.-A., & Edgar, J. M. (2018) · Frontiers in Neuroscience · doi:10.3389/fnins.2018.00467 · Cited by 246
Zhou, T. G., Zheng, Y., Sun, L. J., Badea, S. R., Jin, Y., Liu, Y., Rolfe, A. J., Sun, H., Wang, X., Cheng, Z., et al. (2019) · Nature Neuroscience · doi:10.1038/s41593-018-0324-9 · Cited by 247
Schwann cell functions in peripheral nerve development and repair
Bosch-Queralt, M., Fledrich, R., & Stassart, R. M. (2022) · Neurobiology of Disease · doi:10.1016/j.nbd.2022.105952 · Cited by 257
Brosius Lutz, A., Chung, W.-S., Sloan, S. A., Carson, G. A., Zhou, L., Lovelett, E., Posada, S., Zuchero, J. B., & Barres, B. A. (2017) · Proceedings of the National Academy of Sciences · doi:10.1073/pnas.1710566114 · Cited by 225
The multicellular complexity of peripheral nerve regeneration
Cattin, A.-L., & Lloyd, A. C. (2016) · Current Opinion in Neurobiology · doi:10.1016/j.conb.2016.04.005 · Cited by 227
Arthur‐Farraj, P., Morgan, C. C., Adamowicz, M. J., Gomez-Sanchez, J. A., Fazal, S. V., Beucher, A., Razzaghi, B., Mirsky, R., Jessen, K. R., & Aitman, T. J. (2017) · Cell Reports · doi:10.1016/j.celrep.2017.08.064 · Cited by 198
Self-citationMechanisms of Selective Autophagy in Normal Physiology and Cancer
Mancias, J. D., & Kimmelman, A. C. (2016) · Journal of Molecular Biology · doi:10.1016/j.jmb.2016.02.027 · Cited by 196
Autophagy and ALS: mechanistic insights and therapeutic implications
Chua, J. P., De Calbiac, H., Kabashi, E., & Barmada, S. J. (2022) · Autophagy · doi:10.1080/15548627.2021.1926656 · Cited by 189
“somes in a process termed “myelinophagy” [459,462,463], and this function is impaired by”
BackgroundMolecular Mechanisms Involved in Schwann Cell Plasticity
Boerboom, A., Dion, V., Chariot, A., & Franzen, R. (2017) · Frontiers in Molecular Neuroscience · doi:10.3389/fnmol.2017.00038 · Cited by 192
Lindborg, J. A., Mack, M., & Zigmond, R. E. (2017) · Journal of Neuroscience · doi:10.1523/jneurosci.2085-17.2017 · Cited by 190
A glycolytic shift in Schwann cells supports injured axons
Babetto, E., Wong, K. M., & Beirowski, B. (2020) · Nature Neuroscience · doi:10.1038/s41593-020-0689-4 · Cited by 169
Jang, S. Y., Shin, Y. K., Park, S., Park, J. Y., Lee, H., Yoo, Y. H., Kim, J. K., & Park, H. T. (2015) · Glia · doi:10.1002/glia.22957 · Cited by 145
The Role of Cell Plasticity in Tissue Repair: Adaptive Cellular Reprogramming
Jessen, K. R., Mirsky, R., & Arthur‐Farraj, P. (2015) · Developmental Cell · doi:10.1016/j.devcel.2015.09.005 · Cited by 148
Self-citationHistory of the Selective Autophagy Research: How Did It Begin and Where Does It Stand Today?
Kirkin, V. (2019) · Journal of Molecular Biology · doi:10.1016/j.jmb.2019.05.010 · Cited by 143
Balakrishnan, A., Belfiore, L., Chu, T., Fleming, T., Midha, R., Biernaskie, J. A., & Schuurmans, C. (2021) · Frontiers in Molecular Neuroscience · doi:10.3389/fnmol.2020.608442 · Cited by 149
Peripheral nerve injury and axonotmesis: State of the art and recent advances
Alvites, R., Caseiro, A. R., Pedrosa, S. S., Branquinho, M., Ronchi, G., Geuna, S., Varejão, A. S. P., & Maurício, A. C. (2018) · Cogent Medicine · doi:10.1080/2331205x.2018.1466404 · Cited by 134
López‐Leal, R., Díaz-Viraqué, F., Catalán, R. J., Saquel, C., Enright, A. J., Iraola, G., & Court, F. A. (2020) · Journal of Cell Science · doi:10.1242/jcs.239004 · Cited by 134
Stierli, S., Napoli, I., White, I. J., Cattin, A.-L., Cabrejos, A. M., Calavia, N. G., Malong, L., Ribeiro, S., Sigurðardottir, J. N., Williams, R. L., et al. (2018) · Development · doi:10.1242/dev.170316 · Cited by 131
3D printing strategies for peripheral nerve regeneration
Petcu, E. B., Midha, R., McColl, E., Popa‐Wagner, A., Chirilă, T. V., & Dalton, P. D. (2018) · Biofabrication · doi:10.1088/1758-5090/aaaf50 · Cited by 124
Zhao, X., Li, N., Zhang, Z., Hong, J., Zhang, X., Hao, Y., Wang, J., Xie, Q., Zhang, Y., Li, H., et al. (2024) · Journal of Nanobiotechnology · doi:10.1186/s12951-024-02759-z · Cited by 121
Benito, C., Davis, C. M., Gomez-Sanchez, J. A., Turmaine, M., Meijer, D., Poli, V., Mirsky, R., & Jessen, K. R. (2017) · Journal of Neuroscience · doi:10.1523/jneurosci.3481-16.2017 · Cited by 120
Self-citationPathomechanisms in schwannoma development and progression
Helbing, D. L., Schulz, A., & Morrison, H. (2020) · Oncogene · doi:10.1038/s41388-020-1374-5 · Cited by 119
Schwann cell plasticity‐roles in tissue homeostasis, regeneration, and disease
Stierli, S., Imperatore, V., & Lloyd, A. C. (2019) · Glia · doi:10.1002/glia.23643 · Cited by 124
Neuronal autophagy and intercellular regulation of homeostasis in the brain
Kulkarni, A., Chen, J., & Maday, S. (2018) · Current Opinion in Neurobiology · doi:10.1016/j.conb.2018.02.008 · Cited by 125
Role of aramchol in steatohepatitis and fibrosis in mice
Iruarrizaga‐Lejarreta, M., Varela‐Rey, M., Fernández‐Ramos, D., Martínez‐Arranz, I., Delgado, T. C., Simón, J., Juan, V. G., delaCruz‐Villar, L., Azkargorta, M., Lavín, J. L., et al. (2017) · Hepatology Communications · doi:10.1002/hep4.1107 · Cited by 115
Self-citationAdvances of Schwann cells in peripheral nerve regeneration: From mechanism to cell therapy
Wei, C., Guo, Y., Ci, Z., Li, M., Zhang, Y., & Zhou, Y. (2024) · Biomedicine & Pharmacotherapy · doi:10.1016/j.biopha.2024.116645 · Cited by 111
The Endolysosomal System and Proteostasis: From Development to Degeneration
Winckler, B., Faúndez, V., Maday, S., Cai, Q., Almeida, C. G., & Zhang, H. (2018) · Journal of Neuroscience · doi:10.1523/jneurosci.1665-18.2018 · Cited by 111
Barton, M., John, J. A. S., Clarke, M., Wright, A. A., & Ekberg, J. A. K. (2017) · International Journal of Molecular Sciences · doi:10.3390/ijms18020287 · Cited by 104
Schwann cells contribute to keloid formation
Direder, M., Weiss, T., Copic, D., Vorstandlechner, V., Laggner, M., Pfisterer, K., Mildner, C. S., Klas, K., Bormann, D., Haslik, W., et al. (2022) · Matrix Biology · doi:10.1016/j.matbio.2022.03.001 · Cited by 104
Weiss, T., Taschner‐Mandl, S., Bileck, A., Slany, A., Kromp, F., Rifatbegovic, F., Frech, C., Windhager, R. H., Kitzinger, H. B., Tzou, C. J., et al. (2016) · Glia · doi:10.1002/glia.23045 · Cited by 97
Autophagy in Neuronal Development and Plasticity
Fleming, A., & Rubinsztein, D. C. (2020) · Trends in Neurosciences · doi:10.1016/j.tins.2020.07.003 · Cited by 93
Mixed Lineage Kinase Domain-like Protein MLKL Breaks Down Myelin following Nerve Injury
Ying, Z., Pan, C., Shao, T., Liu, L., Li, L., Guo, D., Zhang, S., Yuan, T., Cao, R., Jiang, Z., et al. (2018) · Molecular Cell · doi:10.1016/j.molcel.2018.09.011 · Cited by 90
Adipo-glial signaling mediates metabolic adaptation in peripheral nerve regeneration
Sundaram, V. K., Schütza, V., Schröter, N. H., Backhaus, A., Bilsing, A., Joneck, L., Seelbach, A., Mutschler, C., Gomez-Sanchez, J. A., Schäffner, E., et al. (2023) · Cell Metabolism · doi:10.1016/j.cmet.2023.10.017 · Cited by 93
Self-citationMyelin and macrophages in the PNS: An intimate relationship in trauma and disease
Klein, D., & Martini, R. (2015) · Brain Research · doi:10.1016/j.brainres.2015.11.033 · Cited by 89
The logistics of myelin biogenesis in the central nervous system
Snaidero, N., & Simons, M. (2017) · Glia · doi:10.1002/glia.23116 · Cited by 96
The role of TAM family receptors and ligands in the nervous system: From development to pathobiology
Shafit‐Zagardo, B., Gruber, R. C., & DuBois, J. C. (2018) · Pharmacology & Therapeutics · doi:10.1016/j.pharmthera.2018.03.002 · Cited by 89
Macrophage polarization in nerve injury: do Schwann cells play a role?
Stratton, J. A., & Shah, P. T. (2016) · Neural Regeneration Research · doi:10.4103/1673-5374.175042 · Cited by 86
Fazal, S. V., Gomez-Sanchez, J. A., Wagstaff, L. J., Musner, N., Otto, G., Janz, M., Mirsky, R., & Jessen, K. R. (2017) · Journal of Neuroscience · doi:10.1523/jneurosci.0986-17.2017 · Cited by 85
Self-citationSustained MAPK/ERK Activation in Adult Schwann Cells Impairs Nerve Repair
Cervellini, I., Galino, J., Zhu, N., Allen, S., Birchmeier, C., & Bennett, D. (2017) · Journal of Neuroscience · doi:10.1523/jneurosci.2255-17.2017 · Cited by 85
Weiss, T., Taschner‐Mandl, S., Janker, L., Bileck, A., Rifatbegovic, F., Kromp, F., Sorger, H., Kauer, M. O., Frech, C., Windhager, R. H., et al. (2021) · Nature Communications · doi:10.1038/s41467-021-21859-0 · Cited by 87
Directed Differentiation of Human Bone Marrow Stromal Cells to Fate-Committed Schwann Cells
Cai, S., Tsui, Y.-P., Tam, K.-W., Shea, G. K., Chang, R. S., Ao, Q., Shum, D. K., & Chan, Y. (2017) · Stem Cell Reports · doi:10.1016/j.stemcr.2017.08.004 · Cited by 82
The Role of Autophagy and Apoptosis in Neuropathic Pain Formation
Liao, M., Lu, K., Hsu, J., Lee, C., Cheng, M.-Y., & Ro, L. (2022) · International Journal of Molecular Sciences · doi:10.3390/ijms23052685 · Cited by 82
Jessen, K. R., & Mirsky, R. (2022) · Frontiers in Cellular Neuroscience · doi:10.3389/fncel.2021.820216 · Cited by 78
Self-citationDifferential regulation of autophagy during metabolic stress in astrocytes and neurons
Kulkarni, A., Dong, A., Kulkarni, V. V., Chen, J., Laxton, O., Anand, A., & Maday, S. (2019) · Autophagy · doi:10.1080/15548627.2019.1703354 · Cited by 81
Diversity of developing peripheral glia revealed by single-cell RNA sequencing
Tasdemir-Yilmaz, O. E., Druckenbrod, N. R., Olukoya, O., Dong, W., Yung, A. R., Bastille, I., Pazyra‐Murphy, M. F., Sitko, A. A., Hale, E., Vigneau, S., et al. (2021) · Developmental Cell · doi:10.1016/j.devcel.2021.08.005 · Cited by 77
Selective Autophagy Receptors in Neuronal Health and Disease
Conway, O., Akpinar, H. A., Rogov, V. V., & Kirkin, V. (2020) · Journal of Molecular Biology · doi:10.1016/j.jmb.2019.10.013 · Cited by 75
Flores, A., Gerónimo‐Olvera, C., Girardi, K. D. C. D. V., Ñecuñir, D., Patel, S. K., Bons, J., Wright, M. C., Geschwind, D. H., Höke, A., Gomez-Sanchez, J. A., et al. (2023) · EMBO Molecular Medicine · doi:10.15252/emmm.202317907 · Cited by 80
Self-citationMogha, A., Harty, B. L., Carlin, D., Joseph, J., Sanchez, N., Suter, U., Piao, X., Cavalli, V., & Monk, K. R. (2016) · Journal of Neuroscience · doi:10.1523/jneurosci.3854-15.2016 · Cited by 74
Axon degeneration: make the Schwann cell great again
Babetto, E., Beirowski, B., & Wong, K. M. (2017) · Neural Regeneration Research · doi:10.4103/1673-5374.205000 · Cited by 73
Norrmén, C., Figlia, G., Pfistner, P., Pereira, J. A., Bachofner, S., & Suter, U. (2018) · Journal of Neuroscience · doi:10.1523/jneurosci.3619-17.2018 · Cited by 74
Sun, J. F., Liao, Z., Li, Z., Li, H., Wu, Z., Chen, C., & Wang, H. (2022) · Experimental Neurology · doi:10.1016/j.expneurol.2022.114295 · Cited by 73
Zubiete‐Franco, I., García‐Rodríguez, J. L., Martinez‐Uña, M., Martínez-López, N., Woodhoo, A., de Juan, V. G., Beraza, N., Lage, S., Andrade, F., Llarena, M., et al. (2015) · Journal of Hepatology · doi:10.1016/j.jhep.2015.08.037 · Cited by 75
Self-citationBlocking Autophagy in Oligodendrocytes Limits Functional Recovery after Spinal Cord Injury
Saraswat Ohri, S., Bankston, A. N., Mullins, S. A., Liu, Y., Andres, K. R., Beare, J. E., Howard, R. M., Burke, D. A., Riegler, A. S., Smith, A. E., et al. (2018) · The Journal of Neuroscience · doi:10.1523/jneurosci.0679-17.2018 · Cited by 70
Aber, E. R., Griffey, C. J., Davies, T., Li, A. M., Yang, Y. J., Croce, K. R., Goldman, J. E., Grutzendler, J., Canman, J. C., & Yamamoto, A. (2022) · Cell Reports · doi:10.1016/j.celrep.2022.111480 · Cited by 73
Sun, J. F., Zeng, Q., Wu, Z., Huang, L., Sun, T., Liu, C., Zhang, B., Chen, C., & Wang, H. (2024) · Neurotherapeutics · doi:10.1016/j.neurot.2024.e00347 · Cited by 70
Wallerian demyelination: chronicle of a cellular cataclysm
Tricaud, N., & Park, H. T. (2017) · Cellular and Molecular Life Sciences · doi:10.1007/s00018-017-2565-2 · Cited by 70
Beyond Wrapping: Canonical and Noncanonical Functions of Schwann Cells
Taveggia, C., & Feltri, M. L. (2022) · Annual Review of Neuroscience · doi:10.1146/annurev-neuro-110920-030610 · Cited by 72
Zhou, W., Rahman, M. S. U., Sun, C., Li, S., Zhang, N., Chen, H., Han, C. C., Xu, S., & Liu, Y. (2024) · Advanced Materials · doi:10.1002/adma.202307805 · Cited by 65
An RNA-sequencing transcriptome of the rodent Schwann cell response to peripheral nerve injury
Lutz, A. B., Lucas, T. A., Carson, G. A., Caneda, C., Zhou, L., Barres, B. A., Buckwalter, M. S., & Sloan, S. A. (2022) · Journal of Neuroinflammation · doi:10.1186/s12974-022-02462-6 · Cited by 65
Zhang, Q., Nguyen, P. D., Xu, Q., Park, W., Lee, S., Furuhashi, A., & Le, A. D. (2016) · Stem Cells Translational Medicine · doi:10.5966/sctm.2016-0177 · Cited by 65
Nerve regeneration in the peripheral and central nervous systems
Gordon, T. (2016) · The Journal of Physiology · doi:10.1113/jp270898 · Cited by 64
Neuroimmune interactions and immunoengineering strategies in peripheral nerve repair
Wofford, K. L., Shultz, R. B., Burrell, J. C., & Cullen, D. K. (2021) · Progress in Neurobiology · doi:10.1016/j.pneurobio.2021.102172 · Cited by 64
Autophagy dysfunction in neuropathic pain
Liu, X., Zhu, M., Ju, Y., Li, A., & Sun, X. (2019) · Neuropeptides · doi:10.1016/j.npep.2019.03.005 · Cited by 63
Huang, Z., Powell, R., Phillips, J. B., & Haastert‐Talini, K. (2020) · Cells · doi:10.3390/cells9112497 · Cited by 66
Arthur‐Farraj, P., & Coleman, M. P. (2021) · Neurotherapeutics · doi:10.1007/s13311-021-01125-3 · Cited by 63
Oshima, E., Hayashi, Y., Xie, Z., Sato, H., Hitomi, S., Shibuta, I., Urata, K., Ni, J., Iwata, K., Shirota, T., et al. (2023) · Journal of Neuroinflammation · doi:10.1186/s12974-023-02943-2 · Cited by 61
Yin, G., Yu, B., Liu, C., Lin, Y., Xie, Z., Hu, Y., & Lin, H. (2021) · The International Journal of Biochemistry & Cell Biology · doi:10.1016/j.biocel.2021.105921 · Cited by 59
Meng, C., Shen, M., Wu, X., Li, Y., Wang, L., He, Q., Shi, H., & Ding, F. (2021) · Stem Cell Research & Therapy · doi:10.1186/s13287-020-02125-4 · Cited by 59
Belgrad, J., Pace, R. D., & Fields, R. D. (2019) · Journal of Neuroscience · doi:10.1523/jneurosci.1066-19.2019 · Cited by 63
Huang, Y., Wu, L., Zhao, Y., Guo, J., Li, R., Ma, S., & Ying, Z. (2024) · Cell Reports · doi:10.1016/j.celrep.2024.113753 · Cited by 58
Oliveira, J., Yanick, C., Wein, N., & Limia, C. E. G. (2023) · Frontiers in Cellular Neuroscience · doi:10.3389/fncel.2023.1248922 · Cited by 59
Neuregulin/ErbB Signaling in Developmental Myelin Formation and Nerve Repair
Birchmeier, C., & Bennett, D. (2016) · Current topics in developmental biology/Current Topics in Developmental Biology · doi:10.1016/bs.ctdb.2015.11.009 · Cited by 58
Gao, D., Tang, T., Zhu, J., Tang, Y., Sun, H., & Li, S. (2018) · International Journal of Biological Macromolecules · doi:10.1016/j.ijbiomac.2018.10.212 · Cited by 57
Signals Orchestrating Peripheral Nerve Repair
Rigoni, M., & Negro, S. (2020) · Cells · doi:10.3390/cells9081768 · Cited by 57
Yin, Y., Qu, H., Yang, Q., Fang, Z., & Gao, R. (2021) · Phytomedicine · doi:10.1016/j.phymed.2021.153749 · Cited by 56
The Drama of Wallerian Degeneration: The Cast, Crew, and Script
Zhang, K., Jiang, M., & Fang, Y. (2021) · Annual Review of Genetics · doi:10.1146/annurev-genet-071819-103917 · Cited by 59
Ou, M., Tan, P., Xie, Y., Liu, K., Gao, Y., Yang, X., Zhou, S., & Li, Q. (2022) · Theranostics · doi:10.7150/thno.72317 · Cited by 57
Glia-specific autophagy dysfunction in ALS
Strohm, L., & Behrends, C. (2019) · Seminars in Cell and Developmental Biology · doi:10.1016/j.semcdb.2019.05.024 · Cited by 57
Toxic Peripheral Neuropathies: Agents and Mechanisms
Valentine, W. M. (2019) · Toxicologic Pathology · doi:10.1177/0192623319854326 · Cited by 57
Staining Methods for Normal and Regenerative Myelin in the Nervous System
García‐García, Ó. D., Weiss, T., Chato‐Astrain, J., Raimondo, S., & Carriel, V. (2022) · Methods in molecular biology · doi:10.1007/978-1-0716-2675-7_15 · Cited by 53
The transcriptional profile of keloidal Schwann cells
Direder, M., Wielscher, M., Weiss, T., Laggner, M., Copic, D., Klas, K., Bormann, D., Vorstandlechner, V., Tschachler, E., Ankersmit, H. J., et al. (2022) · Experimental & Molecular Medicine · doi:10.1038/s12276-022-00874-1 · Cited by 52
Neuronal autophagy and axon degeneration
Wang, Y., Song, M., & Song, F. (2018) · Cellular and Molecular Life Sciences · doi:10.1007/s00018-018-2812-1 · Cited by 55
Zhu, Y., Li, S., Liu, J., Wen, Q., Yu, J., Yu, L., & Xie, K. (2019) · Inflammation · doi:10.1007/s10753-019-01082-2 · Cited by 52
Metadata
- Authors
- Gomez-Sanchez, J. A., Carty, L., Iruarrizaga-Lejarreta, M., Palomo-Irigoyen, M., Varela-Rey, M., Griffith, M., Hantke, J., Macias-Camara, N., Azkargorta, M., Aurrekoetxea, I., De Juan, V. G., Jefferies, H. B. J., Aspichueta, P., Elortza, F., Aransay, A. M., Martínez-Chantar, M. L., Baas, F., Mato, J. M., Mirsky, R., Woodhoo, A., & Jessen, K. R.
- Affiliations
- University College London (GB)
- CIC bioGUNE, Centro de Investigación Biomédica en Red de Enfermedades Hepáticas y Digestivas (CIBERehd), 48160 Derio, Bizkaia, Spain 2
- CIC bioGUNE (ES)
- Instituto de Salud Carlos III (ES)
- University of the Basque Country (ES)
- The Francis Crick Institute (GB)
- Amsterdam UMC Location University of Amsterdam (NL)
- Ikerbasque (ES)
- Corresponding author
- Woodhoo, Ashwin
- ORCID
- Venue
- Journal of Cell Biology
- Publisher
- Rockefeller University Press
- Published
- 2015-07-06
- Volume
- 210
- Issue
- 1
- Pages
- 153-168
- ISSN
- 0021-9525 (ISSN-L)
- 1540-8140
- PMC
- PMC4494002
- OpenAlex
- W1655540037
- Cited by
- 453
- References
- 49
- Citations by year
- 2026: 33 · 2025: 47 · 2024: 40 · 2023: 45 · 2022: 52 · 2021: 55 · 2020: 43 · 2019: 38 · 2018: 36 · 2017: 32 · 2016: 22 · 2015: 8
- FWCI
- 25.61
- Type
- journal article
- Language
- en
- Open access
- hybrid
- doi.org
- Licence
- cc-by-nc-sa
- Locations
- The Journal of Cell Biology (publishedVersion, cc-by-nc-sa)
- Europe PMC (PubMed Central) (publishedVersion, cc-by-nc-sa)
- PubMed Central (publishedVersion, cc-by-nc-sa)
- PubMed (publishedVersion)
- Pure Amsterdam UMC (submittedVersion, other-oa)
- Data Archiving and Networked Services (DANS) (submittedVersion)
- UCL Discovery (University College London) (submittedVersion)
- Figshare (submittedVersion, cc-by-nc-sa)
- Funders
- Wellcome Trust (FP7/2007–2013)
- Francis Crick Institute (10187)
- Cancer Research UK (15153)
- Instituto de Salud Carlos III
- National Center for Complementary and Integrative Health (R01AT001576)
- Topics
- Life Sciences › Biochemistry, Genetics and Molecular Biology › Cell Biology › Autophagy in Disease and Therapy
- Life Sciences › Neuroscience › Cellular and Molecular Neuroscience › Nerve injury and regeneration
- Life Sciences › Neuroscience › Cellular and Molecular Neuroscience › Hereditary Neurological Disorders
- Keywords
- Schwann cells, selective autophagy, myelin debris clearance, nerve injury, Wallerian degeneration, JNK/c-Jun signaling, demyelinating disease, autophagosomes, myelin debris, central nervous system
- MeSH terms
- Animals, Autophagy, Cells, Cultured, Mice, Transgenic, Myelin Sheath, Sciatic Nerve, Wallerian Degeneration, Proto-Oncogene Proteins c-jun, JNK Mitogen-Activated Protein Kinases, Lipid Metabolism, TOR Serine-Threonine Kinases, Peripheral Nerve Injuries
About these checks
Registry, retraction, Cites and statistics results are computed, not judged, with one exception: a printed reference that no index lists is read once by a model before it counts as a citation error. Claims are extracted by a model and kept only when their quote appears verbatim in the text; each cited source is then checked, with a model’s help, for whether it says what the claim relies on. Those verdicts can be wrong — read the claim’s quote and the cited source before relying on one.
Statistics and arithmetic are recomputed, not judged.
Confidence bands are shown only for fields calibrated on our annotated test set. None is calibrated yet, so no band is shown.
What counts as a claim ›How we measure confidence ›How we check this ›
Are you an author, or do you see a problem with this page? Request a review
