Cited by 693Bone Metabolism and DiseasesRheumatoid Arthritis Research and TherapiesOsteomyelitis and Bone Disorders Research

The DOI matches its Crossref record; 53 of the 54 references it cites were found in a registry or an index.

Commitment and differentiation of osteoclast precursor cells by the sequential expression of c-Fms and receptor activator of nuclear factor κB (RANK) receptors.

Open access
Arai, Fumio, Miyamoto, Takeshi, Ohneda, Osamu, Inada, Tomohisa, Sudo, Tetsuo, Brasel, Kenneth, Miyata, Takashi, Anderson, Dirk M., Suda, Toshio·1999·The Journal of Experimental Medicine

Abstract

Osteoclasts are terminally differentiated cells derived from hematopoietic stem cells. However, how their precursor cells diverge from macrophagic lineages is not known. We have identified early and late stages of osteoclastogenesis, in which precursor cells sequentially express c-Fms followed by receptor activator of nuclear factor κB (RANK), and have demonstrated that RANK expression in early-stage of precursor cells (c-Fms+RANK−) was stimulated by macrophage colony-stimulating factor (M-CSF). Although M-CSF and RANKL (ligand) induced commitment of late-stage precursor cells (c-Fms+RANK+) into osteoclasts, even late-stage precursors have the potential to differentiate into macrophages without RANKL. Pretreatment of precursors with M-CSF and delayed addition of RANKL showed that timing of RANK expression and subsequent binding of RANKL are critical for osteoclastogenesis. Thus, the RANK–RANKL system determines the osteoclast differentiation of bipotential precursors in the default pathway of macrophagic differentiation.

Overview

The claims and statistics of this paper haven’t been checked yet.

Run the check — free, no account needed. It reads the open-access text and checks the sources it cites.

A few free checks a day · papers already verified open instantly · results are public

Integrity signals

Registry

Crossref · 10.1084/jem.190.12.1741

Cites

53 of 53 references verified0 citation errors · 0 not checkable

Statistics

Figures

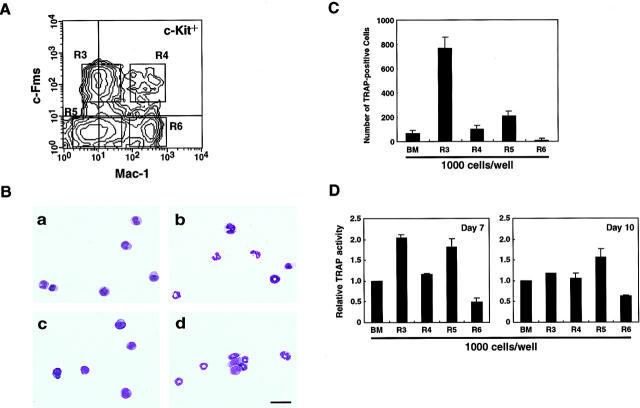
Figure 1 Differentiation of TRAP+ cells from fractionated mouse BM mononuclear cells. (A) Expression of c-Fms and Mac-1 (CD11b) on BM mononuclear cells was analyzed by FACS® gated with c-Kit+ cells. c-Kit+ cells were subdivided further into four fractions based on expression of c-Fms and Mac-1. R3, c-Kit+Mac-1dullc-Fms+; R4, c-Kit+Mac-1highc-Fms+; R5, c-Kit+ Mac-1dullc-Fms−; and R6, c-Kit+Mac-1highc-Fms−. (B) Fractionated cells were examined by May-Grünwald-Giemsa staining. (a) R3; (b) R4; (c) R5; and (d) R6. Scale bar, 50 μm. (C) 103 cells of each fraction were cocultured with ST2 stromal cells in the presence of 1,25-(OH)2D3 (10−8 M) and Dex (10−7 M), and the number of TRAP+ cells was determined on day 4. (D) Relative TRAP activities were measured on days 7 and 10 of coculture with ST2 stromal cells. TRAP activity from unfractionated BM cells was set at 1.0.
Figure 1 Differentiation of TRAP+ cells from fractionated mouse BM mononuclear cells. (A) Expression of c-Fms and Mac-1 (CD11b) on BM mononuclear cells was analyzed by FACS® gated with c-Kit+ cells. c-Kit+ cells were subdivided further into four fractions based on expression of c-Fms and Mac-1. R3, c-Kit+Mac-1dullc-Fms+; R4, c-Kit+Mac-1highc-Fms+; R5, c-Kit+ Mac-1dullc-Fms−; and R6, c-Kit+Mac-1highc-Fms−. (B) Fractionated cells were examined by May-Grünwald-Giemsa staining. (a) R3; (b) R4; (c) R5; and (d) R6. Scale bar, 50 μm. (C) 103 cells of each fraction were cocultured with ST2 stromal cells in the presence of 1,25-(OH)2D3 (10−8 M) and Dex (10−7 M), and the number of TRAP+ cells was determined on day 4. (D) Relative TRAP activities were measured on days 7 and 10 of coculture with ST2 stromal cells. TRAP activity from unfractionated BM cells was set at 1.0.CC BY-NC-SA · PubMed Central
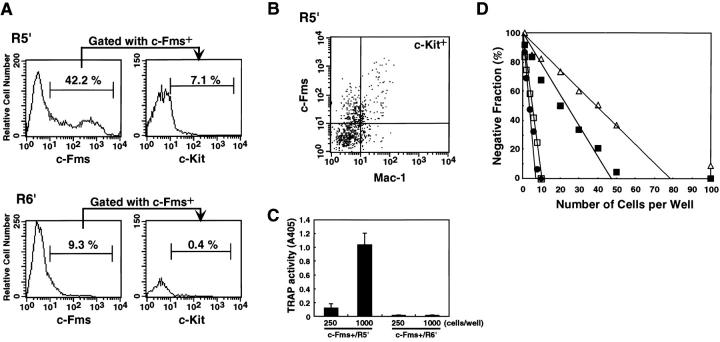
Figure 2 Differentiation of c-Kit+Mac-1dullc-Fms− cells. Cells derived from R5 and R6 fractions were cultured for 2 d with SCF (100 ng/ml; cultured cells were designated R5′ and R6′, respectively). (A) Expression of c-Fms on R5′ and R6′ cells. A gate was set on c-Fms+ cells, and the expression of c-Kit was analyzed. A fluorescence histogram shows the c-Kit staining profile of the fraction gated with c-Fms+. (B) Expression of Mac-1 and c-Fms on c-Kit+ cells. (C) c-Fms+ cells were sorted from R5′ or R6′. 103 or 2.5 × 10² cells of each fraction were cocultured with ST2 stromal cells and 1,25-(OH)2D3 (10−8 M) for 4 d, and TRAP activity was measured. (D) Limiting dilution analysis of unfractionated BM mononuclear cells (▵), R3 (•), R5 (▪), and c-Kit+c-Fms+ R5′ cells (□). Cells were cocultured with ST2 stromal cells for 4 d, and the percentages of TRAP+ cells were determined.
Figure 2 Differentiation of c-Kit+Mac-1dullc-Fms− cells. Cells derived from R5 and R6 fractions were cultured for 2 d with SCF (100 ng/ml; cultured cells were designated R5′ and R6′, respectively). (A) Expression of c-Fms on R5′ and R6′ cells. A gate was set on c-Fms+ cells, and the expression of c-Kit was analyzed. A fluorescence histogram shows the c-Kit staining profile of the fraction gated with c-Fms+. (B) Expression of Mac-1 and c-Fms on c-Kit+ cells. (C) c-Fms+ cells were sorted from R5′ or R6′. 103 or 2.5 × 10² cells of each fraction were cocultured with ST2 stromal cells and 1,25-(OH)2D3 (10−8 M) for 4 d, and TRAP activity was measured. (D) Limiting dilution analysis of unfractionated BM mononuclear cells (▵), R3 (•), R5 (▪), and c-Kit+c-Fms+ R5′ cells (□). Cells were cocultured with ST2 stromal cells for 4 d, and the percentages of TRAP+ cells were determined.CC BY-NC-SA · PubMed Central
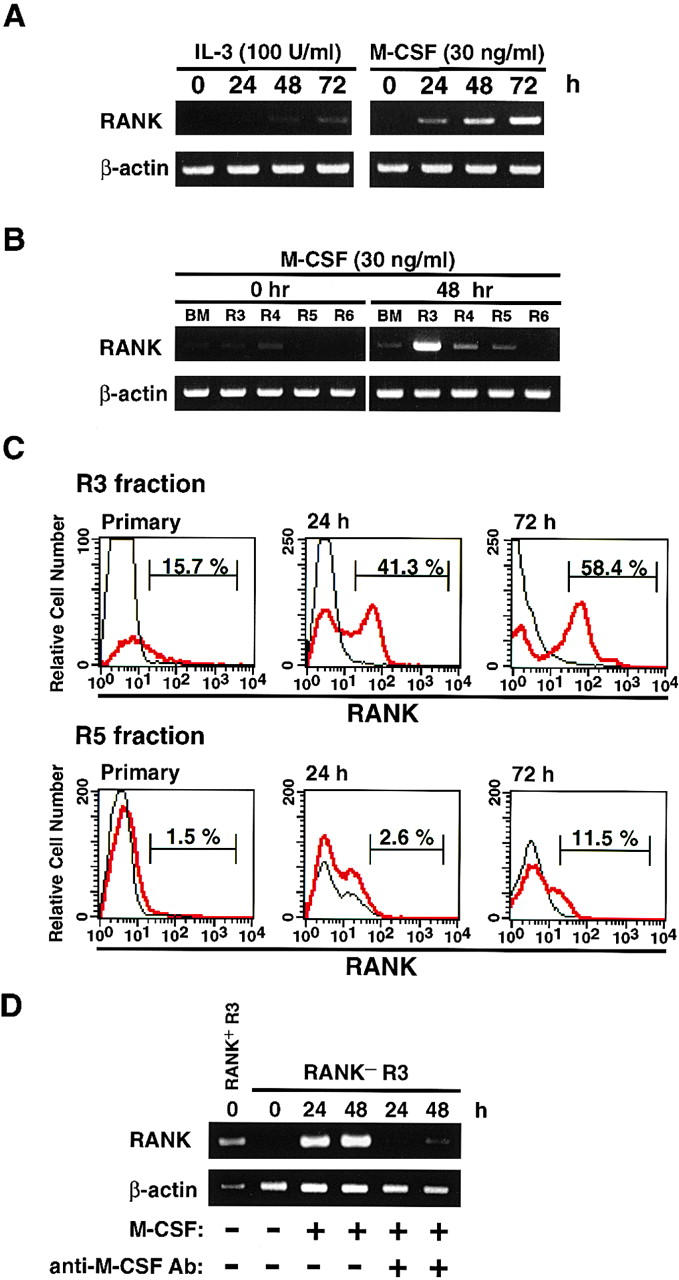
Figure 3 Expression of RANK on unfractionated BM cells or fractionated cells. Expression of RANK mRNA was analyzed by RT-PCR. (A) BM mononuclear cells were cultured with IL-3 (100 U/ml; left panel) or M-CSF (30 ng/ml; right panel), and the expression of RANK mRNA was examined before and after 24, 48, or 72 h of culture. (B) Fractionated BM cells were cultured for 48 h with M-CSF (30 ng/ml), and the expression of RANK was examined before and after 48 h of culture. (C) Expression of RANK protein on BM R3 or R5 cells was analyzed by FACS®. R3 (upper panels) or R5 (lower panels) cells were cultured for 24 or 72 h with M-CSF (30 ng/ml), and the expression of RANK was analyzed. Red line, anti-RANK; black line, rat IgG2a. (D) R3 cells (c-Kit+Mac-1dullc-Fms+) were divided into RANK+ or RANK− cells, and RANK− R3 cells were cultured for 24 or 48 h in the presence of M-CSF (30 ng/ml) with or without anti–mouse M-CSF neutralizing antibody (10 μg/ml). The expression of RANK was analyzed by RT-PCR.
Figure 3 Expression of RANK on unfractionated BM cells or fractionated cells. Expression of RANK mRNA was analyzed by RT-PCR. (A) BM mononuclear cells were cultured with IL-3 (100 U/ml; left panel) or M-CSF (30 ng/ml; right panel), and the expression of RANK mRNA was examined before and after 24, 48, or 72 h of culture. (B) Fractionated BM cells were cultured for 48 h with M-CSF (30 ng/ml), and the expression of RANK was examined before and after 48 h of culture. (C) Expression of RANK protein on BM R3 or R5 cells was analyzed by FACS®. R3 (upper panels) or R5 (lower panels) cells were cultured for 24 or 72 h with M-CSF (30 ng/ml), and the expression of RANK was analyzed. Red line, anti-RANK; black line, rat IgG2a. (D) R3 cells (c-Kit+Mac-1dullc-Fms+) were divided into RANK+ or RANK− cells, and RANK− R3 cells were cultured for 24 or 48 h in the presence of M-CSF (30 ng/ml) with or without anti–mouse M-CSF neutralizing antibody (10 μg/ml). The expression of RANK was analyzed by RT-PCR.CC BY-NC-SA · PubMed Central
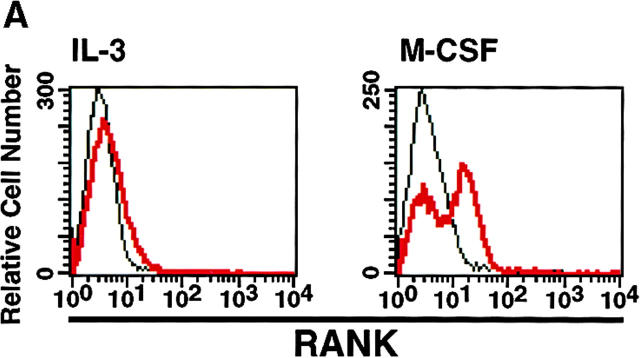
Figure 4 Both RANKL and M-CSF regulate the differentiation of osteoclasts. (A) R3 cells were cultured with IL-3 (100 U/ml) or M-CSF (30 ng/ml) for 72 h. A fluorescence histogram shows the RANK staining profile after 72-h cultivation with IL-3 (left panel) or M-CSF (right panel). (B) RANK+ (black column) and RANK− (white column) cells were sorted from IL-3– or M-CSF–precultured R3 cells and were then cultured with sRANKL (25 ng/ml) and IL-3 (100 U/ml) or M-CSF (100 ng/ml). The percentage of TRAP+ cells was determined on day 4. (C) Percentages of TRAP+ cells differentiated from primary RANK+ (•), primary RANK− (○), and M-CSF 24-h–precultured RANK+ (▪) or RANK− (□) cells in the R3 fraction were determined after cultivation with sRANKL for 2, 4, or 6 d.
Figure 4 Both RANKL and M-CSF regulate the differentiation of osteoclasts. (A) R3 cells were cultured with IL-3 (100 U/ml) or M-CSF (30 ng/ml) for 72 h. A fluorescence histogram shows the RANK staining profile after 72-h cultivation with IL-3 (left panel) or M-CSF (right panel). (B) RANK+ (black column) and RANK− (white column) cells were sorted from IL-3– or M-CSF–precultured R3 cells and were then cultured with sRANKL (25 ng/ml) and IL-3 (100 U/ml) or M-CSF (100 ng/ml). The percentage of TRAP+ cells was determined on day 4. (C) Percentages of TRAP+ cells differentiated from primary RANK+ (•), primary RANK− (○), and M-CSF 24-h–precultured RANK+ (▪) or RANK− (□) cells in the R3 fraction were determined after cultivation with sRANKL for 2, 4, or 6 d.CC BY-NC-SA · PubMed Central
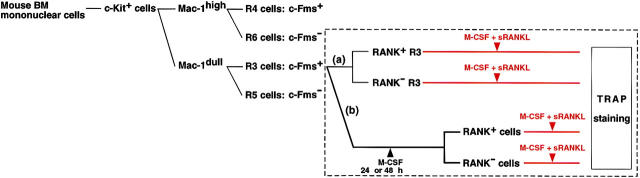
Figure 5 Flow chart of FACS® analysis and the points for further examination. Mouse BM c-Kit+ cells were divided into four fractions (R3, R4, R5, and R6) as described in the Fig. 1 legend. The box enclosed with dashed lines indicates further analysis performed in Fig. 6. (a) R3 cells (c-Kit+Mac-1dullc-Fms+) were subdivided into RANK+ or RANK− cells, and each fraction was cultured in the presence of M-CSF and sRANKL. (b) R3 cells were cultured for 24 or 72 h with M-CSF and were subdivided into RANK+ or RANK− cells. 24- or 72-h–precultured RANK+ and RANK− cells were cultured with both M-CSF and sRANKL. Red line, cultivation with M-CSF and sRANKL; dark blue line, cultivation with M-CSF.
Figure 5 Flow chart of FACS® analysis and the points for further examination. Mouse BM c-Kit+ cells were divided into four fractions (R3, R4, R5, and R6) as described in the Fig. 1 legend. The box enclosed with dashed lines indicates further analysis performed in Fig. 6. (a) R3 cells (c-Kit+Mac-1dullc-Fms+) were subdivided into RANK+ or RANK− cells, and each fraction was cultured in the presence of M-CSF and sRANKL. (b) R3 cells were cultured for 24 or 72 h with M-CSF and were subdivided into RANK+ or RANK− cells. 24- or 72-h–precultured RANK+ and RANK− cells were cultured with both M-CSF and sRANKL. Red line, cultivation with M-CSF and sRANKL; dark blue line, cultivation with M-CSF.CC BY-NC-SA · PubMed Central
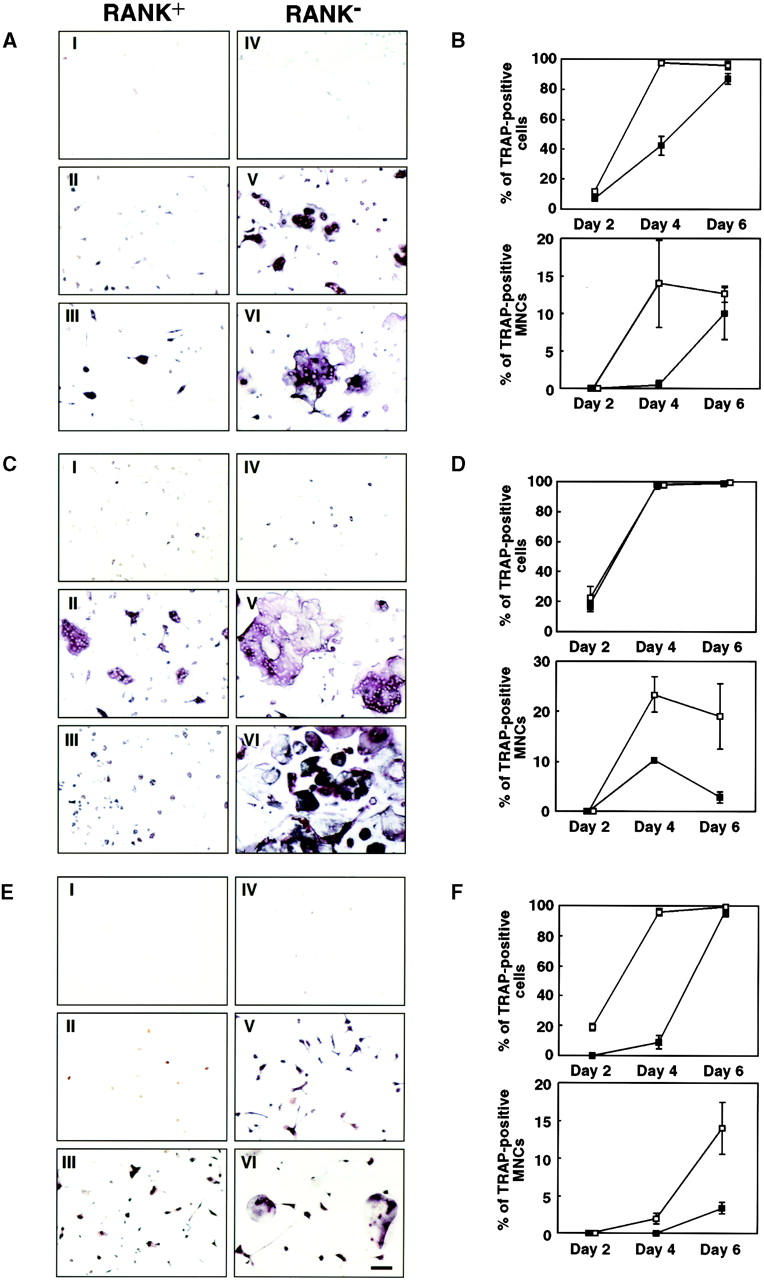
Figure 6 Differentiation of TRAP+ cells from RANK+ or RANK− cells. R3 cells were precultured with M-CSF (30 ng/ml) for 24 or 72 h. These precultured cells and primary R3 cells were then divided into RANK+ or RANK− fractions. Primary and cultured RANK+ or RANK− cells were cultured with sRANKL (25 ng/ml) and M-CSF (100 ng/ml). (A and B) Primary R3 cells. (C and D) 24-h M-CSF–precultured cells. (E and F) M-CSF 72-h–precultured cells. TRAP staining (A, C, and E) was performed on day 2 (I and IV), day 4 (II and V), or day 6 (III and VI), and the percentage of TRAP+ cells or TRAP+ MNCs (B, D, and F) was scored at the same time. I, II, and III were derived from RANK+ cells; IV, V, and VI were from RANK− cells. Scale bar, 100 μm. Upper panels of B, D, and F represent percentages of TRAP+ cells that include both mononuclear cells and MNCs in the total cells in the well. Lower panels of B, D, and F represent percentages of TRAP+ MNCs in total TRAP+ cells in the well. Percent of TRAP+ cells or TRAP+ MNCs derived from RANK+ (▪) or RANK− (□) cells is shown.
Figure 6 Differentiation of TRAP+ cells from RANK+ or RANK− cells. R3 cells were precultured with M-CSF (30 ng/ml) for 24 or 72 h. These precultured cells and primary R3 cells were then divided into RANK+ or RANK− fractions. Primary and cultured RANK+ or RANK− cells were cultured with sRANKL (25 ng/ml) and M-CSF (100 ng/ml). (A and B) Primary R3 cells. (C and D) 24-h M-CSF–precultured cells. (E and F) M-CSF 72-h–precultured cells. TRAP staining (A, C, and E) was performed on day 2 (I and IV), day 4 (II and V), or day 6 (III and VI), and the percentage of TRAP+ cells or TRAP+ MNCs (B, D, and F) was scored at the same time. I, II, and III were derived from RANK+ cells; IV, V, and VI were from RANK− cells. Scale bar, 100 μm. Upper panels of B, D, and F represent percentages of TRAP+ cells that include both mononuclear cells and MNCs in the total cells in the well. Lower panels of B, D, and F represent percentages of TRAP+ MNCs in total TRAP+ cells in the well. Percent of TRAP+ cells or TRAP+ MNCs derived from RANK+ (▪) or RANK− (□) cells is shown.CC BY-NC-SA · PubMed Central
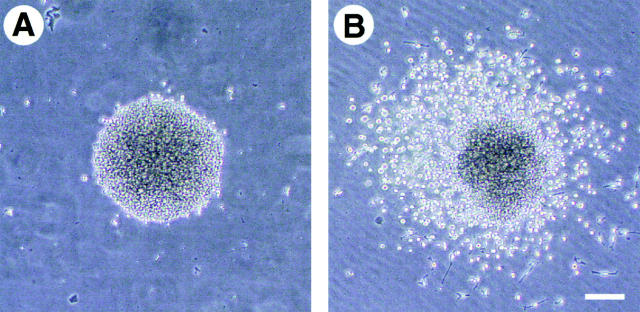
Figure 7 Colony formation from BM cells in the presence of sRANKL and M-CSF. R3 cells were cultured in methylcellulose medium with M-CSF (100 ng/ml) and sRANKL (25 ng/ml) for 7 d. Shown are pure macrophage colonies in the presence of M-CSF (A), colonies formed in the presence of sRANKL and M-CSF (B), and individual cells in osteoclast-containing colonies stained for May-Grünwald-Giemsa (C), with nonspecific esterase (D), and for TRAP (E). Scale bars, 10 μm (A and B) and 25 μm (C, D and E).
Figure 7 Colony formation from BM cells in the presence of sRANKL and M-CSF. R3 cells were cultured in methylcellulose medium with M-CSF (100 ng/ml) and sRANKL (25 ng/ml) for 7 d. Shown are pure macrophage colonies in the presence of M-CSF (A), colonies formed in the presence of sRANKL and M-CSF (B), and individual cells in osteoclast-containing colonies stained for May-Grünwald-Giemsa (C), with nonspecific esterase (D), and for TRAP (E). Scale bars, 10 μm (A and B) and 25 μm (C, D and E).CC BY-NC-SA · PubMed Central
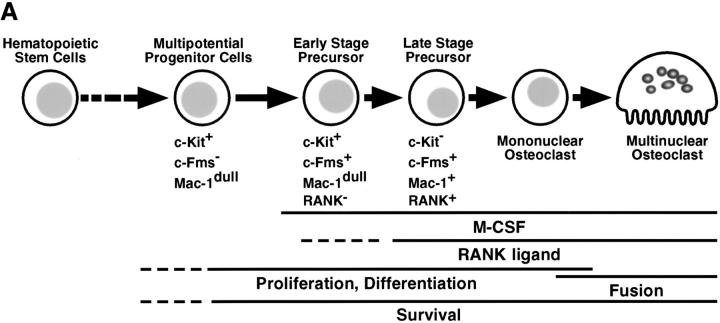
Figure 8 Model of osteoclast differentiation derived from hematopoietic stem cells. (A) Sequential phenotypic progression of osteoclasts and relevant factors. (B) Determination of osteoclastic differentiation in the presence of M-CSF and RANKL.
Figure 8 Model of osteoclast differentiation derived from hematopoietic stem cells. (A) Sequential phenotypic progression of osteoclasts and relevant factors. (B) Determination of osteoclastic differentiation in the presence of M-CSF and RANKL.CC BY-NC-SA · PubMed Central

Verification

Claims the paper makes

The claims and statistics of this paper haven’t been checked yet.

Run the check — free, no account needed. It reads the open-access text and checks the sources it cites.

A few free checks a day · papers already verified open instantly · results are public

Claims other papers make about this one

Each is checked against this paper’s own text: does it say what the citing paper says it does?

Self-check

Percentages, sums and reported differences re-computed from the paper’s own numbers.

The self-check needs the paper’s full text.

Citations

Cites

Show all 54 references

Research works printed but not linked: 1

  1. Roodman, 1996, Advances in bone biologythe osteoclast, Endocr. Rev., 17, 308

Cited by

Sorted by citations

See all 693

Metadata

Authors
Arai, F., Miyamoto, T., Ohneda, O., Inada, T., Sudo, T., Brasel, K., Miyata, T., Anderson, D. M., & Suda, T.
Affiliations
  • Meikai University (JP)
  • Institute of Molecular Embryology and Genetics, Kumamoto University (JP)
  • Toray Industries, Inc. (Japan) (JP)
  • dDepartment of Molecular Biology, Immunex Corporation, Seattle, Washington 98101-2936
Venue
The Journal of Experimental Medicine
Published
1999-12-20
Volume
190
Issue
12
Pages
1741-1754
ISSN
  • 0022-1007 (ISSN-L)
  • 1540-9538
OpenAlex
W2132408993
Cited by
693
References
54
Citations by year
2026: 6 · 2025: 16 · 2024: 20 · 2023: 33 · 2022: 33 · 2021: 32 · 2020: 42 · 2019: 38 · 2018: 31 · 2017: 31 · 2016: 30 · 2015: 40 · 2014: 34 · 2013: 31 · 2012: 38
FWCI
4.13
Type
journal article
Language
en
Open access
Licence
cc-by-nc-sa
Locations
  • The Journal of Experimental Medicine (publishedVersion)
  • PubMed Central (publishedVersion, cc-by-nc-sa)
  • PubMed (publishedVersion)
Topics
  • Life Sciences › Biochemistry, Genetics and Molecular Biology › Molecular Biology › Bone Metabolism and Diseases
  • Health Sciences › Medicine › Rheumatology › Rheumatoid Arthritis Research and Therapies
  • Health Sciences › Medicine › Rheumatology › Osteomyelitis and Bone Disorders Research
Keywords
osteoclastogenesis, osteoclast precursor cells, c-fms, RANK, RANKL, macrophage colony-stimulating factor, macrophage differentiation, lineage commitment, hematopoietic stem cells
MeSH terms
Animals, Carrier Proteins, Cell Differentiation, Hematopoietic Stem Cells, Ligands, Macrophages, Membrane Glycoproteins, Mice, Inbred C57BL, Osteoclasts, Macrophage Colony-Stimulating Factor, Receptor, Macrophage Colony-Stimulating Factor, Receptors, Tumor Necrosis Factor, Cell Lineage, Mice, RANK Ligand, Receptor Activator of Nuclear Factor-kappa B

About these checks

Registry, retraction, Cites and statistics results are computed, not judged, with one exception: a printed reference that no index lists is read once by a model before it counts as a citation error. Claims are extracted by a model and kept only when their quote appears verbatim in the text; each cited source is then checked, with a model’s help, for whether it says what the claim relies on. Those verdicts can be wrong — read the claim’s quote and the cited source before relying on one.

Statistics and arithmetic are recomputed, not judged.

Confidence bands are shown only for fields calibrated on our annotated test set. None is calibrated yet, so no band is shown.

What counts as a claim ›How we measure confidence ›How we check this ›

Are you an author, or do you see a problem with this page? Request a review