Cited by 459Redox biology and oxidative stressNeutrophil, Myeloperoxidase and Oxidative MechanismsT-cell and B-cell Immunology

The DOI matches its Crossref record; 59 of the 59 references it cites were found in a registry or an index.

Discrete Generation of Superoxide and Hydrogen Peroxide by T Cell Receptor Stimulation

Open access
Devadas, Satish, Zaritskaya, Luba, Rhee, Sue Goo, Oberley, Larry, Williams, Mark S.·2002·The Journal of Experimental Medicine

Abstract

Receptor-stimulated generation of reactive oxygen species (ROS) has been shown to regulate signal transduction, and previous studies have suggested that T cell receptor (TCR) signals may involve or be sensitive to ROS. In this study, we have shown for the first time that TCR cross-linking induced rapid (within 15 min) generation of both hydrogen peroxide and superoxide anion, as defined with oxidation-sensitive dyes, selective pharmacologic antioxidants, and overexpression of specific antioxidant enzymes. Furthermore, the data suggest the novel observation that superoxide anion and hydrogen peroxide are produced separately by distinct TCR-stimulated pathways. Unexpectedly, TCR-stimulated activation of the Fas ligand (FasL) promoter and subsequent cell death was dependent upon superoxide anion, but independent of hydrogen peroxide, while nuclear factor of activated T cells (NFAT) activation or interleukin 2 transcription was independent of all ROS. Anti-CD3 induced phosphorylation of extracellular signal–regulated kinase (ERK)1/2 required hydrogen peroxide generation but was unaffected by superoxide anion. Thus, antigen receptor signaling induces generation of discrete species of oxidants that selectively regulate two distinct redox sensitive pathways, a proapoptotic (FasL) and a proliferative pathway (ERK).

Overview

The claims and statistics of this paper haven’t been checked yet.

Run the check — free, no account needed. It reads the open-access text and checks the sources it cites.

A few free checks a day · papers already verified open instantly · results are public

Integrity signals

Registry

Crossref · 10.1084/jem.20010659

Cites

59 of 59 references verified0 citation errors · 0 not checkable

Statistics

Figures

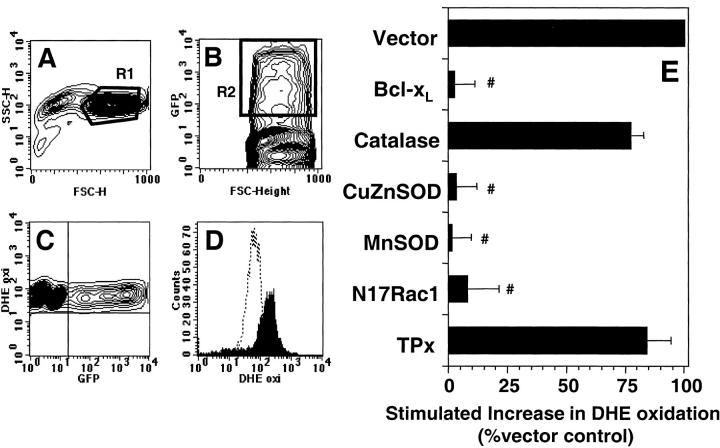
Figure 3. Effect of protein overexpression on anti-CD3–stimulated DHE oxidation in 9C127 cells. 9C127 cells were transfected with the indicated vectors at a 2:1 ratio with one encoding GFP as a transfection marker. After 16 h incubation, anti-CD3–induced DHE oxidation was measured as described in Materials and Methods. (A) “Normal sized” cells as defined by R1 in the FSC/SSC plot were analyzed. (B) Representative GFP staining profile. GFP expressing, productively transfected cells were defined by R2. (C) Relationship of GFP fluorescence to basal DHE staining indicating that expression of GFP did not affect dye uptake. (D) Representative DHE profile of “normal sized,” GFP+ cells with unstimulated cells (dashed lines) and anti-CD3–stimulated cells (filled profile). (E) Effect of protein overexpression on anti-CD3–induced DHE oxidation in 9C127 cells. DHE oxidation was determined after 60 min anti-CD3 stimulation in “normal sized,” GFP+ cells and was normalized to Vector control. The data represent the average of at least four separate experiments (± SEM). #Significantly different from that measured in Vector transfected samples (P < 0.05).
Figure 3. Effect of protein overexpression on anti-CD3–stimulated DHE oxidation in 9C127 cells. 9C127 cells were transfected with the indicated vectors at a 2:1 ratio with one encoding GFP as a transfection marker. After 16 h incubation, anti-CD3–induced DHE oxidation was measured as described in Materials and Methods. (A) “Normal sized” cells as defined by R1 in the FSC/SSC plot were analyzed. (B) Representative GFP staining profile. GFP expressing, productively transfected cells were defined by R2. (C) Relationship of GFP fluorescence to basal DHE staining indicating that expression of GFP did not affect dye uptake. (D) Representative DHE profile of “normal sized,” GFP+ cells with unstimulated cells (dashed lines) and anti-CD3–stimulated cells (filled profile). (E) Effect of protein overexpression on anti-CD3–induced DHE oxidation in 9C127 cells. DHE oxidation was determined after 60 min anti-CD3 stimulation in “normal sized,” GFP+ cells and was normalized to Vector control. The data represent the average of at least four separate experiments (± SEM). #Significantly different from that measured in Vector transfected samples (P < 0.05).CC BY-NC-SA · PubMed Central
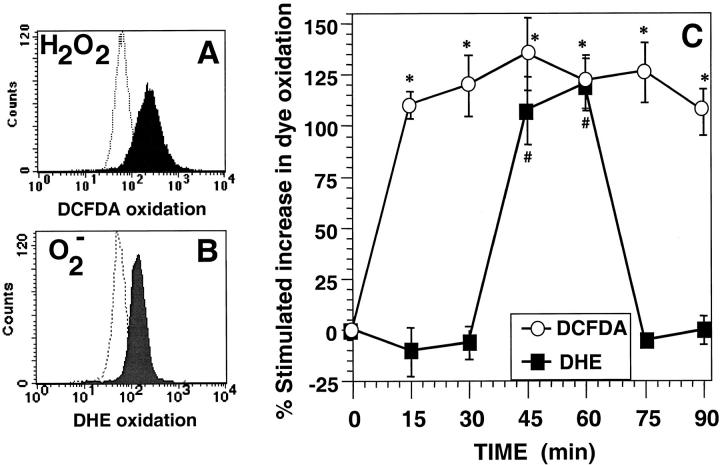
Figure 1. Anti-CD3–stimulated generation of ROS in 9C127 murine T cell hybridoma. (A) Representative FACS® profile for anti-CD3–induced DCFDA oxidation at 15 min with unstimulated cells (dashed lines) and anti-CD3–stimulated cells (filled profile). (B) Representative FACS® profile for anti-CD3 stimulated DHE oxidation at 60 min with unstimulated cells (dashed lines) and anti-CD3–stimulated cells (filled profile). (C) Kinetics of DCFDA/DHE oxidation in 9C127 cells. 9C127 cells were stimulated with anti-CD3 as described in Materials and Methods and the oxidation of DCFDA (○) and DHE (▪) was determined by FACS® analysis. The data are expressed as the percent stimulated increase in mean channel fluorescence of DCFDA/DHE over unstimulated controls and represent the average of at least five separate experiments (± SEM). *Anti-CD3–stimulated DCFDA oxidation is significantly different from unstimulated controls (P < 0.05). #Anti-CD3–stimulated DHE oxidation is significantly different from unstimulated controls (P < 0.05).
Figure 1. Anti-CD3–stimulated generation of ROS in 9C127 murine T cell hybridoma. (A) Representative FACS® profile for anti-CD3–induced DCFDA oxidation at 15 min with unstimulated cells (dashed lines) and anti-CD3–stimulated cells (filled profile). (B) Representative FACS® profile for anti-CD3 stimulated DHE oxidation at 60 min with unstimulated cells (dashed lines) and anti-CD3–stimulated cells (filled profile). (C) Kinetics of DCFDA/DHE oxidation in 9C127 cells. 9C127 cells were stimulated with anti-CD3 as described in Materials and Methods and the oxidation of DCFDA (○) and DHE (▪) was determined by FACS® analysis. The data are expressed as the percent stimulated increase in mean channel fluorescence of DCFDA/DHE over unstimulated controls and represent the average of at least five separate experiments (± SEM). *Anti-CD3–stimulated DCFDA oxidation is significantly different from unstimulated controls (P < 0.05). #Anti-CD3–stimulated DHE oxidation is significantly different from unstimulated controls (P < 0.05).CC BY-NC-SA · PubMed Central
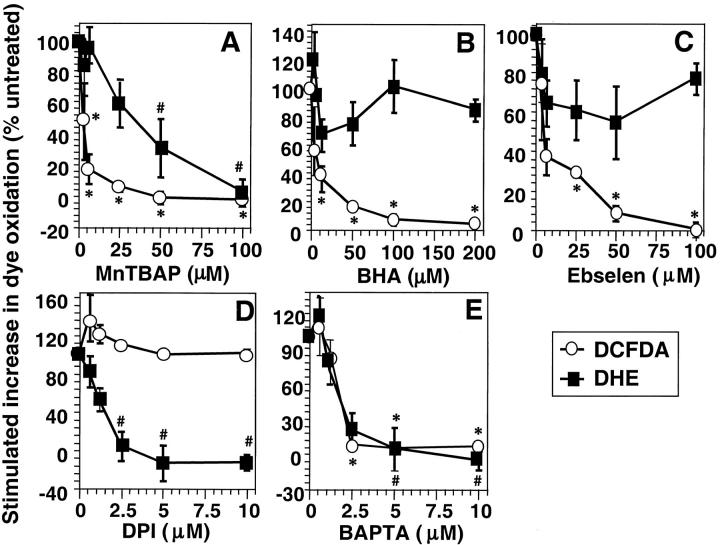
Figure 2. Effect of ROS scavengers and chemical inhibitors of ROS. Anti-CD3–induced ROS generation was determined as described in Materials and Methods. DCFDA oxidation (○) was determined after 15 min and DHE oxidation (▪) after 60 min stimulation with anti-CD3 in the presence or absence of titrated concentrations of (A) MnTBaP, (B) ebselen, (C) BHA, (D) diphenylene iodonium (DPI), or (E) BAPTA-AM. The data are normalized to anti-CD3–induced DCFDA/DHE oxidation in the absence of drug and are expressed as percentage change in anti-CD3–stimulated fluorescence compared with cells exposed to drug alone. The data represent the average of at least three experiments (± SEM). *Anti-CD3–stimulated DCFDA oxidation is significantly different from that in the absence of drug (P < 0.05). #Anti-CD3–stimulated DHE oxidation is significantly different from that in the absence of drug (P < 0.05).
Figure 2. Effect of ROS scavengers and chemical inhibitors of ROS. Anti-CD3–induced ROS generation was determined as described in Materials and Methods. DCFDA oxidation (○) was determined after 15 min and DHE oxidation (▪) after 60 min stimulation with anti-CD3 in the presence or absence of titrated concentrations of (A) MnTBaP, (B) ebselen, (C) BHA, (D) diphenylene iodonium (DPI), or (E) BAPTA-AM. The data are normalized to anti-CD3–induced DCFDA/DHE oxidation in the absence of drug and are expressed as percentage change in anti-CD3–stimulated fluorescence compared with cells exposed to drug alone. The data represent the average of at least three experiments (± SEM). *Anti-CD3–stimulated DCFDA oxidation is significantly different from that in the absence of drug (P < 0.05). #Anti-CD3–stimulated DHE oxidation is significantly different from that in the absence of drug (P < 0.05).CC BY-NC-SA · PubMed Central
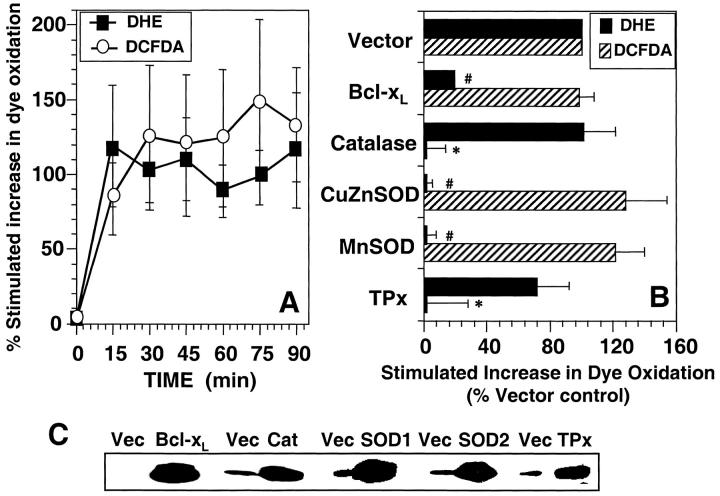
Figure 4. Anti-CD3–induced ROS generation in human T blasts. (A). Kinetics of anti-CD3–stimulated DCFDA/DHE oxidation human T blasts. Human T blasts were stimulated with anti-CD3 as described in Materials and Methods and the oxidation of DCFDA (○) and DHE (▪) was determined by FACS® analysis. The data are expressed as the percent stimulated increase in mean channel fluorescence of DCFDA/DHE over unstimulated controls and represent the average of at least five separate experiments (± SEM). (B) Effect of protein overexpression on DCFDA/DHE oxidation in human T blasts. Human T blasts were transfected with empty vector (Vector) or expression vectors encoding BCl-xL, catalase, CuZnSOD, MnSOD, or TPx at a 2:1 ratio with one encoding GFP or RFP as a transfection marker. After 16 h incubation, anti-CD3–induced DCFDA (hatched bars) or DHE (closed bars) oxidation was measured as described in Materials and Methods and the legend to Fig. 3. DHE oxidation was measured in GFP+ cells while DCFDA oxidation was measured in RFP-transfected cells, both after 15 min anti-CD3 stimulation and was normalized to Vector control. The data represent the average of at least four separate experiments (± SEM). *Significantly different from that in Vector transfected samples (P < 0.05). #Significantly different from that in Vector transfected samples (P < 0.05). (C) Western blot confirmation of protein overexpression. Human T blasts were transiently transfected with the indicated mammalian expression vectors in twofold excess over a marker plasmid expressing a chimeric CD8-Igγ2a protein. After 16 h incubation, viable CD8+ cells were purified by magnetic bead selection. Protein overexpression was determined in positively selected cells by Western blot as described in Materials and Methods.
Figure 4. Anti-CD3–induced ROS generation in human T blasts. (A). Kinetics of anti-CD3–stimulated DCFDA/DHE oxidation human T blasts. Human T blasts were stimulated with anti-CD3 as described in Materials and Methods and the oxidation of DCFDA (○) and DHE (▪) was determined by FACS® analysis. The data are expressed as the percent stimulated increase in mean channel fluorescence of DCFDA/DHE over unstimulated controls and represent the average of at least five separate experiments (± SEM). (B) Effect of protein overexpression on DCFDA/DHE oxidation in human T blasts. Human T blasts were transfected with empty vector (Vector) or expression vectors encoding BCl-xL, catalase, CuZnSOD, MnSOD, or TPx at a 2:1 ratio with one encoding GFP or RFP as a transfection marker. After 16 h incubation, anti-CD3–induced DCFDA (hatched bars) or DHE (closed bars) oxidation was measured as described in Materials and Methods and the legend to Fig. 3. DHE oxidation was measured in GFP+ cells while DCFDA oxidation was measured in RFP-transfected cells, both after 15 min anti-CD3 stimulation and was normalized to Vector control. The data represent the average of at least four separate experiments (± SEM). *Significantly different from that in Vector transfected samples (P < 0.05). #Significantly different from that in Vector transfected samples (P < 0.05). (C) Western blot confirmation of protein overexpression. Human T blasts were transiently transfected with the indicated mammalian expression vectors in twofold excess over a marker plasmid expressing a chimeric CD8-Igγ2a protein. After 16 h incubation, viable CD8+ cells were purified by magnetic bead selection. Protein overexpression was determined in positively selected cells by Western blot as described in Materials and Methods.CC BY-NC-SA · PubMed Central
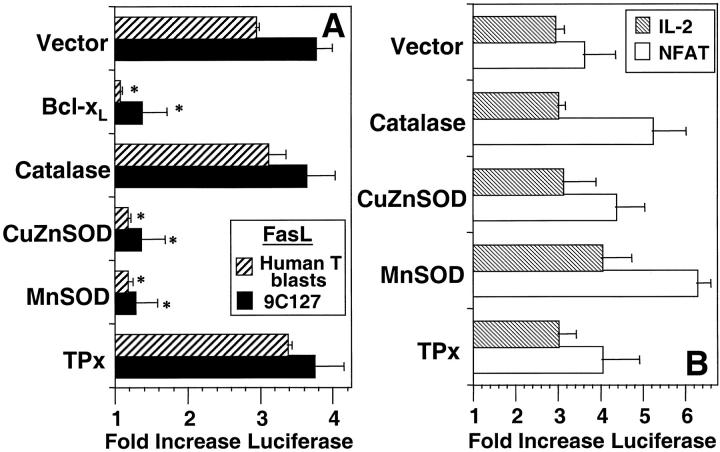
Figure 5. Effect of protein overexpression on anti-CD3–induced reporter plasmid activation. (A) 9C127 cells (solid bars) or human T blasts (hatched bars) were transfected with empty vector (Vector) or expression vectors encoding BCl-xL, catalase, CuZnSOD, MnSOD, or TPx at a 2:1 ratio with one containing a 0.5 kb portion of the FasL promoter inserted into a luciferase reporter vector. (B) 9C127 cells were transfected with the same vectors at a 2:1 ratio with luciferase reporter vectors containing the minimal IL-2 promoter (hatched bars) and a multimerized NFAT binding site (open bars). Anti-CD3–stimulated luciferase activity in cell lysates was measured by chemoluminescence as described in Materials and Methods. Data are expressed as fold induction of luciferase activity over unstimulated and represents the average of at least four experiments. *Significantly different from Vector transfected controls (P < 0.05).
Figure 5. Effect of protein overexpression on anti-CD3–induced reporter plasmid activation. (A) 9C127 cells (solid bars) or human T blasts (hatched bars) were transfected with empty vector (Vector) or expression vectors encoding BCl-xL, catalase, CuZnSOD, MnSOD, or TPx at a 2:1 ratio with one containing a 0.5 kb portion of the FasL promoter inserted into a luciferase reporter vector. (B) 9C127 cells were transfected with the same vectors at a 2:1 ratio with luciferase reporter vectors containing the minimal IL-2 promoter (hatched bars) and a multimerized NFAT binding site (open bars). Anti-CD3–stimulated luciferase activity in cell lysates was measured by chemoluminescence as described in Materials and Methods. Data are expressed as fold induction of luciferase activity over unstimulated and represents the average of at least four experiments. *Significantly different from Vector transfected controls (P < 0.05).CC BY-NC-SA · PubMed Central
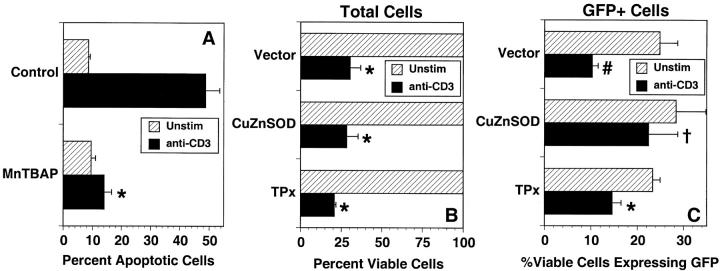
Figure 6. Functional role for superoxide in anti-CD3–stimulated cell death. (A) 9C127 cells were unstimulated (hatched bars) or incubated on immobilized anti-CD3 (solid bars) for 16 h in the presence or absence of the SOD mimetic MnTBaP. Cells were harvested and apoptosis (hypodiploid cells) was measured after staining with propidium iodide by flow cytometry as described in Materials and Methods. The data are expressed as the percent apoptotic cells and represent the average of three separate experiments ± SEM. *Significantly different from untreated controls (P < 0.002). (B and C) 9C127 cells were transfected with empty vector (Vector) or an expression vector encoding CuZnSOD or TPx at a 2:1 ratio with one encoding GFP as a transfection marker. After 16 h culture, cells were incubated for 24 h further on immobilized anti-CD3 (solid bars) or in the absence of stimulation (hatched bars). The percent total viable (PI−) cells (B) and those expressing GFP (C) were quantitated by flow cytometry. Anti-CD3–stimulated death of productively transfected (GFP+) viable cells for vector transfected cells was 58.7 ± 6.3%, while that in CuZnSOD-transfected cells was 21.1 ± 7.4% (significantly different from vector control; P < 0.05) and in TPx overexpressing cells it was 39.7 ± 4.3% (not significantly different from vector control; P > 0.2). The data represent the average of three separate experiments ± SEM. *Significantly different from unstimulated controls (P < 0.01); #Significantly different from unstimulated controls (P < 0.05); †Not significantly different from unstimulated controls (P > 0.1).
Figure 6. Functional role for superoxide in anti-CD3–stimulated cell death. (A) 9C127 cells were unstimulated (hatched bars) or incubated on immobilized anti-CD3 (solid bars) for 16 h in the presence or absence of the SOD mimetic MnTBaP. Cells were harvested and apoptosis (hypodiploid cells) was measured after staining with propidium iodide by flow cytometry as described in Materials and Methods. The data are expressed as the percent apoptotic cells and represent the average of three separate experiments ± SEM. *Significantly different from untreated controls (P < 0.002). (B and C) 9C127 cells were transfected with empty vector (Vector) or an expression vector encoding CuZnSOD or TPx at a 2:1 ratio with one encoding GFP as a transfection marker. After 16 h culture, cells were incubated for 24 h further on immobilized anti-CD3 (solid bars) or in the absence of stimulation (hatched bars). The percent total viable (PI−) cells (B) and those expressing GFP (C) were quantitated by flow cytometry. Anti-CD3–stimulated death of productively transfected (GFP+) viable cells for vector transfected cells was 58.7 ± 6.3%, while that in CuZnSOD-transfected cells was 21.1 ± 7.4% (significantly different from vector control; P < 0.05) and in TPx overexpressing cells it was 39.7 ± 4.3% (not significantly different from vector control; P > 0.2). The data represent the average of three separate experiments ± SEM. *Significantly different from unstimulated controls (P < 0.01); #Significantly different from unstimulated controls (P < 0.05); †Not significantly different from unstimulated controls (P > 0.1).CC BY-NC-SA · PubMed Central
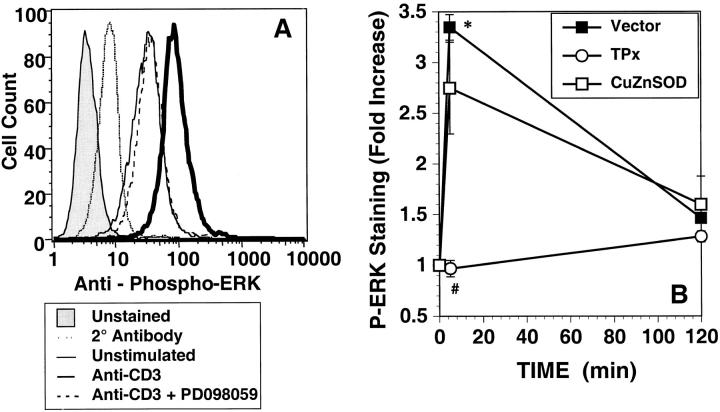
Figure 7. Anti-CD3–stimulated ERK phosphorylation. (A) Anti-CD3–induced phosphorylation of ERK was measured after 5 min stimulation in GFP+ 9C127 cells. Stimulation was performed in the presence (dashed line) or absence (heavy solid line) of the MEK1 inhibitor PD098059 by immunohistochemical staining using a phospho-specific antibody for ERK1/2 as described in Materials and Methods. Staining was quantitated by flow cytometry after stain with biotin goat anti–rabbit and streptavidin-APC. Profiles of unstimulated cells (solid line) and anti-CD3–stimulated cells stained with secondary antibody alone (dotted line) or unstained (shaded profile) are also shown. Staining with pan-anti-ERK1/2 was not altered in any sample (not shown). (B) 9C127 cells were transfected with empty vector (Vector) (▪) or expression vectors encoding CuZnSOD (□) or TPx (○) at a 2:1 ratio with one encoding GFP as a transfection marker. The data represent the anti-CD3–stimulated fold increase in mean APC fluorescence in GFP+ cells and are representative of at least three separate experiments. *Significantly different from unstimulated controls (P < 0.05). #Significantly different from Vector-transfected samples (P < 0.05).
Figure 7. Anti-CD3–stimulated ERK phosphorylation. (A) Anti-CD3–induced phosphorylation of ERK was measured after 5 min stimulation in GFP+ 9C127 cells. Stimulation was performed in the presence (dashed line) or absence (heavy solid line) of the MEK1 inhibitor PD098059 by immunohistochemical staining using a phospho-specific antibody for ERK1/2 as described in Materials and Methods. Staining was quantitated by flow cytometry after stain with biotin goat anti–rabbit and streptavidin-APC. Profiles of unstimulated cells (solid line) and anti-CD3–stimulated cells stained with secondary antibody alone (dotted line) or unstained (shaded profile) are also shown. Staining with pan-anti-ERK1/2 was not altered in any sample (not shown). (B) 9C127 cells were transfected with empty vector (Vector) (▪) or expression vectors encoding CuZnSOD (□) or TPx (○) at a 2:1 ratio with one encoding GFP as a transfection marker. The data represent the anti-CD3–stimulated fold increase in mean APC fluorescence in GFP+ cells and are representative of at least three separate experiments. *Significantly different from unstimulated controls (P < 0.05). #Significantly different from Vector-transfected samples (P < 0.05).CC BY-NC-SA · PubMed Central
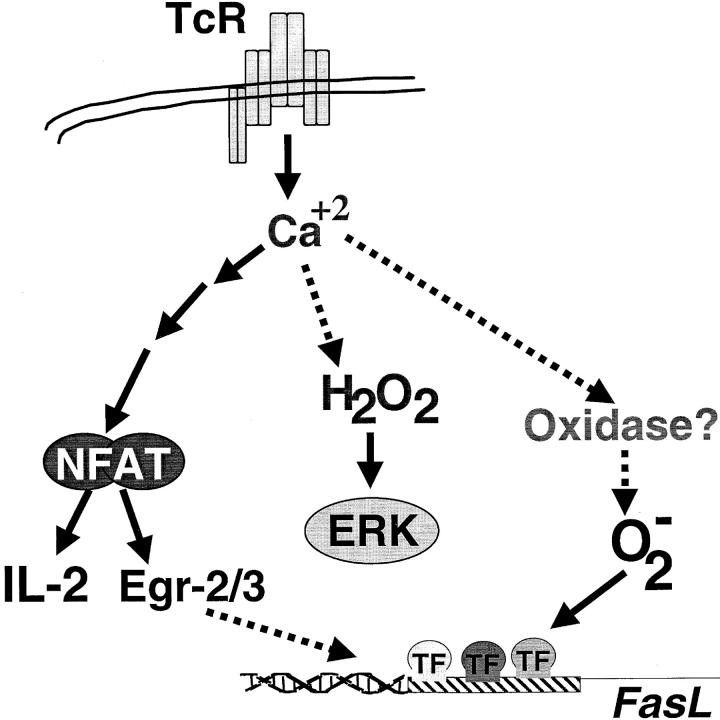
Figure 8. Proposed scheme for TCR-stimulated ROS generation. TCR signaling induces both hydrogen peroxide (H2O2) and superoxide (O2 − in a calcium dependent manner in pathway(s) independent of NFAT activation. Hydrogen peroxide production, from an unknown source, regulates ERK activation. Superoxide anion may be derived from an NADH/NADPH oxidase and is required for FasL promoter activation.
Figure 8. Proposed scheme for TCR-stimulated ROS generation. TCR signaling induces both hydrogen peroxide (H2O2) and superoxide (O2 − in a calcium dependent manner in pathway(s) independent of NFAT activation. Hydrogen peroxide production, from an unknown source, regulates ERK activation. Superoxide anion may be derived from an NADH/NADPH oxidase and is required for FasL promoter activation.CC BY-NC-SA · PubMed Central

Verification

Claims the paper makes

The claims and statistics of this paper haven’t been checked yet.

Run the check — free, no account needed. It reads the open-access text and checks the sources it cites.

A few free checks a day · papers already verified open instantly · results are public

Claims other papers make about this one

Each is checked against this paper’s own text: does it say what the citing paper says it does?

Self-check

Percentages, sums and reported differences re-computed from the paper’s own numbers.

The self-check needs the paper’s full text.

Citations

Cites

Show all 59 references

Research works printed but not linked: 4

  1. 1992, Adv. Enzymol., 65, 49
  2. 1988, Immunology., 63, 431
  3. 1999, Cancer Res., 59, 6276
  4. 1998, Environ. Health Perspect., 106, 1179

Cited by

Sorted by citations

See all 459

Metadata

Authors
Devadas, S., Zaritskaya, L., Rhee, S. G., Oberley, L., & Williams, M. S.
Affiliations
  • American Red Cross (US)
  • National Institutes of Health (US)
  • University of Iowa (US)
Venue
The Journal of Experimental Medicine
Published
2002-01-07
Volume
195
Issue
1
Pages
59-70
ISSN
  • 0022-1007 (ISSN-L)
  • 1540-9538
OpenAlex
W2157579772
Cited by
458
References
59
Citations by year
2026: 11 · 2025: 10 · 2024: 22 · 2023: 10 · 2022: 19 · 2021: 26 · 2020: 29 · 2019: 19 · 2018: 18 · 2017: 21 · 2016: 19 · 2015: 19 · 2014: 21 · 2013: 18 · 2012: 15
FWCI
8.23
Type
journal article
Language
en
Open access
Locations
  • The Journal of Experimental Medicine (publishedVersion)
  • PubMed Central (publishedVersion, cc-by-nc-sa)
  • PubMed (publishedVersion)
Funders
American Heart Association
Topics
  • Life Sciences › Biochemistry, Genetics and Molecular Biology › Molecular Biology › Redox biology and oxidative stress
  • Life Sciences › Immunology and Microbiology › Immunology › Neutrophil, Myeloperoxidase and Oxidative Mechanisms
  • Life Sciences › Immunology and Microbiology › Immunology › T-cell and B-cell Immunology
Keywords
T cell receptor signaling, reactive oxygen species, superoxide, hydrogen peroxide, T cell activation, apoptosis, NFAT activation, interleukin-2 transcription, ERK1/2 phosphorylation, redox signaling, oxidative stress
MeSH terms
Animals, Humans, Hybridomas, Hydrogen Peroxide, Lymphocyte Activation, Membrane Glycoproteins, Oxidation-Reduction, Peroxides, Receptors, Antigen, T-Cell, Superoxides, T-Lymphocytes, Signal Transduction, Free Radical Scavengers, Apoptosis, CD3 Complex, Reactive Oxygen Species, Models, Immunological, Mitogen-Activated Protein Kinases, Mice, Fas Ligand Protein

About these checks

Registry, retraction, Cites and statistics results are computed, not judged, with one exception: a printed reference that no index lists is read once by a model before it counts as a citation error. Claims are extracted by a model and kept only when their quote appears verbatim in the text; each cited source is then checked, with a model’s help, for whether it says what the claim relies on. Those verdicts can be wrong — read the claim’s quote and the cited source before relying on one.

Statistics and arithmetic are recomputed, not judged.

Confidence bands are shown only for fields calibrated on our annotated test set. None is calibrated yet, so no band is shown.

What counts as a claim ›How we measure confidence ›How we check this ›

Are you an author, or do you see a problem with this page? Request a review