

The DOI matches its Crossref record; 58 of the 58 references it cites were found in a registry or an index.
Transcriptional Adaptation of Mycobacterium tuberculosis within Macrophages
Open accessAbstract
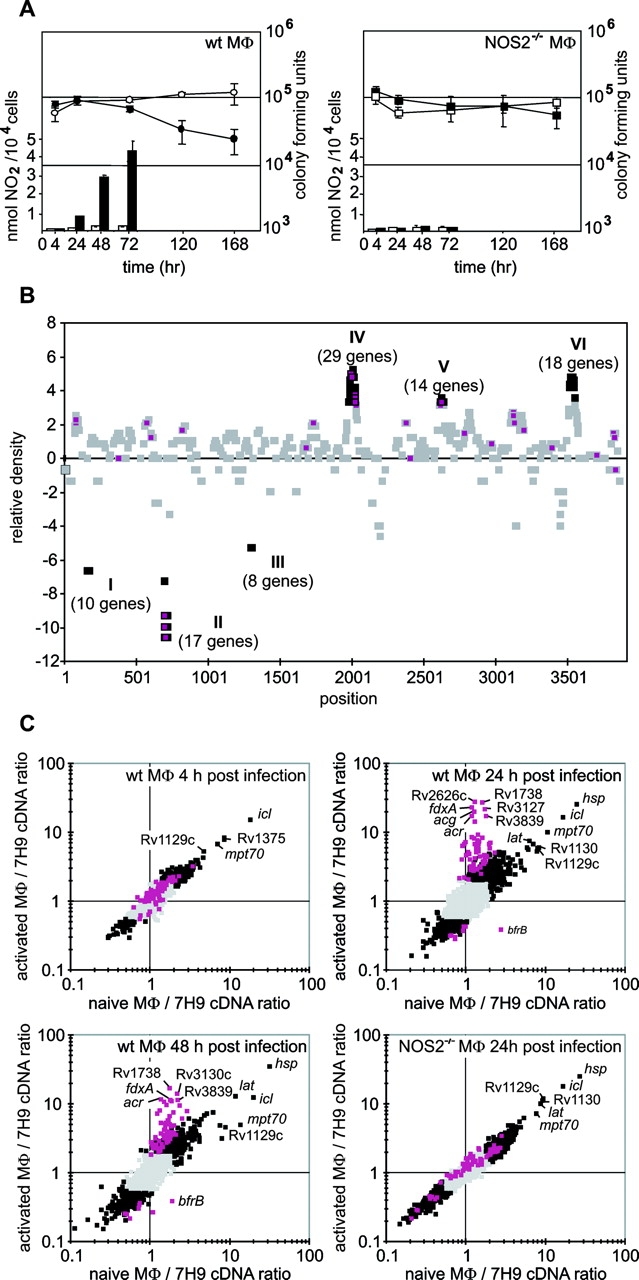
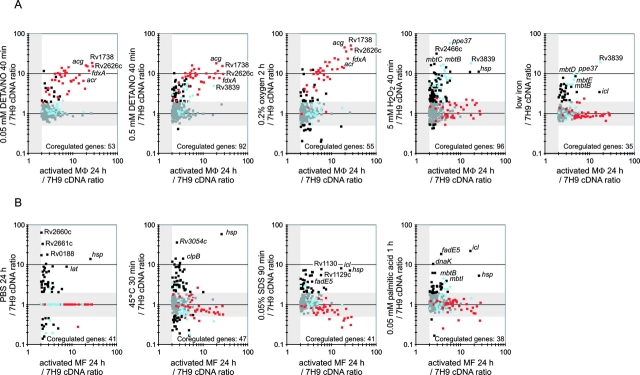
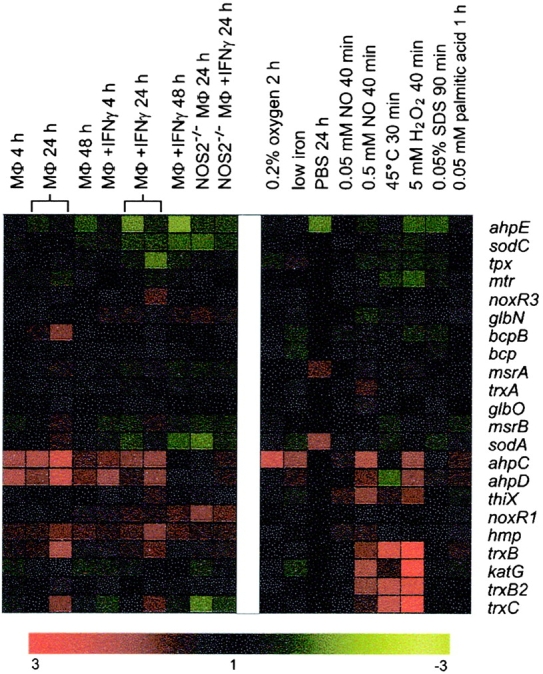
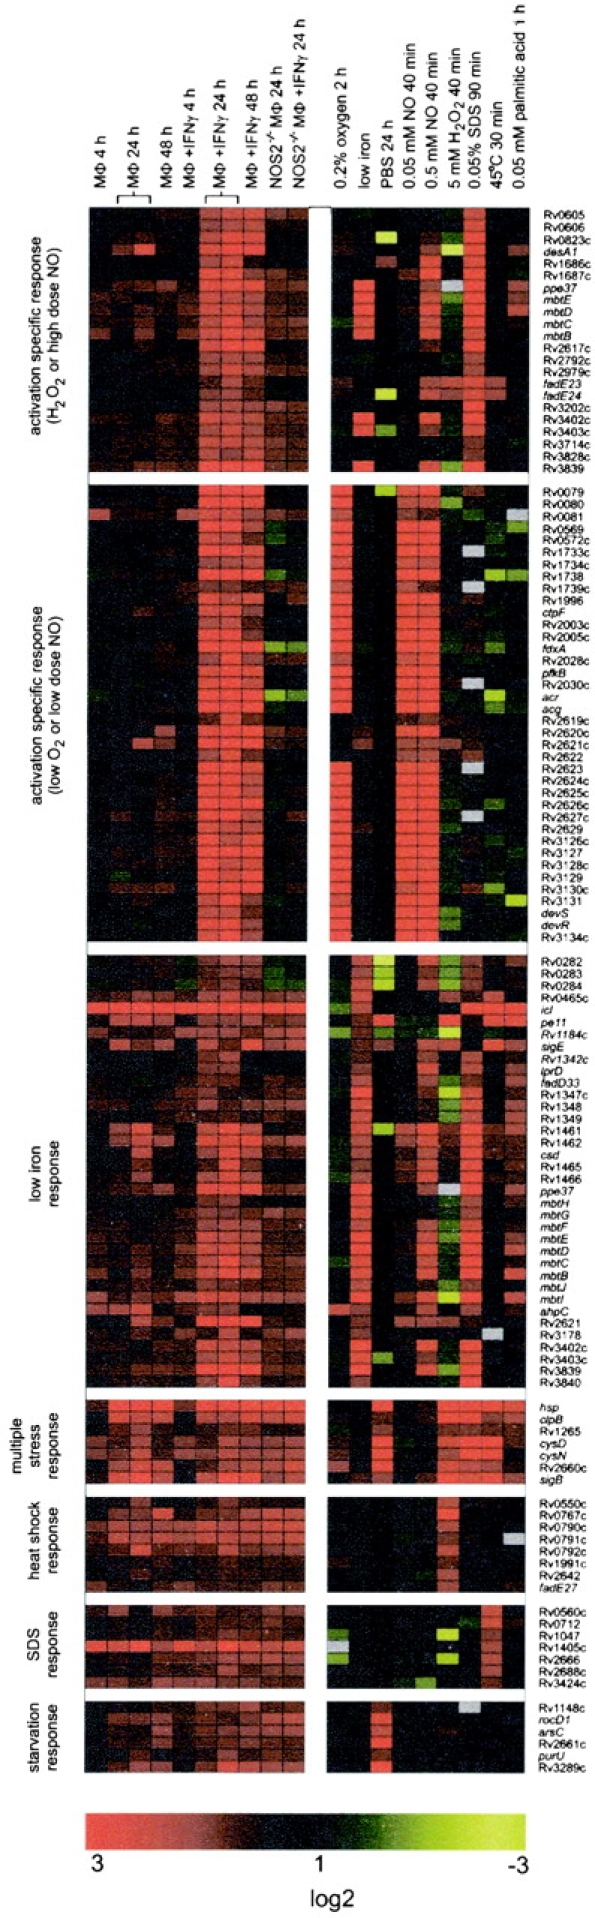
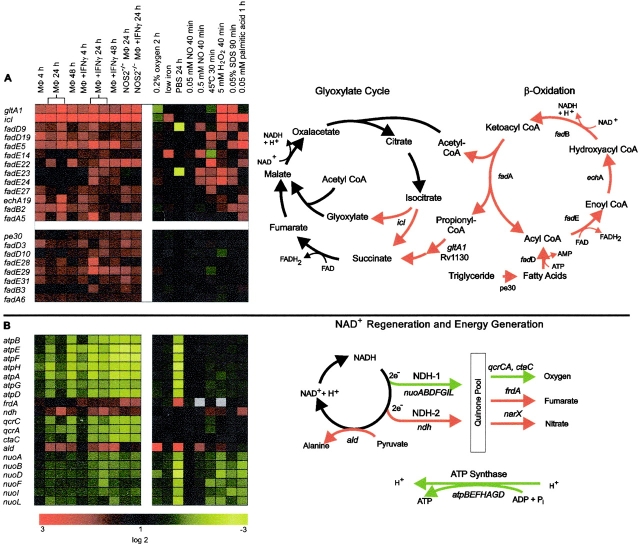
Little is known about the biochemical environment in phagosomes harboring an infectious agent. To assess the state of this organelle we captured the transcriptional responses of Mycobacterium tuberculosis (MTB) in macrophages from wild-type and nitric oxide (NO) synthase 2–deficient mice before and after immunologic activation. The intraphagosomal transcriptome was compared with the transcriptome of MTB in standard broth culture and during growth in diverse conditions designed to simulate features of the phagosomal environment. Genes expressed differentially as a consequence of intraphagosomal residence included an interferon γ– and NO-induced response that intensifies an iron-scavenging program, converts the microbe from aerobic to anaerobic respiration, and induces a dormancy regulon. Induction of genes involved in the activation and β-oxidation of fatty acids indicated that fatty acids furnish carbon and energy. Induction of σE-dependent, sodium dodecyl sulfate–regulated genes and genes involved in mycolic acid modification pointed to damage and repair of the cell envelope. Sentinel genes within the intraphagosomal transcriptome were induced similarly by MTB in the lungs of mice. The microbial transcriptome thus served as a bioprobe of the MTB phagosomal environment, showing it to be nitrosative, oxidative, functionally hypoxic, carbohydrate poor, and capable of perturbing the pathogen's cell envelope.
Overview
The claims and statistics of this paper haven’t been checked yet.
Run the check — free, no account needed. It reads the open-access text and checks the sources it cites.
Integrity signals
Registry
Cites
Statistics
Figures
Verification
Claims the paper makes
The claims and statistics of this paper haven’t been checked yet.
Run the check — free, no account needed. It reads the open-access text and checks the sources it cites.
Claims other papers make about this one
Each is checked against this paper’s own text: does it say what the citing paper says it does?
The cited source says what the claim attributes to it.
In the citing paper
“Several studies have reported that nuo is down-regulated in M. tuberculosis during mouse lung infection (18), survival in macrophages (19), in both non-replicating persistence (NRP)-1 (1% oxygen saturation) and NRP-2 (0.06% oxygen saturation) relative to aerated mid-log growth (18), and upon starvation in vitro (20).”
From Energetics of Respiration and Oxidative Phosphorylation in Mycobacteria (2014) · cites this paper as [19]
The cited source says what the claim attributes to it.
In the citing paper
“In contrast, fumarate reductase, nitrate reductase and NDH-2 are all upregulated under these conditions (19).”
From Energetics of Respiration and Oxidative Phosphorylation in Mycobacteria (2014) · cites this paper as [19]
The cited source says what the claim attributes to it.
In the citing paper
“Transcriptional analysis of M. tuberculosis in the macrophage (phagosomal environment) has revealed that NDH-1, menaquinol-cytochrome c oxidoreductase and the ATP synthase are all down-regulated when compared to cells growing exponentially, suggesting that there is a reduced need for energy generation during bacteriostasis i.e., the growth state of intraphagosomal M. tuberculosis (19).”
From Energetics of Respiration and Oxidative Phosphorylation in Mycobacteria (2014) · cites this paper as [19]
The cited source says what the claim attributes to it.
In the citing paper
“In M. tuberculosis, the atp operon is downregulated during growth in macrophages (19), the mouse lung and in cells exposed to NO or hypoxia (18).”
From Energetics of Respiration and Oxidative Phosphorylation in Mycobacteria (2014) · cites this paper as [19]
In the citing paper
“the fight of the host against the pathogen in M. tuberculosis infection involves several levels including containment of the microbe, generation of radicals and a hostile, acidic environment, deprivation from essential nutrients, formation of anti-mycobacterial peptides and cytokines which strengthen host responses by attracting other immune cells, down to cell damage and suicidal activities of MO”
From Macrophage defense mechanisms against intracellular bacteria (2015) · cites this paper as [5]
In the citing paper
“Accordingly, transcriptional analysis of macrophages and M. tuberculosis has demonstrated that Mycobacteria regulate a myriad of genes to secure a sufficient supply of iron within the cell, whereas macrophages aim to restrict the availability of this metal by different mechanisms (5).”
From Macrophage defense mechanisms against intracellular bacteria (2015) · cites this paper as [5]
Self-check
Percentages, sums and reported differences re-computed from the paper’s own numbers.
The self-check needs the paper’s full text.
Citations
Cites
In silico prediction of protein-protein interactions in human macrophages
Souiai, O., Guerfali, F. Z., Miled, S. B., Brun, C., & Benkahla, A. (2014) · BMC Research Notes · doi:10.1186/1756-0500-7-157 · Cited by 10,785
Significance analysis of microarrays applied to the ionizing radiation response
Tusher, V. G., Tibshirani, R., & Chu, G. (2001) · Proceedings of the National Academy of Sciences · doi:10.1073/pnas.091062498 · Cited by 10,568
Deciphering the biology of Mycobacterium tuberculosis from the complete genome sequence
Cole, S. T., Brosch, R., Parkhill, J., Garnier, T., Churcher, C., Harris, D., Gordon, S. V., Eiglmeier, K., Gas, S., Barry, C. E., et al. (1998) · Nature · doi:10.1038/31159 · Cited by 7,847
Mechanisms of phagocytosis in macrophages
Aderem, A., & Underhill, D. M. (1999) · Annual Review of Immunology · doi:10.1146/annurev.immunol.17.1.593 · Cited by 2,854
Escherichia coli and Salmonella.
Neidhart, F. C. (1996) · Cited by 1,577
Common themes in microbial pathogenicity revisited
Finlay, B. B., & Falkow, S. (1997) · Microbiology and Molecular Biology Reviews · doi:10.1128/mmbr.61.2.136-169.1997 · Cited by 1,474
Nathan, C., & Shiloh, M. U. (2000) · Proceedings of the National Academy of Sciences · doi:10.1073/pnas.97.16.8841 · Cited by 1,469
Self-citationBetts, J. C., Lukey, P. T., Robb, L. C., McAdam, R. A., & Duncan, K. (2002) · Molecular Microbiology · doi:10.1046/j.1365-2958.2002.02779.x · Cited by 1,395
McKinney, J. D., zu Bentrup, K. H., Muñoz‐Elías, E. J., Miczák, A., Chen, B., Chan, W.-T., Swenson, D. L., Sacchettini, J. C., Jacobs, W. R., & Russell, D. G. (2000) · Nature · doi:10.1038/35021074 · Cited by 1,361
Flynn, J., & Chan, J. (2003) · Annual Review of Immunology · doi:10.1146/annurev.immunol.19.1.93 · Cited by 1,144
Research works printed but not linked: 1
- 1997, Microbiol. Mol. Biol. Rev., 61, 136
Cited by
Sorted by citations
The spectrum of latent tuberculosis: rethinking the biology and intervention strategies
Barry, C. E., Boshoff, H. I., Dartois, V. A., Dick, T., Ehrt, S., Flynn, J. L., Schnappinger, D., Wilkinson, R. J., & Young, D. B. (2009) · Nature Reviews Microbiology · doi:10.1038/nrmicro2236 · Cited by 1,441
Self-citationMacrophage defense mechanisms against intracellular bacteria
Weiss, G., & Schaible, U. E. (2015) · Immunological Reviews · doi:10.1111/imr.12266 · Cited by 989
Inhibition of Respiration by Nitric Oxide Induces a Mycobacterium tuberculosis Dormancy Program
Voskuil, M. I., Schnappinger, D., Visconti, K. C., Harrell, M. I., Dolganov, G., Sherman, D. R., & Schoolnik, G. K. (2003) · The Journal of Experimental Medicine · doi:10.1084/jem.20030205 · Cited by 975
Self-citationSkin microbiota–host interactions
Chen, Y. E., Fischbach, M. A., & Belkaid, Y. (2018) · Nature · doi:10.1038/nature25177 · Cited by 815
Muñoz‐Elías, E. J., & McKinney, J. D. (2005) · Nature Medicine · doi:10.1038/nm1252 · Cited by 760
Metadata
- Authors
- Schnappinger, D., Ehrt, S., Voskuil, M. I., Liu, Y., Mangan, J. A., Monahan, I. M., Dolganov, G., Efron, B., Butcher, P. D., Nathan, C., & Schoolnik, G. K.
- Affiliations
- Cornell University (US)
- 3Department of Microbiology and Immunology, Weill Medical College and Graduate Programs in
- Stanford Medicine (US)
- St George's, University of London (GB)
- University of California, San Francisco (US)
- Stanford University (US)
- Corresponding author
- Schnappinger, Dirk
- ORCID
- Venue
- The Journal of Experimental Medicine
- Publisher
- Rockefeller University Press
- Published
- 2003-09-01
- Volume
- 198
- Issue
- 5
- Pages
- 693-704
- ISSN
- 0022-1007 (ISSN-L)
- 1540-9538
- PMC
- PMC2194186
- OpenAlex
- W2007097682
- Cited by
- 1,420
- References
- 58
- Citations by year
- 2026: 26 · 2025: 35 · 2024: 46 · 2023: 32 · 2022: 55 · 2021: 41 · 2020: 37 · 2019: 68 · 2018: 63 · 2017: 65 · 2016: 61 · 2015: 96 · 2014: 90 · 2013: 75 · 2012: 96
- FWCI
- 31.28
- Type
- journal article
- Language
- en
- Open access
- bronze
- doi.org
- Locations
- The Journal of Experimental Medicine (publishedVersion)
- PubMed Central (publishedVersion, cc-by-nc-sa)
- PubMed (publishedVersion)
- St George's Online Research Archive (St George's University of London) (acceptedVersion)
- Funders
- Hearst Foundations
- Deutsche Forschungsgemeinschaft
- National Institutes of Health
- Defense Advanced Research Projects Agency
- Advanced Research Projects Agency
- Medical Research Council
- National Heart, Lung, and Blood Institute (R01HL068525, HL 61241, HL68525, R01HL061241)
- National Institute of Allergy and Infectious Diseases (R01AI044826, AI-44826)
- Topics
- Health Sciences › Medicine › Infectious Diseases › Tuberculosis Research and Epidemiology
- Health Sciences › Medicine › Epidemiology › Mycobacterium research and diagnosis
- Life Sciences › Biochemistry, Genetics and Molecular Biology › Genetics › Bacterial Genetics and Biotechnology
- Keywords
- Mycobacterium tuberculosis, macrophages, nitric oxide synthase 2, interferon-gamma, iron scavenging, anaerobic respiration, fatty acid beta-oxidation, sigma E, cell envelope damage, hypoxia, nitrosative stress, tuberculosis pathogenesis
- MeSH terms
- Animals, Macrophages, Mycobacterium tuberculosis, Phagosomes, RNA, Bacterial, Transcription, Genetic, Gene Expression Regulation, Bacterial, Mice
About these checks
Registry, retraction, Cites and statistics results are computed, not judged, with one exception: a printed reference that no index lists is read once by a model before it counts as a citation error. Claims are extracted by a model and kept only when their quote appears verbatim in the text; each cited source is then checked, with a model’s help, for whether it says what the claim relies on. Those verdicts can be wrong — read the claim’s quote and the cited source before relying on one.
Statistics and arithmetic are recomputed, not judged.
Confidence bands are shown only for fields calibrated on our annotated test set. None is calibrated yet, so no band is shown.
What counts as a claim ›How we measure confidence ›How we check this ›
Are you an author, or do you see a problem with this page? Request a review
