

The DOI matches its Crossref record; 63 of the 63 references it cites were found in a registry or an index.
An inflammation-induced mechanism for leukocyte transmigration across lymphatic vessel endothelium
Open accessAbstract
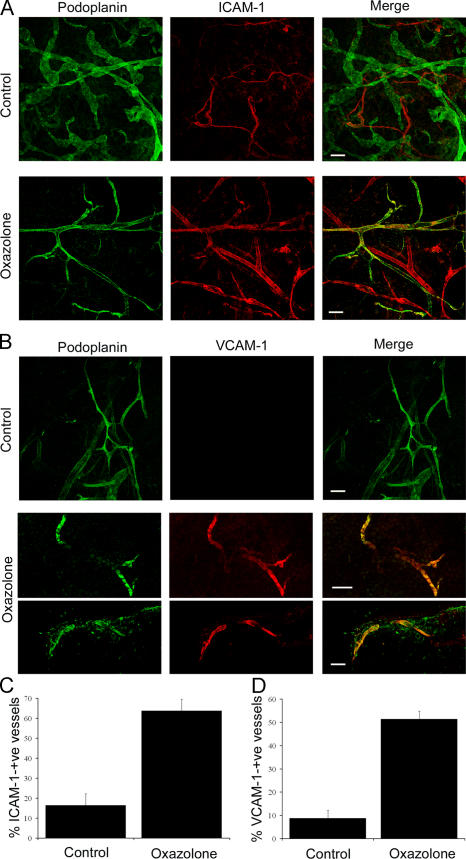
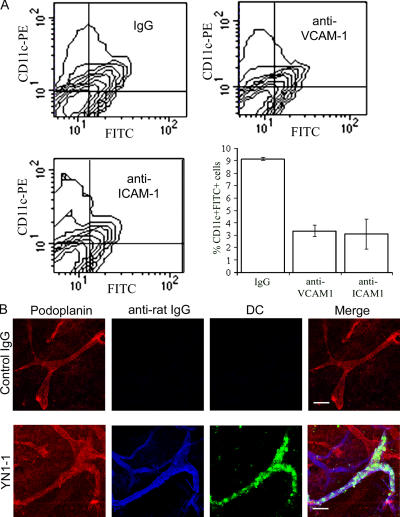
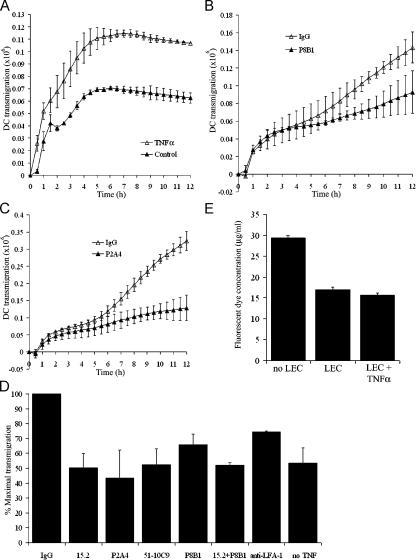
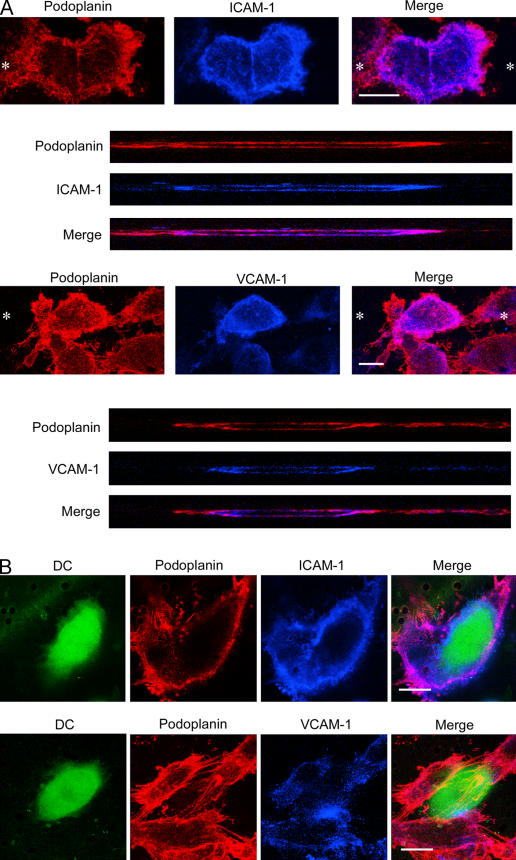
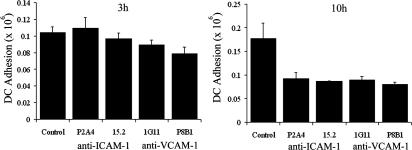
The exit of antigen-presenting cells and lymphocytes from inflamed skin to afferent lymph is vital for the initiation and maintenance of dermal immune responses. How such an exit is achieved and how cells transmigrate the distinct endothelium of lymphatic vessels are unknown. We show that inflammatory cytokines trigger activation of dermal lymphatic endothelial cells (LECs), leading to expression of the key leukocyte adhesion receptors intercellular adhesion molecule 1 (ICAM-1), vascular cell adhesion molecule 1 (VCAM-1), and E-selectin, as well as a discrete panel of chemokines and other potential regulators of leukocyte transmigration. Furthermore, we show that both ICAM-1 and VCAM-1 are induced in the dermal lymphatic vessels of mice exposed to skin contact hypersensitivity where they mediate lymph node trafficking of dendritic cells (DCs) via afferent lymphatics. Lastly, we show that tumor necrosis factor α stimulates both DC adhesion and transmigration of dermal LEC monolayers in vitro and that the process is efficiently inhibited by ICAM-1 and VCAM-1 adhesion-blocking monoclonal antibodies. These results reveal a CAM-mediated mechanism for recruiting leukocytes to the lymph nodes in inflammation and highlight the process of lymphatic transmigration as a potential new target for antiinflammatory therapy.
Overview
The claims and statistics of this paper haven’t been checked yet.
Run the check — free, no account needed. It reads the open-access text and checks the sources it cites.
Integrity signals
Registry
Cites
Statistics
Figures
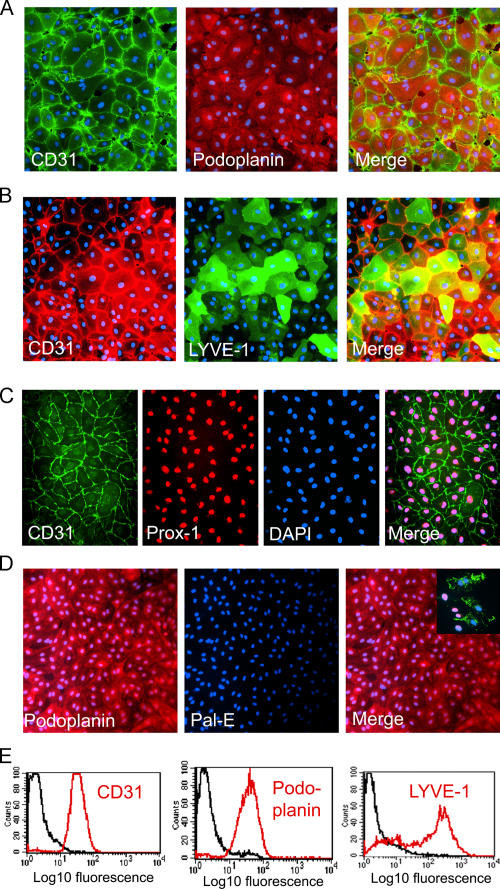
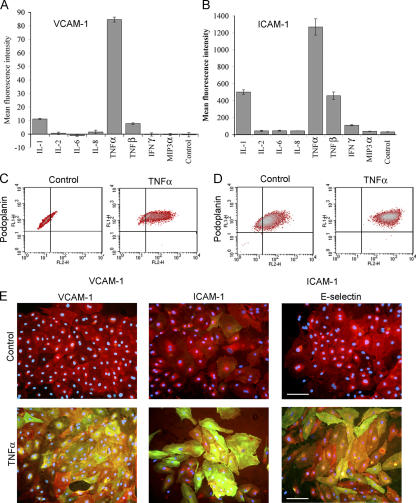
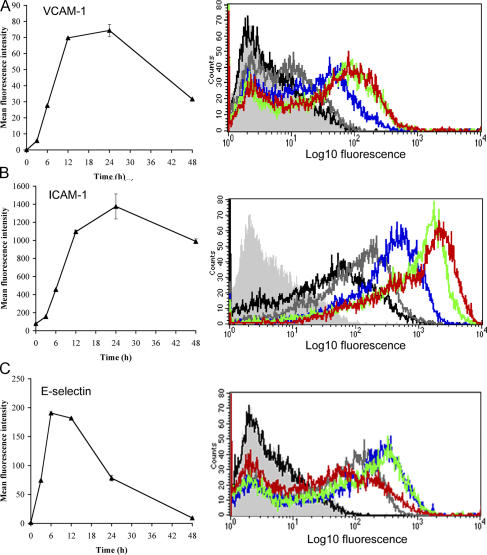
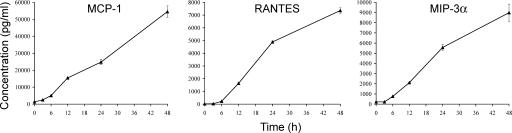
Verification
Claims the paper makes
The claims and statistics of this paper haven’t been checked yet.
Run the check — free, no account needed. It reads the open-access text and checks the sources it cites.
Claims other papers make about this one
Each is checked against this paper’s own text: does it say what the citing paper says it does?
The cited source says what the claim attributes to it.
In the citing paper
“Entry of DCs into initial LVs under inflammatory conditions is thus dependent upon integrins and their ligands (109, 110).”
From Transport and Immune Functions of the Lymphatic System. (2025) · cites this paper as [109]
The cited source says what the claim attributes to it.
In the citing paper
“This can be explained because ICAM-1 and VCAM-1 are largely absent from LECs under such conditions but are induced by inflammation (109, 110).”
From Transport and Immune Functions of the Lymphatic System. (2025) · cites this paper as [109]
Self-check
Percentages, sums and reported differences re-computed from the paper’s own numbers.
The self-check needs the paper’s full text.
Citations
Cites
Carmichael, J., DeGraff, W., Gazdar, A. F., Minna, J. D., & Mitchell, J. B. (1987) · PubMed · Cited by 3,813
Leukocyte-endothelial cell recognition: Three (or more) steps to specificity and diversity
Butcher, E. C. (1991) · Cell · doi:10.1016/0092-8674(91)90279-8 · Cited by 2,789
Förster, R., Schubel, A., Breitfeld, D., Kremmer, E., Renner‐Müller, I., Wolf, E., & Lipp, M. (1999) · Cell · doi:10.1016/s0092-8674(00)80059-8 · Cited by 2,348
Mellman, I., & Steinman, R. M. (2001) · Cell · doi:10.1016/s0092-8674(01)00449-4 · Cited by 2,256
LYVE-1, a New Homologue of the CD44 Glycoprotein, Is a Lymph-specific Receptor for Hyaluronan
Banerji, S., Ni, J., Wang, S.-X., Clasper, S., Su, J. Y., Tammi, R., Jones, M., & Jackson, D. G. (1999) · The Journal of Cell Biology · doi:10.1083/jcb.144.4.789 · Cited by 1,586
Self-citationProx1 Function Is Required for the Development of the Murine Lymphatic System
Wigle, J. T., & Oliver, G. C. (1999) · Cell · doi:10.1016/s0092-8674(00)81511-1 · Cited by 1,581
Dieu‐Nosjean, M., Vanbervliet, B., Vicari, A. P., Bridon, J., Oldham, E., Aït‐Yahia, S., Brière, F., Zlotnik, A., Lebecque, S., & Caux, C. (1998) · The Journal of Experimental Medicine · doi:10.1084/jem.188.2.373 · Cited by 1,424
Immune cell migration in inflammation: present and future therapeutic targets
Luster, A. D., Alon, R., & von Andrian, U. H. (2005) · Nature Immunology · doi:10.1038/ni1275 · Cited by 1,313
Homing and cellular traffic in lymph nodes
von Andrian, U. H., & Mempel, T. R. (2003) · Nature reviews. Immunology · doi:10.1038/nri1222 · Cited by 1,271
Dendritic-cell trafficking to lymph nodes through lymphatic vessels
Randolph, G. J., Angeli, V., & Swartz, M. A. (2005) · Nature Reviews Immunology · doi:10.1038/nri1670 · Cited by 1,111
Angiosarcomas Express Mixed Endothelial Phenotypes of Blood and Lymphatic Capillaries
Breiteneder-Geleff, S., Soleiman, A., Kowalski, H., Horvat, R., Amann, G., Kriehuber, E., Diem, K., Weninger, W., Tschachler, E., Alitalo, K. K., et al. (1999) · American Journal Of Pathology · doi:10.1016/s0002-9440(10)65285-6 · Cited by 1,088
Gunn, M. D., Kyuwa, S., Tam‐Amersdorfer, C., Kakiuchi, T., Matsuzawa, A., Williams, L. T., & Nakano, H. (1999) · The Journal of Experimental Medicine · doi:10.1084/jem.189.3.451 · Cited by 1,019
Dustin, M. L., & Springer, T. A. (1988) · The Journal of Cell Biology · doi:10.1083/jcb.107.1.321 · Cited by 985
An essential role for Prox1 in the induction of the lymphatic endothelial cell phenotype
Wigle, J. T., Harvey, N., Detmar, M., Lagutina, I., Grosveld, G., Gunn, M. D., Jackson, D. G., & Oliver, G. (2002) · The EMBO Journal · doi:10.1093/emboj/21.7.1505 · Cited by 943
Self-citationRegulation of Dendritic Cell Migration to the Draining Lymph Node
Martín-Fontecha, A., Sebastiani, S., Höpken, U. E., Uguccioni, M., Lipp, M., Lanzavecchia, A., & Sallusto, F. (2003) · The Journal of Experimental Medicine · doi:10.1084/jem.20030448 · Cited by 878
Mäkinen, T., Veikkola, T., Mustjoki, S. M., Kärpänen, T., Catimel, B., Nice, E. C., Wise, L. M., Mercer, A., Kowalski, H., Kerjaschki, D., et al. (2001) · The EMBO Journal · doi:10.1093/emboj/20.17.4762 · Cited by 858
Leukocyte–endothelial-cell interactions in leukocyte transmigration and the inflammatory response
Müller, W. A. (2003) · Trends in Immunology · doi:10.1016/s1471-4906(03)00117-0 · Cited by 824
CCL27–CCR10 interactions regulate T cell–mediated skin inflammation
Homey, B., Alenius, H. T., Müller, A., Soto, H., Bowman, E. P., Yuan, W., McEvoy, L. M., Lauerma, A., Assmann, T., Bünemann, E., et al. (2002) · Nature Medicine · doi:10.1038/nm0202-157 · Cited by 807
Pober, J. S., Bevilacqua, M. P., Mendrick, D. L., Lapierre, L. A., Fiers, W., & Gimbrone, M. A. (1986) · The Journal of Immunology · doi:10.4049/jimmunol.136.5.1680 · Cited by 736
Carman, C. V., & Springer, T. A. (2004) · The Journal of Cell Biology · doi:10.1083/jcb.200404129 · Cited by 682
Saeki, H., Moore, A. M., Brown, M. J., & Hwang, S. T. (1999) · The Journal of Immunology · doi:10.4049/jimmunol.162.5.2472 · Cited by 623
Barreiro, O., Yáñez‐Mó, M., Serrador, J. M., Montoya, M. C., Vicente‐Manzanares, M., Tejedor, R., Furthmayr, H., & Sánchez‐Madrid, F. (2002) · The Journal of Cell Biology · doi:10.1083/jcb.200112126 · Cited by 594
Sligh, J. E., Ballantyne, C. M., Rich, S. S., Hawkins, H. K., Smith, C. W., Bradley, A., & Beaudet, A. L. (1993) · Proceedings of the National Academy of Sciences · doi:10.1073/pnas.90.18.8529 · Cited by 562
Inflammatory Chemokine Transport and Presentation in HEV
Palframan, R. T., Jung, S., Cheng, G., Weninger, W., Luo, Y., Dorf, M. E., Littman, D. R., Rollins, B. J., Zweerink, H. J., Rot, A., et al. (2001) · The Journal of Experimental Medicine · doi:10.1084/jem.194.9.1361 · Cited by 551
Carlos, T., Schwartz, B., Kovach, N. L., Yee, E., Rosa, M., Osborn, L., Chi-Rosso, G., Newman, B., Lobb, R. R., & Rosa, M. R. M. C. T. (1990) · Blood · doi:10.1182/blood.v76.5.965.965 · Cited by 527
Kriehuber, E., Breiteneder-Geleff, S., Gröger, M., Soleiman, A., SCHOPPMANN, S. F., Stingl, G., Kerjaschki, D., & Maurer, D. (2001) · The Journal of Experimental Medicine · doi:10.1084/jem.194.6.797 · Cited by 526
Immunoregulatory mechanisms involved in elicitation of allergic contact hypersensitivity
Grabbe, S., & Schwarz, T. (1998) · Immunology Today · doi:10.1016/s0167-5699(97)01186-9 · Cited by 513
Bromley, S. K., Thomas, S. Y., & Luster, A. D. (2005) · Nature Immunology · doi:10.1038/ni1240 · Cited by 509
CD99 plays a major role in the migration of monocytes through endothelial junctions
Schenkel, A. R., Mamdouh, Z., Chen, X., Liebman, R. M., & Müller, W. A. (2002) · Nature Immunology · doi:10.1038/ni749 · Cited by 507
Molecular characterization of lymphatic endothelial cells
Podgrabinska, S., Falter‐Braun, P., Velasco, P., Kloos, B., Pepper, M. S., Jackson, D. G., & Skobe, M. (2002) · Proceedings of the National Academy of Sciences · doi:10.1073/pnas.242401399 · Cited by 486
Self-citationChemokine receptor CCR7 required for T lymphocyte exit from peripheral tissues
Debes, G. F., Arnold, C. N., Young, A. J., Krautwald, S., Lipp, M., Hay, J. B., & Butcher, E. C. (2005) · Nature Immunology · doi:10.1038/ni1238 · Cited by 484
Mouse LYVE-1 Is an Endocytic Receptor for Hyaluronan in Lymphatic Endothelium
Prevo, R., Banerji, S., Ferguson, D. J. P., Clasper, S., & Jackson, D. G. (2001) · Journal of Biological Chemistry · doi:10.1074/jbc.m011004200 · Cited by 477
Self-citationLeukocyte extravasation: chemokine transport and presentation by the endothelium
Middleton, J., Patterson, A. M., Gardner, L., Schmutz, C., & Ashton, B. A. (2002) · Blood · doi:10.1182/blood.v100.12.3853 · Cited by 472
Locomotion of monocytes on endothelium is a critical step during extravasation
Schenkel, A. R., Mamdouh, Z., & Müller, W. A. (2004) · Nature Immunology · doi:10.1038/ni1051 · Cited by 441
Hirakawa, S., Hong, Y., Harvey, N. L., Schacht, V., Matsuda, K. M., Libermann, T. A., & Detmar, M. J. (2003) · American Journal Of Pathology · doi:10.1016/s0002-9440(10)63851-5 · Cited by 439
Millán, J., Hewlett, L. J., Glyn, M., Toomre, D. K., Clark, P., & Ridley, A. J. (2006) · Nature Cell Biology · doi:10.1038/ncb1356 · Cited by 416
Mackay, F., Loetscher, H., Stueber, D., Gehr, G., & Lesslauer, W. (1993) · The Journal of Experimental Medicine · doi:10.1084/jem.177.5.1277 · Cited by 391
Oliver, G. C., & Detmar, M. J. (2002) · Genes & Development · doi:10.1101/gad.975002 · Cited by 375
Muller, W. A., Ratti, C. M., McDonnell, S. L., & Cohn, Z. A. (1989) · The Journal of Experimental Medicine · doi:10.1084/jem.170.2.399 · Cited by 358
Structure, Function, and Molecular Control of the Skin Lymphatic System
Skobe, M., & Detmar, M. J. (2000) · Journal of Investigative Dermatology Symposium Proceedings · doi:10.1046/j.1087-0024.2000.00001.x · Cited by 269
Monoclonal antibody PAL-E specific for endothelium.
Schlingemann, R. O., Dingjan, G. M., Emeis, J. J., Blok, J., Warnaar, S. O., & Ruiter, D. J. (1985) · PubMed · Cited by 251
Gosset, P., Charbonnier, A.-S., Delerive, P., Fontaine, J., Staels, B., Pestel, J., Tonnel, A., & Trottein, F. (2001) · European Journal of Immunology · doi:10.1002/1521-4141(2001010)31:10 · Cited by 225
Takei, F. (1985) · The Journal of Immunology · doi:10.4049/jimmunol.134.3.1403 · Cited by 224
Inobe, J.-I., Slavin, A., Komagata, Y., Chen, Y., Liu, L., & Weiner, H. L. (1998) · European Journal of Immunology · doi:10.1002/(sici)1521-4141(199809)28:09 · Cited by 214
Leak, L. V. (1970) · Microvascular Research · doi:10.1016/0026-2862(70)90031-2 · Cited by 213
Jackson, D. G. (2004) · Apmis · doi:10.1111/j.1600-0463.2004.apm11207-0811.x · Cited by 210
Self-citationEngelhardt, B., Laschinger, M., Schulz, M., Samulowitz, U., Vestweber, D., & Hoch, G. (1998) · Journal of Clinical Investigation · doi:10.1172/jci4271 · Cited by 203
The parting of the endothelium: miracle, or simply a junctional affair?
Johnson‐Léger, C., Aurrand‐Lions, M., & Imhof, B. A. (2000) · Journal of Cell Science · doi:10.1242/jcs.113.6.921 · Cited by 188
Cera, M. R., Prete, A. D., Vecchi, A., Corada, M., Martín-Padura, I., Motoike, T., Tonetti, P., Bazzoni, G., Vermi, W., Gentili, F., et al. (2004) · Journal of Clinical Investigation · doi:10.1172/jci21231 · Cited by 172
Stoitzner, P., Holzmann, S., McLellan, A. D., Ivarsson, L., Stössel, H., Kapp, M., Kämmerer, U., Douillard, P., Kämpgen, E., Koch, F., et al. (2003) · Journal of Investigative Dermatology · doi:10.1046/j.1523-1747.2003.12042.x · Cited by 170
A Close-Up View of Migrating Langerhans Cells in the Skin
Stoitzner, P., Stössel, H., Romani, N., & Pfaller, K. (2002) · Journal of Investigative Dermatology · doi:10.1046/j.0022-202x.2001.01631.x · Cited by 149
The structure of lymphatic capillaries in lymph formation.
Leak, L. V. (1976) · PubMed · Cited by 147
Dittel, B. N., McCarthy, J. B., Wayner, E. A., & LeBien, T. W. (1993) · Blood · doi:10.1182/blood.v81.9.2272.2272 · Cited by 147
Müller, W. A., & Weigl, S. A. (1992) · The Journal of Experimental Medicine · doi:10.1084/jem.176.3.819 · Cited by 134
Leukocyte transendothelial migration: A junctional affair
Luscinskas, F. W., Ma, S., Nusrat, A., Parkos, C. A., & Shaw, S. K. (2002) · Seminars in Immunology · doi:10.1006/smim.2001.0347 · Cited by 126
Structure function relationships in the lymphatic system and implications for cancer biology
Witte, M. H., Jones, K., Wilting, J., Dictor, M. R., Selg, M., McHale, N. G., Gershenwald, J. E., & Jackson, D. G. (2006) · Cancer and Metastasis Reviews · doi:10.1007/s10555-006-8496-2 · Cited by 123
Self-citationEntry Into Afferent Lymphatics and Maturation In Situ of Migrating Murine Cutaneous Dendritic Cells
Weinlich, G., Heine, M., Stössel, H., Zanella, M., Stoitzner, P., Ortner, U., Smolle, J., Koch, F., Sepp, N. T., Schuler, G., et al. (1998) · Journal of Investigative Dermatology · doi:10.1046/j.1523-1747.1998.00161.x · Cited by 113
Nisato, R. E., Harrison, J., Buser, R., Orci, L., Rinsch, C., Montesano, R., Dupraz, P., & Pepper, M. S. (2004) · American Journal Of Pathology · doi:10.1016/s0002-9440(10)63271-3 · Cited by 102
Rubbia‐Brandt, L., Terris, B., Giostra, E., Dousset, B. E., Morel, P., & Pepper, M. S. (2004) · Clinical Cancer Research · doi:10.1158/1078-0432.ccr-04-0397 · Cited by 77
Epidermal Langerhans cell migration and sensitisation to chemical allergens
Cumberbatch, M., Dearman, R. J., Griffiths, C. E. M., & Kimber, I. (2003) · Apmis · doi:10.1034/j.1600-0463.2003.11107811.x · Cited by 76
Banerji, S., Day, A. J., Kahmann, J. D., & Jackson, D. G. (1998) · Protein Expression and Purification · doi:10.1006/prep.1998.0971 · Cited by 76
Self-citationMolecular identification of PAL-E, a widely used endothelial-cell marker
Niemelä, H., Elima, K., Henttinen, T. A., Irjala, H., Salmi, M., & Jalkanen, S. (2005) · Blood · doi:10.1182/blood-2005-01-0254 · Cited by 71
Hoerr, I. (2000) · doi:10.1002/1521-4141(200001)30:1
Research works printed but not linked: 7
- 2003, Trends Immunol., 24, 327
- 1976, Fed. Proc., 35, 1863
- 2002, Proc. Natl. Acad. Sci.
- 1985, Lab. Invest., 52, 71
- 2005, Blood., 106, 3405
- 2002, Nat. Immunol., 3, 143
- 1987, Cancer Res., 47, 936
Cited by
Sorted by citations
Innate and adaptive immune cells in the tumor microenvironment
Gajewski, T. F., Schreiber, H., & Fu, Y.-X. (2013) · Nature Immunology · doi:10.1038/ni.2703 · Cited by 4,148
Hyaluronan as an Immune Regulator in Human Diseases
Jiang, D., Liang, J., & Noble, P. W. (2011) · Physiological Reviews · doi:10.1152/physrev.00052.2009 · Cited by 1,060
Functionally specialized junctions between endothelial cells of lymphatic vessels
Baluk, P., Fuxe, J., Hashizume, H., Romano, T., Lashnits, E., Butz, S., Vestweber, D., Corada, M., Molendini, C., Dejana, E., et al. (2007) · The Journal of Experimental Medicine · doi:10.1084/jem.20062596 · Cited by 1,006
Development and Function of Dendritic Cell Subsets
Mildner, A., & Jung, S. (2014) · Immunity · doi:10.1016/j.immuni.2014.04.016 · Cited by 804
Cell Adhesion Molecules and Their Roles and Regulation in the Immune and Tumor Microenvironment
Harjunpää, H., Asens, M. L., Guenther, C., & Fagerholm, S. C. (2019) · Frontiers in Immunology · doi:10.3389/fimmu.2019.01078 · Cited by 779
Metadata
- Authors
- Johnson, L. A., Clasper, S., Holt, A. P., Lalor, P. F., Baban, D., & Jackson, D. G.
- Affiliations
- John Radcliffe Hospital (GB)
- University of Birmingham (GB)
- University of Oxford (GB)
- Venue
- The Journal of Experimental Medicine
- Publisher
- Rockefeller University Press
- Published
- 2006-11-20
- Volume
- 203
- Issue
- 12
- Pages
- 2763-2777
- ISSN
- 0022-1007 (ISSN-L)
- 1540-9538
- PMC
- PMC2118156
- OpenAlex
- W2163380226
- Cited by
- 346
- References
- 63
- Citations by year
- 2026: 12 · 2025: 7 · 2024: 14 · 2023: 17 · 2022: 16 · 2021: 20 · 2020: 19 · 2019: 12 · 2018: 17 · 2017: 17 · 2016: 24 · 2015: 14 · 2014: 20 · 2013: 28 · 2012: 16
- FWCI
- 9.04
- Type
- journal article
- Language
- en
- Open access
- bronze
- doi.org
- Locations
- The Journal of Experimental Medicine (publishedVersion)
- Europe PMC (PubMed Central) (publishedVersion, cc-by-nc-sa)
- PubMed Central (publishedVersion, cc-by-nc-sa)
- PubMed (publishedVersion)
- University of Birmingham Research Portal (University of Birmingham) (submittedVersion)
- Funders
- Cancer Research UK
- Medical Research Council
- Topics
- Health Sciences › Medicine › Oncology › Lymphatic System and Diseases
- Health Sciences › Medicine › Immunology and Allergy › Cell Adhesion Molecules Research
- Health Sciences › Medicine › Surgery › Lymphatic Disorders and Treatments
- Keywords
- leukocyte transmigration, lymphatic endothelium, dermal lymphatic vessels, ICAM-1, VCAM-1, E-selectin, chemokines, dendritic cells, lymph node trafficking, afferent lymphatics, TNF-α, inflammatory cytokines, leukocyte adhesion
- MeSH terms
- Adult, Animals, Cells, Cultured, Dermatitis, Contact, Endothelium, Lymphatic, Humans, Leukocytes, Male, Mice, Inbred BALB C, Intercellular Adhesion Molecule-1, Vascular Cell Adhesion Molecule-1, Lymphatic Vessels, Mice
About these checks
Registry, retraction, Cites and statistics results are computed, not judged, with one exception: a printed reference that no index lists is read once by a model before it counts as a citation error. Claims are extracted by a model and kept only when their quote appears verbatim in the text; each cited source is then checked, with a model’s help, for whether it says what the claim relies on. Those verdicts can be wrong — read the claim’s quote and the cited source before relying on one.
Statistics and arithmetic are recomputed, not judged.
Confidence bands are shown only for fields calibrated on our annotated test set. None is calibrated yet, so no band is shown.
What counts as a claim ›How we measure confidence ›How we check this ›
Are you an author, or do you see a problem with this page? Request a review
