

The DOI matches its Crossref record; 29 of the 29 references it cites were found in a registry or an index.
A critical role for the autophagy gene Atg5 in T cell survival and proliferation
Open accessAbstract
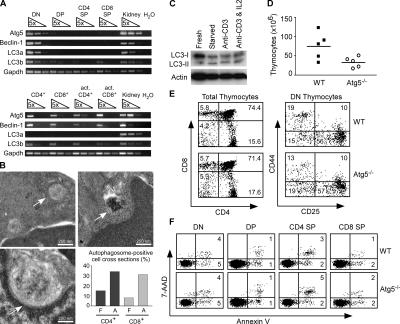
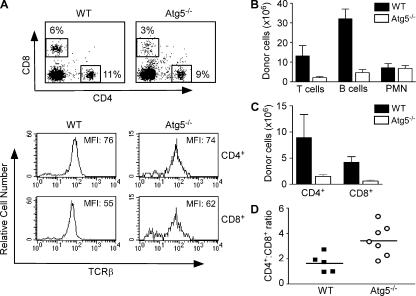
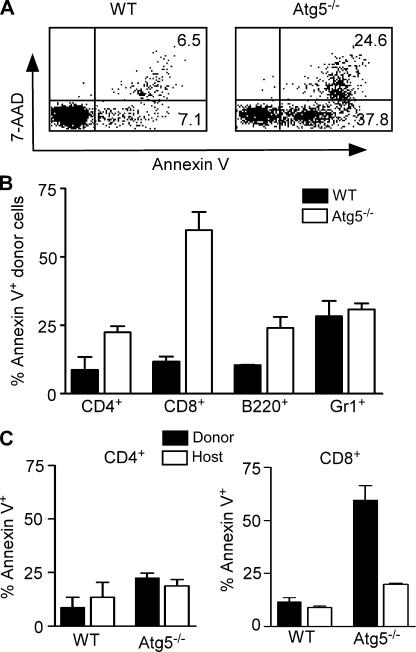
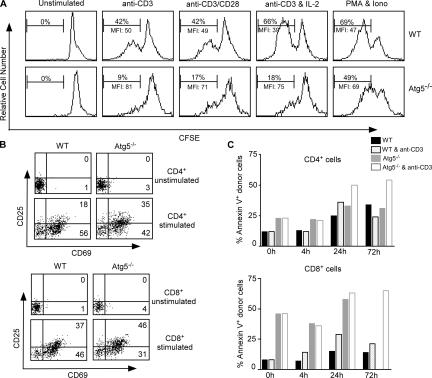
Macroautophagy (hereafter referred to as autophagy) is a well-conserved intracellular degradation process. Recent studies examining cells lacking the autophagy genes Atg5 and Atg7 have demonstrated that autophagy plays essential roles in cell survival during starvation, in innate cell clearance of microbial pathogens, and in neural cell maintenance. However, the role of autophagy in T lymphocyte development and survival is not known. Here, we demonstrate that autophagosomes form in primary mouse T lymphocytes. By generating Atg5−/− chimeric mice, we found that Atg5-deficient T lymphocytes underwent full maturation. However, the numbers of total thymocytes and peripheral T and B lymphocytes were reduced in Atg5 chimeras. In the periphery, Atg5−/− CD8+ T lymphocytes displayed dramatically increased cell death. Furthermore, Atg5−/− CD4+ and CD8+ T cells failed to undergo efficient proliferation after TCR stimulation. These results demonstrate a critical role for Atg5 in multiple aspects of lymphocyte development and function and suggest that autophagy may be essential for both T lymphocyte survival and proliferation.
Overview
The claims and statistics of this paper haven’t been checked yet.
Run the check — free, no account needed. It reads the open-access text and checks the sources it cites.
Integrity signals
Registry
Cites
Statistics
Figures
Verification
Claims the paper makes
The claims and statistics of this paper haven’t been checked yet.
Run the check — free, no account needed. It reads the open-access text and checks the sources it cites.
Claims other papers make about this one
Each is checked against this paper’s own text: does it say what the citing paper says it does?
The source backs part of the claim, not all of it — or backs it for a different population, condition or comparison.
In the citing paper
“In this respect it is noteworthy that some cell-types of the immune system such as dendritic cells 260 seem to tolerate loss of autophagy fairly well, whereas others such as T and B cells are compromised in their development and function after autophagy inhibition.757,758”
From Guidelines for the use and interpretation of assays for monitoring autophagy (2012) · cites this paper as [757]
Experimental — accuracy not yet measuredIn the citing paper
“Proper induction of autophagy has been shown to be important for the maintenance of cellular bioenergetics and sustained T cell viability after activation (25, 26).”
From Fueling Immunity: Insights into Metabolism and Lymphocyte Function (2013) · cites this paper as [26]
Self-check
Percentages, sums and reported differences re-computed from the paper’s own numbers.
The self-check needs the paper’s full text.
Citations
Cites
Repertoires of Autophagy in the Pathogenesis of Ocular Diseases
Li, Y., Jiang, Q. L., Cao, G.-F., Yao, J., & Yan, B. (2015) · Cellular Physiology and Biochemistry · doi:10.1159/000373980 · Cited by 16,351
LC3, a mammalian homologue of yeast Apg8p, is localized in autophagosome membranes after processing.
Kabeya, Y., Mizushima, N., Ueno, T., Yamamoto, A., Kirisako, T., Noda, T., Kominami, E., Ohsumi, Y., & Yoshimori, T. (2000) · The EMBO Journal · doi:10.1093/emboj/19.21.5720 · Cited by 6,605 · cited 2×
“The second pathway results in the conjugation of microtubule-associated protein 1 light chain 3 (LC3; yeast Atg8) to phospholipids for incorporation into the autophagosome membrane (14).”
Self-citationCui, C., Cui, J., Jin, F., Cui, Y., Li, R., Jiang, X., Tian, Y., Wang, R. C., Jiang, P., & Gao, J. (2017) · Cellular Physiology and Biochemistry · doi:10.1159/000479571 · Cited by 5,214
Suppression of basal autophagy in neural cells causes neurodegenerative disease in mice
Hara, T., Nakamura, K., Matsui, M., Yamamoto, A., Nakahara, Y., Suzuki-Migishima, R., Yokoyama, M., Mishima, K., Saito, I., Okano, H., et al. (2006) · Nature · doi:10.1038/nature04724 · Cited by 3,882
Self-citationBcl-2 Antiapoptotic Proteins Inhibit Beclin 1-Dependent Autophagy
Pattingre, S., Tassa, A., Qu, X., Garuti, R., Liang, X. H., Mizushima, N., Packer, M., Schneider, M. D., & Levine, B. (2005) · Cell · doi:10.1016/j.cell.2005.07.002 · Cited by 3,536 · cited 1×
“Bcl-2 has been shown to inhibit autophagosome formation in nutrient-starved yeast and human cancer cell lines (25), yet Bcl-2 expression in Bax−/− Bak−/− mouse embryonic fi broblasts enhances autophagy after etoposide treatment (19).”
Self-citationLoss of autophagy in the central nervous system causes neurodegeneration in mice
Komatsu, M., Waguri, S., Chiba, T., Murata, S., Iwata, J.-I., Tanida, I., Ueno, T., Koike, M., Uchiyama, Y., Kominami, E., et al. (2006) · Nature · doi:10.1038/nature04723 · Cited by 3,500
The role of autophagy during the early neonatal starvation period
Kuma, A., Hatano, M., Matsui, M., Yamamoto, A., Nakaya, H., Yoshimori, T., Ohsumi, Y., Tokuhisa, T., & Mizushima, N. (2004) · Nature · doi:10.1038/nature03029 · Cited by 2,865 · cited 2×
“Although autophagy is important for survival during periods of nutrient deprivation (5), its role in regulating cellular life and death decisions remains largely unknown (for review see reference 15).”
Self-citationGutierrez, M. G., Master, S. S., Singh, S. B., Taylor, G. A., Colombo, M. I., & Deretic, V. (2004) · Cell · doi:10.1016/j.cell.2004.11.038 · Cited by 2,252 · cited 1×
“Furthermore, autophagy contributes to the clearance of intracellular pathogens including group A Streptococcus and Mycobacterium tuberculosis (9, 10).”
Isolation and characterization of autophagy‐defective mutants of Saccharomyces cerevisiae
Tsukada, M., & Ohsumi, Y. (1993) · FEBS Letters · doi:10.1016/0014-5793(93)80398-e · Cited by 1,837 · cited 2×
“Atg5 was fi rst identifi ed in a screen for yeast incapable of surviving nitrogen starvation (2).”
Inhibition of Macroautophagy Triggers Apoptosis
Boya, P., González‐Polo, R. A., Casares, N., Perfettini, J., Dessen, P., Larochette, N., Métivier, D., Meley, D., Souquère, S., Yoshimori, T., et al. (2005) · Molecular and Cellular Biology · doi:10.1128/mcb.25.3.1025-1040.2005 · Cited by 1,669 · cited 1×
“Both the inhibition of apoptosis can induce autophagy (19, 20, 23), and the inhibition of autophagy can induce apoptosis (24).”
Research works printed but not linked: 2
- 2005, Nat. Rev. Mol. Cell Biol., 6, 505
- 2004, Cell Cycle., 3, 1124
Cited by
Sorted by citations
Items 201–300 of 623
Key roles of autophagy in regulating T‐cell function
Botbol, Y. M., Guerrero‐Ros, I., & Macián, F. (2016) · European Journal of Immunology · doi:10.1002/eji.201545955 · Cited by 80
Human Liver Memory CD8+ T Cells Use Autophagy for Tissue Residence
Swadling, L., Pallett, L. J., Diniz, M. O., Baker, J. M., Amin, O. E., Stegmann, K. A., Burton, A. R., Schmidt, N. M., Jeffery-Smith, A., Zakeri, N., et al. (2020) · Cell Reports · doi:10.1016/j.celrep.2019.12.050 · Cited by 80
“…in both blood and liver had higher autophagy levels than Ki67 (cid:1) CD8 + T cells (Figures 2D and 2E) and that recently activated (Figure 2E) and dividing human CD8 + T cells (Figure 2F) showed upregulated autophagy, as has been shown previously in mice (Hubbard et al., 2010; Pua et al., 2007).”
BackgroundAutophagy in the cancer-immunity dialogue
Yamazaki, T., Pedro, J. M. B., Galluzzi, L., Kroemer, G., & Pietrocola, F. (2020) · Advanced Drug Delivery Reviews · doi:10.1016/j.addr.2020.12.003 · Cited by 80
Farfariello, V., Amantini, C., & Santoni, G. (2012) · Journal of Leukocyte Biology · doi:10.1189/jlb.0312123 · Cited by 78
“In lethally irradiated mice repopulated with hematopoietic cells from fetal livers of Atg5 / mice, a failure of CD4 and CD8 T cells to undergo efficient proliferation in response to TCR stimulation was reported; moreover, Atg5 / T cells developed normally in the recipient thymus but failed to repopulate the periphery…”
BackgroundBustos, S. O., Antunes, F., Rangel, M. C., & Chammas, R. J. (2020) · Frontiers in Oncology · doi:10.3389/fonc.2020.606436 · Cited by 79
The role of autophagy in cancer: from molecular mechanism to therapeutic window
Jalali, P., Shahmoradi, A., Samii, A., Mazloomnejad, R., Hatamnejad, M. R., Saeed, A., Namdar, A., & Salehi, Z. (2025) · Frontiers in Immunology · doi:10.3389/fimmu.2025.1528230 · Cited by 89
“…protein levels may have increased in T cells due to increased oxidative stress as well as a potential role for autophagy in the turnover of a number of those proteins and this would also increase the likelihood of cell death, which occurs regardless of functional macroautophagy (160, 169).”
Autophagy and Crohn's Disease: At the Crossroads of Infection,Inflammation, Immunity, and Cancer
Brest, P., Corcelle–Termeau, E., Césaro, A., Chargui, A., Belaïd, A., Klionsky, D. J., Vouret‐Craviari, V., Hébuterne, X., Hofman, P. M., & Mograbi, B. (2010) · Current Molecular Medicine · doi:10.2174/156652410791608252 · Cited by 85
Vuppalapati, K. K., Bouderlique, T., Newton, P. T., Kaminskyy, V. O., Wehtje, H., Ohlsson, C., Zhivotovsky, B., & Chagin, A. S. (2015) · Journal of Bone and Mineral Research · doi:10.1002/jbmr.2575 · Cited by 78
“Similar to our findings, deletion of Atg5 in other systems such as neuronal cells or peripheral T lymphocyte sensitizes the cells to apoptosis.((19,43)) However, this might be a tissue-specific phenomenon because apoptosis was not observed in osteocytes deficient in Atg7,((35)) which are cells of the same mesenchymal…”
ResultAutophagy—from molecular mechanisms to clinical relevance
Lippai, M., & Szatmári, Z. (2016) · Cell Biology and Toxicology · doi:10.1007/s10565-016-9374-5 · Cited by 80
Pei, B., Zhao, M., Miller, B. C., Vela, J. L., Bruinsma, M. W., Virgin, H. W., & Kronenberg, M. (2015) · The Journal of Immunology · doi:10.4049/jimmunol.1402154 · Cited by 74
“Several recent studies have reported that ablation of ATG proteins caused increased apoptosis in T cells (13, 14, 16, 19, 20).”
BackgroundWhang, M. I., Tavares, R. M., Benjamin, D. I., Kattah, M. G., Advincula, R., Nomura, D. K., Debnath, J., Malynn, B. A., & Ma, A. I. (2017) · Immunity · doi:10.1016/j.immuni.2017.02.018 · Cited by 72
“ATG5-deficient T cells proliferated poorly compared to wildtype cells as expected (Pua et al., 2007), and L-cysteine normalized cell division of these cells (Figure 6E).”
The role of autophagy in colitis-associated colorectal cancer
Wu, Y., Yao, J., Xie, J., Liu, Z., Zhou, Y., Pan, H., & Han, W. (2018) · Signal Transduction and Targeted Therapy · doi:10.1038/s41392-018-0031-8 · Cited by 76
Lian, J., Liang, Y., Zhang, H., Lan, M., Ye, Z., Lin, B., Qiu, X., & Zeng, J. (2022) · Frontiers in Immunology · doi:10.3389/fimmu.2022.912279 · Cited by 75
Autophagosomes and human diseases
Beau, I., Mehrpour, M., & Codogno, P. (2011) · The International Journal of Biochemistry & Cell Biology · doi:10.1016/j.biocel.2011.01.006 · Cited by 77
Jiang, T., Chen, X., Ren, X., Yang, J., & Cheng, Y. (2021) · Drug Resistance Updates · doi:10.1016/j.drup.2021.100752 · Cited by 73
Patergnani, S., Missiroli, S., Morciano, G., Perrone, M., Mantovani, C. M., Anania, G., Fiorica, F., Pinton, P., & Giorgi, C. (2021) · Cancers · doi:10.3390/cancers13225622 · Cited by 77
Jia, J., Zhang, H., Shi, Q., Yang, C., Ma, J., Jin, B., Wang, X., He, D., & Guo, P. (2019) · Theranostics · doi:10.7150/thno.33282 · Cited by 71
“However, autophagy is important for the proliferation, survival, and effector functions of various immune cells responsible for tumor inhibition, and autophagy inhibitors would eliminate these cells [34, 35].”
BackgroundTargeting autophagy to fight hematopoietic malignancies
Puissant, A., Robert, G., & Auberger, P. (2010) · Cell Cycle · doi:10.4161/cc.9.17.13048 · Cited by 79
The role of barrier function, autophagy, and cytokines in maintaining intestinal homeostasis
Elshaer, D., & Begun, J. (2016) · Seminars in Cell and Developmental Biology · doi:10.1016/j.semcdb.2016.08.018 · Cited by 72
Lee, W., Sung, M.-S., Lee, E., Yoo, H.-G., Cheon, Y., Chae, H., & Yoo, W. (2014) · Journal of Leukocyte Biology · doi:10.1189/jlb.6a0214-097r · Cited by 70
“It exists in human and murine T lymphocytes [9, 11, 12] and has complex functions in T lymphocyte development, survival, and proliferation [8, 13].”
BackgroundAutophagy in the Regulation of Tissue Differentiation and Homeostasis
Perrotta, C., Cattaneo, M. G., Molteni, R., & Palma, C. D. (2020) · Frontiers in Cell and Developmental Biology · doi:10.3389/fcell.2020.602901 · Cited by 73
“This has been addressed in autophagy gene-deficient T cells, such as cell lacking Atg5, Atg7, beclin-1, or VPS34 (Li et al., 2006; Pua et al., 2007, 2009; Kovacs et al., 2012; Willinger and Flavell, 2012).”
BackgroundAtg5 Is Essential for the Development and Survival of Innate Lymphocytes
O’Sullivan, T. E., Geary, C. D., Weizman, O.-E., Geiger, T. L., Rapp, M., Dorn, G. W., Overholtzer, M., & Sun, J. C.-Y. (2016) · Cell Reports · doi:10.1016/j.celrep.2016.04.082 · Cited by 76
“In the immune system, conditional gene deletion of Atg7, Atg5, or Atg3 during early T cell development (Jia and He, 2011; Pua et al., 2007, 2009), Atg7 or Atg5 in the hematopoietic system (Miller et al., 2008; Mortensen et al., 2010), andAtg5 orAtg7 during invariant natural killer T (iNKT) cell…”
Elevation of autophagy markers in Sjögren syndrome dry eye
Byun, Y., Lee, H. J., Shin, S., & Chung, S. (2017) · Scientific Reports · doi:10.1038/s41598-017-17128-0 · Cited by 70
Autophagy in T Cell Function and Aging
Macián, F. (2019) · Frontiers in Cell and Developmental Biology · doi:10.3389/fcell.2019.00213 · Cited by 69
“This results in increased ROS accumulation, which translates into higher rates of cell death (Pua et al., 2009).”
BackgroundGuidelines for the use and interpretation of assays for monitoring autophagy (3rd edition)
Klionsky, D. J., Abdelmohsen, K., Abe, A., Abedin, J., Abeliovich, H., Acevedo‐Arozena, A., Adachi, H., Adams, C. M., Adams, P. D., Adeli, K., et al. (2016) · Kölner Universitäts PublikationsServer (Universität zu Köln) · doi:10.5167/uzh-131237 · Cited by 69
Harr, M. W., McColl, K. S., Zhong, F., Molitoris, J. K., & Distelhorst, C. (2010) · Autophagy · doi:10.4161/auto.6.7.13290 · Cited by 67
Survival of Effector CD8+ T Cells during Influenza Infection Is Dependent on Autophagy
Schlie, K., Westerback, A., DeVorkin, L., Hughson, L. R. K., Brandon, J. M., MacPherson, S., Gadawski, I., Townsend, K. N., Poon, V. I., Elrick, M. A., et al. (2015) · The Journal of Immunology · doi:10.4049/jimmunol.1402571 · Cited by 68
“(21), we created a novel system whereby mice expressing a Cre recombinase/estrogen receptor fusion protein (CreER) were crossed to the conditional Atg5 knockout mouse (herein denoted as Atg5 and Atg5).”
BackgroundInfluentialSelf-citationGene expression profiles of autophagy-related genes in multiple sclerosis
İğci, M., Baysan, M. S., Yiğiter, R., Ulaşlı, M., Geyik, S., Bayraktar, R., Bozgeyik, İ., Bozgeyi̇k, E., Bayram, A., & Çakmak, E. A. (2016) · Gene · doi:10.1016/j.gene.2016.04.042 · Cited by 70
Merkley, S. D., Chock, C. J., Yang, X. O., Harris, J., & Castillo, E. F. (2018) · Frontiers in Immunology · doi:10.3389/fimmu.2018.02914 · Cited by 68
“However, autophagy’s influence on T cell differentiation and function has remained unclear for many years due to autophagy’s critical role in T cell survival (107, 112, 124, 125).”
BackgroundMechanism of Mitophagy and Its Role in Sepsis Induced Organ Dysfunction: A Review
Zhu, C., Yao, R.-Q., Li, L.-X., Li, P., Xie, J., Wang, J., & Deng, X. (2021) · Frontiers in Cell and Developmental Biology · doi:10.3389/fcell.2021.664896 · Cited by 75
“Impaired autophagy confirmed by silencing ATG7 with siRNA exacerbates TNF (tumor necrosis factor)-induced DNA fragmentation in proximal renal tubular cells and hepatocytes (Pua et al., 2007; Chien et al., 2011).”
BackgroundAutophagy and Autoimmunity Crosstalks
Bhattacharya, A., & Eissa, N. T. (2013) · Frontiers in Immunology · doi:10.3389/fimmu.2013.00088 · Cited by 68
“…mature T cells showed defective Endoplasmic reticulum (ER) homeostasis and mitochondrial clearance and, consequently, an elevated levels of ROS, which might serve as one of the potential links between the autophagy and apoptotic pathways (Pua et al., 2007; Jia and He, 2011; Jia et al., 2011).”
BackgroundInfluentialMitophagy in hematopoietic stem cells
Joshi, A., & Kundu, M. (2013) · Autophagy · doi:10.4161/auto.26681 · Cited by 72
Autophagy in blood cancers: biological role and therapeutic implications
Nencioni, A., Cea, M., Montecucco, F., Longo, V. D., Patrone, F., Carella, A. M., Holyoake, T. L., & Helgason, G. V. (2013) · Haematologica · doi:10.3324/haematol.2012.079061 · Cited by 67
“Pua and colleagues found that Atg5-deficient T lymphocytes undergo full maturation, but the numbers of total thymocytes and peripheral T and B lymphocytes are reduced in Atg5 chimeras.(35) In peripheral lymphoid organs, Atg5 CD8 T lymphocytes show increased cell death.”
BackgroundAdaptive immunity at the crossroads of autophagy and metabolism
Metur, S. P., & Klionsky, D. J. (2021) · Cellular and Molecular Immunology · doi:10.1038/s41423-021-00662-3 · Cited by 67
Reggiori, F., Komatsu, M., Finley, K. D., & Simonsen, A. (2012) · International Journal of Cell Biology · doi:10.1155/2012/156272 · Cited by 68
“Atg5 or Atg7 deleted T cells fail to reduce their mitochondrial content resulting in increased ROS production as well as an imbalance in pro- and antiapoptotic protein expression [175–177].”
BackgroundExpression pattern and functions of autophagy-related geneatg5in zebrafish organogenesis
Hu, Z., Zhang, J., & Zhang, Q. (2011) · Autophagy · doi:10.4161/auto.7.12.18040 · Cited by 65
“Atg5 also benefited T-cell survival and proliferation.(19) Overexpression of atg5 in T cells may contribute to inflammatory demyelination in multiple sclerosis.”
BackgroundAutophagy as an important process in gut homeostasis and Crohn’s disease pathogenesis
Xavier, R. J., Huett, A. S., & Rioux, J. D. (2008) · Gut · doi:10.1136/gut.2007.134254 · Cited by 67
SLAMF1 regulation of chemotaxis and autophagy determines CLL patient response
Bologna, C., Buonincontri, R., Serra, S., Vaisitti, T., Audrito, V., Brusa, D., Pagnani, A., Coscia, M., D'Arena, G. F., Mereu, E., et al. (2015) · Journal of Clinical Investigation · doi:10.1172/jci83013 · Cited by 68
Autophagy and immunological aberrations in systemic lupus erythematosus
Qi, Y., Zhou, S., & Zhang, H. (2019) · European Journal of Immunology · doi:10.1002/eji.201847679 · Cited by 67
The contribution of autophagy to lymphocyte survival and homeostasis
McLeod, I. X., Jia, W., & He, Y.-W. (2012) · Immunological Reviews · doi:10.1111/j.1600-065x.2012.01143.x · Cited by 65
“Although the numbers of both thymocytes and peripheral T lymphocytes were reduced by as much as 80% in Vps34f ⁄ fLck-cre mice and the survival of these T lymphocytes was severely impaired, they showed little similarity to autophagy-deficient (Atg3-, Atg5-, or Atg7-conditionally deleted) T cells (20, 32, 58).”
BackgroundInfluentialSelf-citationMetabolic regulation of organelle homeostasis in lupus T cells
Caza, T. N., Talabér, G., & Perl, A. (2012) · Clinical Immunology · doi:10.1016/j.clim.2012.07.001 · Cited by 65
“Deficiency of autophagic proteins in knockout mice results in reduced intrathymic development of T cells (Atg6, [128]), impairment of T cell survival and proliferation (Atg5, [129]), defective activationinduced effector cytokine production upon activation (Atg7, [130]), and exaggerated T cell apoptosis upon stimulatio…”
Onnis, A., Cianfanelli, V., Cassioli, C., Samardžić, D., Pelicci, P. G., Cecconi, F., & Baldari, C. T. (2018) · Autophagy · doi:10.1080/15548627.2018.1505153 · Cited by 61
Cross talk between autophagy and oncogenic signaling pathways and implications for cancer therapy
Zada, S., Hwang, J. S., Ahmed, M., Lai, T. H., Pham, T. M., Elashkar, O., & Kim, D. R. (2021) · Biochimica et Biophysica Acta (BBA) - Reviews on Cancer · doi:10.1016/j.bbcan.2021.188565 · Cited by 65
Pham, D. L., Kim, S., Losol, P., Yang, E.-M., Shin, Y. S., Ye, Y., & Park, H. (2015) · The Korean Journal of Internal Medicine · doi:10.3904/kjim.2014.390 · Cited by 63
Activation-induced autophagy is preserved in CD4+ T-cells in familial longevity
Raz, Y., Guerrero-Ros, I., Maier, A., Slagboom, P. E., Atzmon, G., Barzilai, N., & Macian, F. (2017) · The Journals of Gerontology: Series A · doi:10.1093/gerona/glx020 · Cited by 61
Identifying key barriers in cationic polymer gene delivery to human T cells
Olden, B. R., Cheng, E. L., Cheng, Y., & Pun, S. H. (2018) · Biomaterials Science · doi:10.1039/c8bm01262h · Cited by 63
Why Sick Cells Produce Tumors: The Protective Role of Autophagy
Mathew, R., & White, E. (2007) · Autophagy · doi:10.4161/auto.4605 · Cited by 61
D-galactose induces necroptotic cell death in neuroblastoma cell lines
Li, N., He, Y., Wang, L., Mo, C., Zhang, J., Zhang, W., Li, J., Liao, Z., Tang, X., & Xiao, H. (2011) · Journal of Cellular Biochemistry · doi:10.1002/jcb.23314 · Cited by 61
“Increased distribution of microtubule associated protein light chain 3 (LC3) in lysosome membrane has been used as a marker of activated autophagy [Kabeya et al., 2000], and Atg-family proteins and TIGAR are known functionally necessary for autophagy [Pua et al., 2007].”
BackgroundSelf-citationAutophagy and the regulation of the immune response
Valdor, R., & Macián, F. (2012) · Pharmacological Research · doi:10.1016/j.phrs.2012.10.003 · Cited by 64
“T cells deficient in Atg7 fail to increase ATP generation in response to TCR and CD28 engagement [98], which could explain the decreased proliferative responses reported in macroautophagy-deficient T cells [89, 98].”
BackgroundInfluentialAutophagy, Metabolic Disease, and Pathogenesis of Heart Dysfunction
Wang, F., Jia, J., & Rodrigues, B. B. (2017) · Canadian Journal of Cardiology · doi:10.1016/j.cjca.2017.01.002 · Cited by 62
T-Cell Autophagy Deficiency Increases Mortality and Suppresses Immune Responses after Sepsis
Lin, C., Lo, S. J., Hsu, C., Hsieh, C.-H., Chang, Y.-F., Hou, B.-S., Kao, Y. H., Lin, C.-C., Yu, M., Yuan, S. F., et al. (2014) · PLoS ONE · doi:10.1371/journal.pone.0102066 · Cited by 61
Autophagy and T cell metabolism
Dowling, S. D., & Macián, F. (2018) · Cancer Letters · doi:10.1016/j.canlet.2018.01.033 · Cited by 59
“apoptosis, marked by greater caspase-9 expression [6, 78, 80].”
CD4 T cell autophagy is integral to memory maintenance
Murera, D., Arbogast, F., Arnold, J., Bouis, D., Muller, S., & Gros, F. (2018) · Scientific Reports · doi:10.1038/s41598-018-23993-0 · Cited by 60
Targeting Autophagy to Treat Cancer: Challenges and Opportunities
Lim, J., & Murthy, A. (2020) · Frontiers in Pharmacology · doi:10.3389/fphar.2020.590344 · Cited by 61
Autophagy in Immunity Against Intracellular Bacteria
Huang, J., & Brumell, J. H. (2009) · Current topics in microbiology and immunology · doi:10.1007/978-3-642-00302-8_9 · Cited by 62
“Components of autophagy are also critical for T and B lymphocyte proliferation and death (Pua et al. 2007; Miller et al. 2008) (see the chapter by Pua and He in this volume).”
BackgroundBotbol, Y. M., Patel, B., & Macián, F. (2015) · Autophagy · doi:10.1080/15548627.2015.1089374 · Cited by 59
“populations it is likely that autophagy represents one of the cytokine-activated mechanisms that underlie their prosurvival activity.(23,24,37) Recently, it has also been shown that memory CD8C T-cell generation requires autophagy.”
BackgroundAutophagy pathways in autoimmune diseases
Keller, C. W., Adamopoulos, I. E., & Lünemann, J. D. (2023) · Journal of Autoimmunity · doi:10.1016/j.jaut.2023.103030 · Cited by 58
“Leaving thymic development largely unperturbed, cell-specific abrogation of autophagy has been shown to impede efficient proliferation upon TCR ligation in T lymphocyte subsets [64].”
BackgroundAutophagy and apoptosis in planarians
González‐Estévez, C., & Saló, E. (2010) · APOPTOSIS · doi:10.1007/s10495-009-0445-4 · Cited by 56
“Indeed, neuron specific knock-out of the autophagy genes Atg5 or Atg7 causes neurodegeneration in mice [95, 96] and moreover, cell death is activated when Atg5 is specifically knocked out in T-cells [97].”
BackgroundMa, D., Wu, Z., Zhao, X., Zhu, X., An, Q., Wang, Y., Zhao, J., Su, Y., Yang, B., Xu, K., et al. (2023) · Inflammopharmacology · doi:10.1007/s10787-023-01189-x · Cited by 57
“1 3 and He 2011), ATG5 (Pua et al. 2007), and ATG7 (Jia et al.”
Pharmacological regulators of autophagy and their link with modulators of lupus disease
Gros, F., & Muller, S. (2014) · British Journal of Pharmacology · doi:10.1111/bph.12792 · Cited by 60
“Chimeric mice reconstituted with Atg5–/– bone marrow (Pua et al., 2007) and conditional deletion of essential autophagy genes Atg5 (Stephenson et al., 2009), Atg7 (Pua et al., 2009; Jia and He, 2011), Atg3 (Jia and He, 2011) showed that macroautophagy is critical to the survival of peripheral T…”
BackgroundDas, M., Karnam, A., Victor, E. S., Gilardin, L., Bhatt, B., Sharma, V. K., Rambabu, N., Patil, V., Lecerf, M., Käsermann, F., et al. (2020) · Cell Death and Disease · doi:10.1038/s41419-020-2249-y · Cited by 63
The inducible role of autophagy in cell death: emerging evidence and future perspectives
Huang, X., Yan, H., Xu, Z., Yang, B., Luo, P., & He, Q. (2025) · Cell Communication and Signaling · doi:10.1186/s12964-025-02135-w · Cited by 64
“Finally, autophagy is required for the survival and proliferation of T lymphocytes [171], and inhibition of autophagy in hepatocytes causes the accumulation of lipid droplets, which ultimately leads to the depletion of CD4 + T cells [164, 172].”
Alessandri, C., Ciccia, F., Priori, R., Astorri, E., Guggino, G., Alessandro, R., Rizzo, A. G., Conti, F., Minniti, A., Barbati, C., et al. (2017) · Arthritis Research & Therapy · doi:10.1186/s13075-017-1385-y · Cited by 55
“T lymphocytes displayed increased cell death, and atg5/ CD4 and CD8 T cells demonstrated deficient proliferation after T cell receptor stimulation [15]; atg7-deficient T lymphocytes had increased cell death and also showed expanded mitochondria, expanded ER content, and altered calcium flux [33].”
BackgroundYang, X. (2007) · Frontiers in bioscience · doi:10.2741/2775 · Cited by 55
“A recent report showed that in the autophagy gene Atg5 deficient mice, CD4+ and CD8+ T cells fail to undergo efficient proliferation after TCR stimulation, suggesting a critical role for Atg5 in T cell proliferation and survival (265).”
BackgroundAutophagy in Multiple Sclerosis: Two Sides of the Same Coin
Misrielal, C., Mauthe, M., Reggiori, F., & Eggen, B. J. L. (2020) · Frontiers in Cellular Neuroscience · doi:10.3389/fncel.2020.603710 · Cited by 56
“…either Atg5- or Atg7-deficient CD4+ and CD8+ T-cells showed indeed multiple defects, including reduced survival and a defect in T-cell proliferation in response to antigen stimulation (Pua et al., 2007; Alirezaei et al., 2009; Keller and Lünemann, 2017; Paunovic et al., 2018; Yin et al., 2018).”
BackgroundMitochondrial ATP transporter Ant2 depletion impairs erythropoiesis and B lymphopoiesis
Cho, J., Seo, J.-W., Lim, C. H., Yang, L., Shiratsuchi, T., Lee, M., Chowdhury, R. R., Kasahara, H., Kim, J.-S., Oh, S. P., et al. (2015) · Cell Death and Differentiation · doi:10.1038/cdd.2014.230 · Cited by 56
“Antibodies used in the study were against: Ter119 (11-5921), CD71 (17-0711), B220 (11-0452, 48-0452), CD43 (12-0439), IgM (17-5790), IgD (11-5993), CD4 (17-0041), and CD8 (11-0081) (eBioscience, San Diego, CA, USA); c-Kit (553355) and Sca1 (557405) (BD Pharmingen, San Jose, CA, USA).”
Bata, N., & Cosford, N. D. P. (2021) · ACS Pharmacology & Translational Science · doi:10.1021/acsptsci.1c00130 · Cited by 60
Macroautophagy, endogenous MHC II loading and T cell selection: the benefits of breaking the rules
Nedjic, J., Aichinger, M., Mizushima, N., & Klein, L. (2009) · Current Opinion in Immunology · doi:10.1016/j.coi.2009.01.013 · Cited by 56
Self-citationMocholí, E., Dowling, S. D., Botbol, Y. M., Gruber, R. C., Ray, A. K., Vastert, S. J., Shafit‐Zagardo, B., Coffer, P. J., & Macián, F. (2018) · Cell Reports · doi:10.1016/j.celrep.2018.06.065 · Cited by 52
Proteasome inhibition drastically but reversibly impairs murine lymphocyte development
Maseda, D., Meister, S., Neubert, K., i, M. H., & Voll, R. E. (2008) · Cell Death and Differentiation · doi:10.1038/sj.cdd.4402297 · Cited by 53
“These mechanisms may induce apoptosis in a thymocyte-autonomous manner by enhancing autophagy, which is a critical process of cell death especially in the thymus”
BackgroundArsov, I., Li, X., Matthews, G., Coradin, J. H., Hartmann, B., Simon, A. K., Sealfon, S. C., & Yue, Z. (2008) · Cell Death and Differentiation · doi:10.1038/cdd.2008.59 · Cited by 53
“Recent evidence suggests that a form of nonapoptotic cell death, termed autophagy, could play a significant role in lymphocyte homeostasis.(1,2) Autophagy is an”
BackgroundCell-Intrinsic Roles for Autophagy in Modulating CD4 T Cell Functions
Jacquin, É., & Apétoh, L. (2018) · Frontiers in Immunology · doi:10.3389/fimmu.2018.01023 · Cited by 51
“However, the normal levels of membrane TCR and activation markers CD69 and CD25 indicated that autophagy inhibition does not alter TCR-driven activation of CD4 T cells (18).”
BackgroundResultInfluentialInfluence of Atg5 Mutation in SLE Depends on Functional IL-10 Genotype
López, P., Alonso‐Perez, E., Rodríguez‐Carrio, J., & Suárez, A. (2013) · PLoS ONE · doi:10.1371/journal.pone.0078756 · Cited by 52
van Loosdregt, J., Spreafico, R., Rossetti, M. M., Prakken, B. J., Lotz, M., & Albani, S. (2013) · Journal of Allergy and Clinical Immunology · doi:10.1016/j.jaci.2013.02.026 · Cited by 51
Autophagy: from basic science to clinical application
Limbergen, J. V., Stevens, C., Nimmo, E., Wilson, D., & Satsangi, J. (2009) · Mucosal Immunology · doi:10.1038/mi.2009.20 · Cited by 53
Pathophysiological Role of Autophagy: Lesson from Autophagy-Deficient Mouse Models
Ichimura, Y., & Komatsu, M. (2011) · EXPERIMENTAL ANIMALS · doi:10.1538/expanim.60.329 · Cited by 50
“species (ROS) production as well as an imbalance in pro- and antiapoptotic protein expression [84, 85, 101].”
BackgroundFeng, C. G., Zheng, L., Lenardo, M. J., & Sher, A. (2009) · Autophagy · doi:10.4161/auto.5.2.7445 · Cited by 50
miR-142-3p regulates autophagy by targeting ATG16L1 in thymic-derived regulatory T cell (tTreg)
Lu, Y., Gao, J., Zhang, S., Gu, J., Lu, H., Xia, Y., Zhu, Q., Qian, X., Zhang, F., Zhang, C., et al. (2018) · Cell Death and Disease · doi:10.1038/s41419-018-0298-2 · Cited by 52
Therapeutic Modulation of Autophagy in Leukaemia and Lymphoma
Djavaheri‐Mergny, M., Giuriato, S., Tschan, M. P., & Humbert, M. (2019) · Cells · doi:10.3390/cells8020103 · Cited by 52
“Experiments in chimeric mice generated by transplantation of Atg5 or Atg7 knockout foetal liver cells into lethally irradiated congenic host demonstrated that mice with impaired autophagy show normal T cell development but cannot fully reconstitute the lymphoid compartment due to a drastic increase in cell death in th…”
BackgroundCalcium Homeostasis in the Control of Mitophagy
Perrone, M., Patergnani, S., Mambro, T. D., Palumbo, L., Wieckowski, M. R., Giorgi, C., & Pinton, P. (2022) · Antioxidants and Redox Signaling · doi:10.1089/ars.2022.0122 · Cited by 52
Autophagy in CD4+ T-cell immunity and tolerance
Lünemann, J. D., & Münz, C. (2008) · Cell Death and Differentiation · doi:10.1038/cdd.2008.113 · Cited by 51
Recent insights on the putative role of autophagy in autoimmune diseases
Gianchecchi, E., Delfino, D. V., & Fierabracci, A. (2013) · Autoimmunity Reviews · doi:10.1016/j.autrev.2013.10.007 · Cited by 50
Lymphocyte Autophagy in Homeostasis, Activation, and Inflammatory Diseases
Arbogast, F., & Gros, F. (2018) · Frontiers in Immunology · doi:10.3389/fimmu.2018.01801 · Cited by 51
“Consequently, ROS are more abundantly produced and are responsible for thymocyte apoptosis, leading to a decrease in thymic and peripheral populations (39).”
BackgroundResultInfluentialChen, M., Hu, Y., Hou, Y., Li, M., Tan, L., Chen, M., Geng, W., Tao, B., Jiang, H., Luo, Z. Y., et al. (2021) · Chemical Engineering Journal · doi:10.1016/j.cej.2021.130982 · Cited by 49
Corrado, M., Samardžić, D., Giacomello, M., Rana, N., Pearce, E. L., & Scorrano, L. (2021) · Cell Death and Differentiation · doi:10.1038/s41418-021-00747-6 · Cited by 49
A novel and functional variant within the ATG5 gene promoter in sporadic Parkinson's disease
Chen, D., Zhu, C., Wang, X., Feng, X., Pang, S., Huang, W., Hawley, R. G., & Yan, B. (2013) · Neuroscience Letters · doi:10.1016/j.neulet.2013.01.044 · Cited by 48
How Bacteria-Induced Apoptosis of Intestinal Epithelial Cells Contributes to Mucosal Inflammation
Hausmann, M. (2010) · International Journal of Inflammation · doi:10.4061/2010/574568 · Cited by 48
“Mutations in genes affecting the formation of autophagosomes [66, 67] or mutations in genes affecting lysosomal clearance of autophagosomes [68] are associated with increased frequency of apoptosis (reviewed in [65]).”
BackgroundInvolvement of autophagy in NK cell development and function
López‐Soto, A., Pedro, J. M. B., Kroemer, G., Galluzzi, L., & Gonzalez, S. R. (2017) · Autophagy · doi:10.1080/15548627.2016.1274486 · Cited by 46
Autophagy During Vertebrate Development
Aburto, M. R., Hurlé, J. M., Varela‐Nieto, I., & Magariños, M. (2012) · Cells · doi:10.3390/cells1030428 · Cited by 46
“generated mouse chimeras by transferring fetal liver cells from Atg5 mice after irradiation [111].”
BackgroundTorres, A., Luke, J. D., Kullas, A. L., Kapilashrami, K., Botbol, Y. M., Koller, A. A., Tonge, P. J., Chen, E. I., Macián, F., & van der Velden, A. W. M. (2015) · Journal of Leukocyte Biology · doi:10.1189/jlb.4a0615-252r · Cited by 47
“Consistent with published evidence [40, 41], naı̈ve T cells exhibited a basal level of LC3-II expression and turnover that increased considerably following TCR engagement (Fig.”
ResultIs Autophagy Involved in the Diverse Effects of Antidepressants?
Rein, T. (2019) · Cells · doi:10.3390/cells8010044 · Cited by 45
Kusama, Y., Sato, K., Kimura, N., Mitamura, J., Ohdaira, H., & Yoshida, K. (2009) · APOPTOSIS · doi:10.1007/s10495-009-0390-2 · Cited by 50
“Additionally, Atg5 has been shown to be required for T and B lymphocyte survival during development [46, 47].”
BackgroundLi, B., Wang, F., Schall, N., & Muller, S. (2018) · Journal of Autoimmunity · doi:10.1016/j.jaut.2018.02.005 · Cited by 43
Fang, Q., & Chen, H. (2020) · Frontiers in Oncology · doi:10.3389/fonc.2020.591356 · Cited by 41
“Other studies indicate that autophagy promotes the apoptosis of T cells (43).”
BackgroundAutophagy appears during the development of the mouse lower first molar
Yang, J., Zhu, L., Yuan, G., Chen, Y., Zhang, L., Zhang, L., & Chen, Z. (2012) · Histochemistry and Cell Biology · doi:10.1007/s00418-012-1016-2 · Cited by 43
“reported that the proliferation of CD4 and CD8 T cells was impaired upon TCR stimulation when Atg5 was deficient (Pua et al. 2007).”
BackgroundCastellazzi, M., Patergnani, S., Donadio, M., Giorgi, C., Bonora, M., Fainardi, E., Casetta, I., Granieri, E., Pugliatti, M., & Pinton, P. (2019) · Journal of Neuroinflammation · doi:10.1186/s12974-019-1526-0 · Cited by 44
Links between Autophagy, Innate Immunity, Inflammation and Crohn’s Disease
Deretic, V. P. (2009) · Digestive Diseases · doi:10.1159/000228557 · Cited by 42
When Cells Suffocate: Autophagy in Cancer and Immune Cells under Low Oxygen
Schlie, K., Spowart, J. E., Hughson, L. R. K., Townsend, K. N., & Lum, J. J. (2011) · International Journal of Cell Biology · doi:10.1155/2011/470597 · Cited by 45
“Support for this idea comes from the finding that T cell stimulation by phorbol myristate acetate (PMA) and Ionomycin, which bypasses T cell receptor signalling, results in almost normal proliferation rates of autophagyincompetent T cells [91].”
BackgroundComputational modeling of heterogeneity and function of CD4+ T cells
Carbo, A., Hontecillas, R., Andrew, T., Eden, K. B., Mei, Y., Hoops, S., & Bassaganya-Riera, J. (2014) · Frontiers in Cell and Developmental Biology · doi:10.3389/fcell.2014.00031 · Cited by 43
“Furthermore, autophagy has been found to be essential for T cell survival and proliferation (Pua et al., 2007).”
BackgroundNrf2 promotes progression of non-small cell lung cancer through activating autophagy
Wang, J., Liu, Z., Hu, T., Han, L., Yu, S., Yao, Y., Ruan, Z., Tian, T., Huang, T., Wang, M., et al. (2017) · Cell Cycle · doi:10.1080/15384101.2017.1312224 · Cited by 40
Metadata
- Authors
- Pua, H. H., Dzhagalov, I., Chuck, M., Mizushima, N., & He, Y.-W.
- Affiliations
- Duke Medical Center (US)
- Japan Science and Technology Agency (JP)
- Venue
- The Journal of Experimental Medicine
- Publisher
- Rockefeller University Press
- Published
- 2006-12-26
- Volume
- 204
- Issue
- 1
- Pages
- 25-31
- ISSN
- 0022-1007 (ISSN-L)
- 1540-9538
- PMC
- PMC2118420
- OpenAlex
- W2154663531
- Cited by
- 622
- References
- 29
- Citations by year
- 2026: 10 · 2025: 23 · 2024: 17 · 2023: 23 · 2022: 25 · 2021: 31 · 2020: 34 · 2019: 35 · 2018: 34 · 2017: 39 · 2016: 45 · 2015: 35 · 2014: 34 · 2013: 42 · 2012: 55
- FWCI
- 19.36
- Type
- journal article
- Language
- en
- Open access
- bronze
- doi.org
- Locations
- The Journal of Experimental Medicine (publishedVersion)
- Europe PMC (PubMed Central) (publishedVersion, cc-by-nc-sa)
- PubMed Central (publishedVersion, cc-by-nc-sa)
- PubMed (publishedVersion)
- Funders
- National Institutes of Health
- National Cancer Institute (R01CA092123, CA92123)
- National Institute of Diabetes and Digestive and Kidney Diseases (P30DK040561)
- Topics
- Life Sciences › Biochemistry, Genetics and Molecular Biology › Cell Biology › Autophagy in Disease and Therapy
- Life Sciences › Immunology and Microbiology › Immunology › T-cell and B-cell Immunology
- Life Sciences › Immunology and Microbiology › Immunology › Phagocytosis and Immune Regulation
- Keywords
- autophagy, ATG5, ATG7, T cell proliferation, T cell development, autophagosomes, CD8+ T cells, CD4+ T cells, T cell receptor stimulation, lymphocyte apoptosis, chimeric mice
- MeSH terms
- Autophagy-Related Protein 5, Animals, Autophagy, Base Sequence, Cell Differentiation, Cell Survival, Female, Mice, Inbred C57BL, Microtubule-Associated Proteins, Pregnancy, Receptors, Antigen, T-Cell, T-Lymphocytes, Fetal Tissue Transplantation, DNA Primers, Transplantation Chimera, Mice, Knockout, Hematopoietic Stem Cell Transplantation, CD8-Positive T-Lymphocytes, Cell Proliferation, Mice
About these checks
Registry, retraction, Cites and statistics results are computed, not judged, with one exception: a printed reference that no index lists is read once by a model before it counts as a citation error. Claims are extracted by a model and kept only when their quote appears verbatim in the text; each cited source is then checked, with a model’s help, for whether it says what the claim relies on. Those verdicts can be wrong — read the claim’s quote and the cited source before relying on one.
Statistics and arithmetic are recomputed, not judged.
Confidence bands are shown only for fields calibrated on our annotated test set. None is calibrated yet, so no band is shown.
What counts as a claim ›How we measure confidence ›How we check this ›
Are you an author, or do you see a problem with this page? Request a review
