

IL-25 regulates Th17 function in autoimmune inflammation
Open accessThe DOI matches its Crossref record; 59 of the 59 references it cites were found in a registry or an index.
Abstract
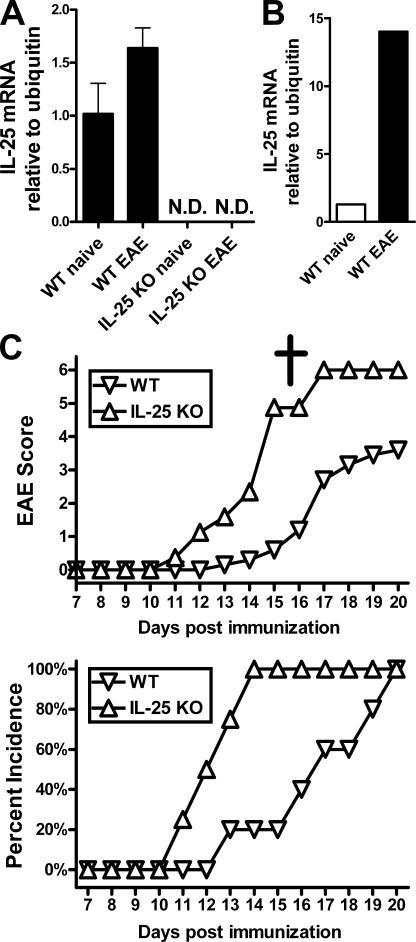
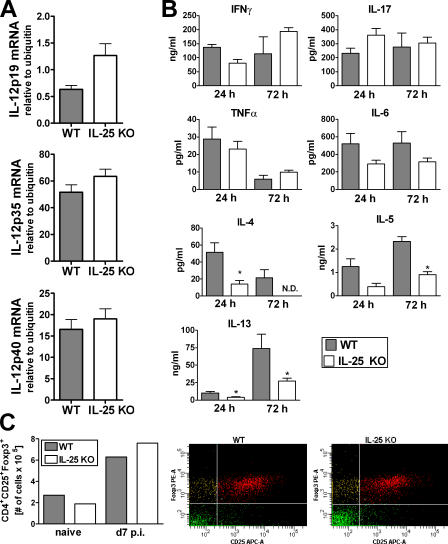
Interleukin (IL)-25 is a member of the IL-17 family of cytokines. However, unlike the other members of this family, IL-25 promotes T helper (Th) 2 responses. We now show that IL-25 also regulates the development of autoimmune inflammation mediated by IL-17-producing T cells. We have generated IL-25-deficient (il25-/-) mice and found that they are highly susceptible to experimental autoimmune encephalomyelitis (EAE). The accelerated disease in the il25-/- mice is associated with an increase of IL-23 in the periphery and a subsequent increase in the number of inflammatory IL-17-, IFNgamma-, and TNF-producing T cells that invade the central nervous system. Neutralization of IL-17 but not IFNgamma in il25-/- mice prevented EAE, suggesting that IL-17 is a major disease-promoting factor. IL-25 treatment at several time points during a relapse-remitting model or chronic model of EAE completely suppressed disease. IL-25 treatment induced elevated production of IL-13, which is required for suppression of Th17 responses by direct inhibition of IL-23, IL-1beta, and IL-6 expression in activated dendritic cells. Thus, IL-25 and IL-17, being members of the same cytokine family, play opposing roles in the pathogenesis of organ-specific autoimmunity.
Overview
The claims and statistics of this paper haven’t been checked yet.
Free: it reads the open-access text and checks the first 5 claims that cite a source we can check. Create a free account to check every claim.
Integrity signals
Registry
Cites
Statistics
Figures



Verification
Claims the paper makes
The claims and statistics of this paper haven’t been checked yet.
Free: it reads the open-access text and checks the first 5 claims that cite a source we can check. Create a free account to check every claim.
Claims other papers make about this one
Each is checked against this paper’s own text: does it say what the citing paper says it does?
The cited source says what the claim attributes to it.
In the citing paper
“IL-25 can also inhibit autoimmunity mediated by Th17 cells.”
From The IL-17 Family of Cytokines in Health and Disease (2019) · cites this paper as Kleinschek et al., 2007
In the citing paper
“IL-25 treatment elevated production of IL-13 and suppressed expression of IL-1, IL-6, and IL-23 by activated dendritic cells”
From The IL-17 Family of Cytokines in Health and Disease (2019) · cites this paper as Kleinschek et al., 2007
Self-check
Percentages, sums and reported differences re-computed from the paper’s own numbers.
The self-check needs the paper’s full text.
Citations
Cites
Bettelli, E., Carrier, Y., Gao, W., Korn, T., Strom, T. B., Oukka, M., Weiner, H. L., & Kuchroo, V. K. (2006) · Nature · doi:10.1038/nature04753 · Cited by 6,992
Alternative activation of macrophages
Gordon, S. (2003) · Nature Reviews Immunology · doi:10.1038/nri978 · Cited by 6,189 · cited 1×
“Consistent with pervious reports (55, 56), we observed that IL-25 could induce IL-13 mRNA expression in cultured DCs (unpublished data).”
ResultIvanov, I. I., McKenzie, B. S., Zhou, L., Tadokoro, C. E., Lepelley, A., Lafaille, J. J., Cua, D. J., & Littman, D. R. (2006) · Cell · doi:10.1016/j.cell.2006.07.035 · Cited by 5,145
Self-citationHarrington, L. E., Hatton, R. D., Mangan, P. R., Turner, H., Murphy, T. L., Murphy, K. M., & Weaver, C. T. (2005) · Nature Immunology · doi:10.1038/ni1254 · Cited by 4,742 · cited 3×
“Recent in vitro studies have suggested that Th17 cells are also negatively regulated by IL-4 signaling pathways (21, 22).”
BackgroundResultA distinct lineage of CD4 T cells regulates tissue inflammation by producing interleukin 17
Park, H., Li, Z., Yang, X. O., Chang, S. H., Nurieva, R., Wang, Y.-H., Wang, Y., Hood, L., Zhu, Z., Tian, Q., et al. (2005) · Nature Immunology · doi:10.1038/ni1261 · Cited by 4,265 · cited 3×
“Recent in vitro studies have suggested that Th17 cells are also negatively regulated by IL-4 signaling pathways (21, 22).”
BackgroundResultIL-23 drives a pathogenic T cell population that induces autoimmune inflammation
Langrish, C. L., Chen, Y., Blumenschein, W. M., Mattson, J., Basham, B., Sedgwick, J. D., McClanahan, T., Kastelein, R. A., & Cua, D. J. (2005) · The Journal of Experimental Medicine · doi:10.1084/jem.20041257 · Cited by 4,099 · cited 3×
“In contrast, anti-IFNγ treatment had no eff ect, consistent with studies demonstrating that Th1 cells only play a minor role in EAE (13).”
BackgroundResultSelf-citationVeldhoen, M., Hocking, R. J., Atkins, C. J., Locksley, R. M., & Stockinger, B. (2006) · Immunity · doi:10.1016/j.immuni.2006.01.001 · Cited by 3,605
Transforming growth factor-β induces development of the TH17 lineage
Mangan, P. R., Harrington, L. E., O'Quinn, D. B., Helms, W. S., Bullard, D. C., Elson, C. O., Hatton, R. D., Wahl, S. M., Schoeb, T. R., & Weaver, C. T. (2006) · Nature · doi:10.1038/nature04754 · Cited by 3,087
Cua, D. J., Sherlock, J., Chen, Y., Murphy, C. A., Joyce, B., Seymour, B., Lucian, L., To, W., Kwan, S., Churakova, T., et al. (2003) · Nature · doi:10.1038/nature01355 · Cited by 2,906 · cited 1×
“cyto metric sorting from >100 irradiation bone marrow chimeric mice (11).”
BackgroundSelf-citationInterleukin-17 Family Members and Inflammation
Kolls, J. K., & Lindén, A. (2004) · Immunity · doi:10.1016/j.immuni.2004.08.018 · Cited by 2,372 · cited 1×
“Although IL-25 promotes allergic responses, IL-17A had been characterized to promote chronic infl ammatory responses (9, 10).”
Background
Cited by
Items 301–399 of 399
IL-25 exacerbates autoimmune aortitis in IL-1 receptor antagonist-deficient mice
Yoshizaki, T., Itoh, S., Yamaguchi, S., Numata, T., Nambu, A., Kimura, N., Suto, H., Okumura, K., Sudo, K., Yamaguchi, A., et al. (2019) · Scientific Reports · doi:10.1038/s41598-019-53633-0 · Cited by 9
Forsthuber, T. G., & Ji, N. (2007) · Expert Review of Clinical Immunology · doi:10.1586/1744666x.3.3.251 · Cited by 9
Experimental Insights on the Use of Secukinumab and Magnolol in Acute Respiratory Diseases in Mice
Vicovan, A. G., Petrescu, D. C., Constantinescu, D., Iftimi, E., Cernescu, I. T., Ancuța, C., Caratașu, C., Șorodoc, L., Ceasovschih, A., Solcan, C., et al. (2024) · Biomedicines · doi:10.3390/biomedicines12071538 · Cited by 8
“Besides alternative macrophage activation, elevated production of IL-13 is required for suppression of Th17 responses by direct inhibition of IL-23, IL-1 β , and IL-6 expression in activated dendritic cells [55].”
BackgroundTh17 differentiation is the default program for DPP2‐deficient T‐cell differentiation
Mele, D. A., Sampson, J. F., & Huber, B. T. (2011) · European Journal of Immunology · doi:10.1002/eji.201041157 · Cited by 8
Álvarez-Izquierdo, M., Esteban, J. G., Muñoz-Antolí, C., & Toledo, R. (2020) · Parasites & Vectors · doi:10.1186/s13071-020-04206-y · Cited by 8
Act1-hsp90 heats up TH17 inflammation
Kumar, P., & Kolls, J. K. (2012) · Nature Immunology · doi:10.1038/ni.2498 · Cited by 8
Qiu, Z., Zhou, J.-S., Liu, F., Qin, X., Dai, Y., Ke, Y., Chen, Z., Li, W., Ying, S., & Shen, H. (2017) · PLoS ONE · doi:10.1371/journal.pone.0177334 · Cited by 10
Regulation of Interleukin-17 Production
Dong, W., & Ma, X. (2016) · Advances in experimental medicine and biology · doi:10.1007/978-94-024-0921-5_7 · Cited by 7
Mantani, P. T., Vallejo, J., Ljungcrantz, I., Nilsson, J. Å., Björkbacka, H., & Fredrikson, G. N. (2018) · Human Immunology · doi:10.1016/j.humimm.2018.06.008 · Cited by 7
New Therapeutic Challenges in Autoimmune Diseases
Wha, E. (2012) · InTech eBooks · doi:10.5772/48207 · Cited by 7
Saresella, M., Tortorella, P., Marventano, I., Al‐Daghri, N. M., Piancone, F., Gatti, A., Gironi, M., Caputo, D., Rovaris, M., & Clerici, M. (2013) · European Journal of Inflammation · doi:10.1177/1721727x1301100121 · Cited by 7
López, P. (1988) · Cátedra eBooks · Cited by 27
Lakshmi, G. J., Kotra, S. R., Peravali, J., Kumar, P. N., Surya, K. R., & Rao, K. R. S. S. (2014) · International Journal of Bio-Science and Bio-Technology · doi:10.14257/ijbsbt.2014.6.3.03 · Cited by 6
The expression of IL17RA on sputum macrophages in asthma patients
Nejman‐Gryz, P., Paplińska‐Goryca, M., Proboszcz, M., Grabczak, E. M., Hermanowicz-Salamon, J., & Krenke, R. (2021) · Cytokine · doi:10.1016/j.cyto.2021.155518 · Cited by 6
Moon, C. M., Kim, S. W., Ahn, J. B., Woo, H. J., Che, X., Kim, T. I., Kim, W. H., & Cheon, J. H. (2018) · Inflammatory Bowel Diseases · doi:10.1093/ibd/izy122 · Cited by 7
Les lymphocytes T régulateurs et les lymphocytes Th17 : fonctions physiologiques et pathologiques
Corvaisier, M., & Beauvillain, C. (2010) · Revue Francophone des Laboratoires · doi:10.1016/s1773-035x(10)70607-9 · Cited by 9
IL ‐25 Improves MAFLD by Suppressing the Notch Signalling in Hepatic Macrophages
Zheng, X., Hu, D., Zhang, D., Chen, Y., Wei, J., Xie, B., & Wang, A. (2025) · Liver International · doi:10.1111/liv.70370 · Cited by 6
“IL-25 is also implicated in allergic diseases [10], expressed in the CNS [11] and asthmatic bronchial submucosa [12], and has been shown to promote M2 macrophage differentiation [7], thereby attenuating inflammation in various disease models [7, 13–15].”
Self-citationSerum IL-17F as a biomarker of infection-independent cirrhosis progression
Konstantis, G., Passenberg, M., Guntlisbergen, C., Schütte, A., Jung, B., Nuruzade, N., Seltsam, F., Hoyer, D. P., Best, J., Willuweit, K., et al. (2025) · Frontiers in Immunology · doi:10.3389/fimmu.2025.1671288 · Cited by 5
Factors regulating Th17 cells: a review
Seki, R., & Nishizawa, K. (2016) · Biomedical Research and Clinical Practice · doi:10.15761/brcp.1000122 · Cited by 4
Role of biomarkers and effect of FIP-fve in acute and chronic animal asthma models
Wu, C.-T., Lee, Y.-T., Ku, M., & Lue, K. (2020) · Journal of Microbiology Immunology and Infection · doi:10.1016/j.jmii.2020.07.006 · Cited by 4
A Focus on IL-17 Targeting Treatments in Psoriasis
Fabre, J., Institut Jean Godinot, U., Giustiniani, J., Antonicelli, F. D., Merrouche, Y., Bagot, M., & Bensussan, A. (2016) · Journal of Dermatological Research · doi:10.17554/j.issn.2413-8223.2016.01.10 · Cited by 3
Targeting Interleukin-17 and Th17 in Immune Inflammatory Diseases
Cho, M. R. (2013) · Hanyang Medical Reviews · doi:10.7599/hmr.2013.33.1.17 · Cited by 4
“또한 다른 일원과는 다르게 IL-17E (IL-25) 는 알레르기 반응을 유도하고 Th2 경로의 활성을 유도하며 Th17세 포에 의해 조절되는 염증 모델 내 Th17세포들의 기능을 억제시키 는 항 염증 효과를 가지는 것으로도 알려졌다[21].”
Fuss, I. J., & Strober, W. (2015) · Elsevier eBooks · doi:10.1016/b978-0-12-415847-4.00081-1 · Cited by 3
Immune System, Inflammation, and Essential Fatty Acids and Their Metabolites in Cancer
Das, U. N. (2020) · Springer eBooks · doi:10.1007/978-1-0716-0741-1_3 · Cited by 3
Role of Th17 cell in tissue inflammation and organ-specific autoimmunity
Dalal, R., Sadhu, S., & Awasthi, A. (2021) · Elsevier eBooks · doi:10.1016/b978-0-12-822564-6.00005-7 · Cited by 3
Hussain, A. B., Speight, A., Beck, L. C., Reynolds, N. J., Havelin, A., Ball, S. L., & Lamb, C. A. (2025) · Frontline Gastroenterology · doi:10.1136/flgastro-2025-103327 · Cited by 2
Tuft cells contribute to the pathogenesis of human primary and experimental murine Sjögren's disease
Zhang, J., Zhang, J., Xu, C., Li, J., Liu, L., & Wang, F. (2025) · Journal of Dental Sciences · doi:10.1016/j.jds.2025.10.028 · Cited by 2
“27 In the context of SjD, IL-25 is strongly expressed in salivary glands, where it contributes to disease pathology.”
Multiple Roles and Therapeutic Targets of Tuft Cells in Inflammatory Bowel Disease
Masir, M. N. (2026) · Journal of Gastroenterology and Hepatology · doi:10.1111/jgh.70298 · Cited by 2
Abuhassan, Q., Atoom, A. M., Rekha, M. M., Kanwar, J. B., Bavanilatha, M., Arora, V., Sinha, A., & Khazratov, A. (2026) · Human Immunology · doi:10.1016/j.humimm.2026.111703 · Cited by 2
Elzubeir, A., Patel, M., & Rushbrook, S. (2026) · Autoimmunity Reviews · doi:10.1016/j.autrev.2026.104095 · Cited by 3
Lewko, W. M., & Oldham, R. K. (2009) · Springer eBooks · doi:10.1007/978-90-481-2289-9_8 · Cited by 2
Central Role of Th17 Cells in Adaptive Immune Responses
Padova, F. D., Ryffel, B., & Quesniaux, V. F. J. (2012) · Springer eBooks · doi:10.1007/978-3-0348-0522-3_5 · Cited by 3
IL-25 prevents T cell-mediated neurotoxicity by decreasing LFA-1 expression
Turner, D., Haile, Y. G., & Giuliani, F. (2013) · Journal of Neuroimmunology · doi:10.1016/j.jneuroim.2013.10.006 · Cited by 3
Gut Barrier: Adaptive Immunity
Shea‐Donohue, T. (2018) · Elsevier eBooks · doi:10.1016/b978-0-12-809954-4.00026-8 · Cited by 5
IL-17 and Th17 Cells in Rheumatoid Arthritis and Other Inflammatory Conditions
Miossec, P. (2012) · Springer eBooks · doi:10.1007/978-3-0348-0522-3_17 · Cited by 2
“IL-25 also named IL-17E, a member of the IL-17 family, downregulates Th17 function in autoimmune inflammation [44].”
BackgroundImmune regulation of epithelial cell function: Implications for GI pathologies
Shea‐Donohue, T., Urban, J. F., Notari, L., & Zhao, A. (2009) · International Dairy Journal · doi:10.1016/j.idairyj.2009.11.005 · Cited by 1
How do T h17 cells mediate autoimmune inflammation in the central nervous system?
Korn, T. (2014) · Clinical and Experimental Neuroimmunology · doi:10.1111/cen3.12126 · Cited by 1
“The IL-17RA/B heterodimer is the ligand for IL-25, which has downmodulatory functions.(99) As IL-17A and IL-17F share the same receptor, it is not surprising that both cytokines induce a pro-inflammatory milieu.”
BackgroundT HELPER 17 CELLS IN MULTIPLE SCLEROSIS AND EXPERIMENTAL AUTOIMMUNE ENCEPHALOMYELITIS
Bălașa, R. (2010) · Cited by 1
Garley, M., Jabłońska, E., Dziemiańczyk-Pakieła, D., Antonowicz, B., & Grabowska, S. Z. (2010) · Cited by 2
Targeting Th17 Cells for Therapy of Multiple Sclerosis
Martin, A. J., & Miller, S. D. (2012) · Springer eBooks · doi:10.1007/978-3-0348-0522-3_18 · Cited by 2
MALDI Imaging Technology Application in Neurosciences: From History to Perspectives
Salzet, M., Mériaux, C., Franck, J., Wisztorski, M., & Fournier, I. (2011) · Neuromethods · doi:10.1007/978-1-61779-448-3_11 · Cited by 1
Inflammatory Mediators and the Blood-Brain Barrier
Dorovini‐Zis, K., & Easton, A. (2015) · CRC Press eBooks · doi:10.1201/b18606-10 · Cited by 1
Abe, Y., Nambu, A., Yamaguchi, S., Takamori, A., Suto, H., Hirose, S., Yokosuka, T., Nakae, S., & Sudo, K. (2017) · Biochemistry and Biophysics Reports · doi:10.1016/j.bbrep.2017.08.006 · Cited by 1
“On the other hand, IL-25 is thought to suppress Th1and Th17-associated immune responses by enhancing Th2-type immune responses [12,13].”
BackgroundInterleukin-1 Superfamily and Cancer
Yuzhalin, A. E., & Kutikhin, A. G. (2014) · Elsevier eBooks · doi:10.1016/b978-0-12-801121-8.00002-6 · Cited by 2
Padova, F. D., Ryffel, B., & Quesniaux, V. F. J. (2009) · Birkhäuser Basel eBooks · doi:10.1007/978-3-7643-8681-8_1 · Cited by 1
The Role of PI3K Isoforms in Autoimmune Disease
Ward, S. G. (2022) · Current topics in microbiology and immunology · doi:10.1007/978-3-031-06566-8_14 · Cited by 2
Gene therapy of multiple sclerosis
Furlan, R., Maiorino, C., Gatta, A. T., Ruffini, F., & Martino, G. (2010) · Springer eBooks · doi:10.1007/978-3-0346-0165-8_5 · Cited by 2
“This treatment was associated with elevated production of IL-13, which is required for suppression of Th17 responses by direct inhibition of IL-23, IL-1β, and IL-6 expression in activated dendritic cells [ 26 ].”
BackgroundIL-17 and TH17 Cells in Human Rheumatoid Arthritis
Miossec, P. (2011) · Springer eBooks · doi:10.1007/978-1-4419-9371-7_22 · Cited by 1
O’Sullivan, D. (2012) · Open Access Victoria University of Wellington | Te Herenga Waka (Figshare) · doi:10.26686/wgtn.16997467 · Cited by 2
The role of IL-33 and IL-17 family cytokines in periodontal disease
Awang, R. A. (2014) · Enlighten: Theses (The University of Glasgow) · Cited by 3
Interleukin-4 induced leukocyte differentiation
Ahlfors, H. (2010) · UTUPub (University of Turku) · Cited by 2
Targeting Th17 cells in CNS immune pathology
Martin, A. J., & Miller, S. D. (2009) · Birkhäuser Basel eBooks · doi:10.1007/978-3-7643-8681-8_16
“Perhaps the most attractive quality of IL-25 administration is that it acted both to prevent the onset of EAE and to function therapeutically to diminish ongoing disease [ 18 ].”
BackgroundThe functional biology of IL-25
Saenz, S. A. (2011) · Scholarly Commons (University of Pennsylvania)
Peres, R. S. (2012) · Digital Library of Theses and Dissertations (Universidade de São Paulo) · doi:10.11606/d.17.2012.tde-23042012-100510 · Cited by 1
Interleukin 15 and 17 in Staphylococcus aureus arthritis
Henningsson, L. (2011) · Gothenburg University Publications Electronic Archive (Gothenburg University)
Understanding the Generation and Regulation of IL-4 Producing T Helper 2 Cells
Mearns, H. (2012) · Open Access Victoria University of Wellington | Te Herenga Waka (Figshare) · doi:10.26686/wgtn.17000602
Host-microbe interactions in coxsackievirus infection : Focus on innate immunity
Hühn, M. H. (2010) · Figshare
Production and role of IL-17 and related cytokines in response to respiratory pathogens
MacPherson, A. (2012) · Enlighten: Theses (The University of Glasgow)
The effects of toll-like receptor ligand-activated dendritic cells on human CD4⁺T cell responses
Benwell, R. K. (2008) · MOspace Institutional Repository (University of Missouri) · doi:10.32469/10355/9194
“Unexpectedly, moDCs activated with another viral TLR ligand (TLR7/8 ligand) also induced more balanced Th1/Th2/Th17 CD4+ T cell responses.”
BackgroundInfluentialImunopatologia da encefalomielite auto-imune experimental murina mediada por linfócitos T
Silva, A. K. G., Paula, M. L. D., & Ferreira, A. P. (2009) · LA Referencia (Red Federada de Repositorios Institucionales de Publicaciones Científicas) · Cited by 1
IL-25 and B cells in atherosclerosis
Mantani, P. T. (2014) · Lund University Publications (Lund University)
Chung, K. F., & Williams, A. S. (2011) · Elsevier eBooks · doi:10.1533/9781908818065.117
Th17 cells in organ transplantation
Chen, Y., & Wood, K. J. (2009) · Birkhäuser Basel eBooks · doi:10.1007/978-3-7643-8681-8_11
“There is evidence for extensive cross-regulation between the Th1, Th2 and Th17 pathways (Fig. 2). For example, Th2-produced IL-4 and IL-25 can promote Th2 responses but suppress Th17 function [20, 21 ].”
BackgroundSelf-citationInterleukin-25: A Key Initiator of Type 2 Immune Responses
Nakajima, H., Tamachi, T., & Hirose, K. (2013) · Springer eBooks · doi:10.1007/978-4-431-54442-5_10
Letuve, S. (2010) · Revue française d'allergologie · doi:10.1016/j.reval.2010.02.027
Wege zur Th17-Zelldifferenzierung in vitro
Hiller, J. (2013) · University of Regensburg Publication Server (University of Regensburg) · doi:10.5283/epub.27138
IL-17 and Th17 cells in rheumatoid arthritis
Miossec, P. (2009) · Birkhäuser Basel eBooks · doi:10.1007/978-3-7643-8681-8_15 · Cited by 1
HISTAMINE RECEPTOR H1 SIGNALING IN CENTRAL NERVOUS SYSTEM AUTOIMMMUNE DISEASE AND IMMUNE DEVIATION
Noubade, R. (2008) · ScholarWorks -A service of University of Vermont Libraries (University of Vermont)
Low dose tolerance vaccine platform, reovirus protein sigma 1 and treatment of autoimmunity
Rynda, A. (2008) · Montana State University ScholarWorks (Montana State University)
The Dual Role of Myeloid- Derived Suppressor Cells in Liver Pathologies
Monteleone, G., Fusco, D. D., Cupi, M. L., Figliuzzi, M. M., & Pallone, F. (2014)
FEEDBACK INHIBITION OF IL-17 RECEPTOR SIGNAL TRANSDUCTION
Garg, A. V. (2014) · D-Scholarship@Pitt (University of Pittsburgh)
The Role of IL-25 in Colitis-Associated Colon Cancer and Pulmonary Inflammation
Thelen, T. D. (2016) · ResearchWorks at the University of Washington (University of Washington)
Regulation of Type 2 Immune Responses During Allergic Asthma
Liu, B. (2014) · OhioLink ETD Center (Ohio Library and Information Network)
Peres, R. S. (2017) · Digital Library of Theses and Dissertations (Universidade de São Paulo) · doi:10.11606/t.17.2017.tde-06012017-163133
Florezi, G. P. (2017) · Digital Library of Theses and Dissertations (Universidade de São Paulo) · doi:10.11606/d.23.2017.tde-27112017-131058
Edwards, C. K., Pedler, M. G., Yang, D. F., Fitzpatrick, J. E., Fujita, M., Jonscher, K. R., & Norris, D. A. (2012) · Psoriasis Forum · doi:10.1177/247553031218a00304
Senra, D. F. (2018) · Archive ouverte UNIGE (University of Geneva) · doi:10.13097/archive-ouverte/unige:111509
Bradshaw, G. (2020) · Queensland University of Technology · doi:10.5204/thesis.eprints.180906
Regulation of Immune Responses during Airway Inflammation
Bloodworth, M. H. (2017) · ProQuest Demo Repository
Lack of association between serum IL-25 levels and acute coronary syndrome: a preliminary study
Naderi, N., Farshidi, N., Farshidi, H., Montazerghaem, H., & Rahimzadeh, M. (2021) · Kardiologiia · doi:10.18087/cardio.2021.4.n1497
“IL-25 negatively regulates the development of Th17-mediated autoimmune diseases [13].”
BackgroundMucosal defense mechanisms against amebic colitis
Noor, Z. (2016) · doi:10.18130/v3nc7n
Efeito da interleucina 17 na regulação hipotalâmica da homeostase energética
Nogueira, G. A. S. (2019) · doi:10.47749/t/unicamp.2019.1157283
Effects of IL-17 on Epidermal Development
Sato, E., & Imafuku, S. (2021) · IntechOpen eBooks · doi:10.5772/intechopen.101602
“In autoimmune diseases, IL-17E has been thought to negatively regulate pathogenesis by suppressing Th17-type immune responses [53].”
BackgroundCórdova, C. (2015) · UVaDOC UVaDOC University of Valladolid Documentary Repository (University of Valladolid) · doi:10.35376/10324/16185 · Cited by 1
Interleukin-17 Superfamily and Cancer
Yuzhalin, A. E., & Kutikhin, A. G. (2014) · Elsevier eBooks · doi:10.1016/b978-0-12-801121-8.00008-7
Lillo, S. (2023) · theses.fr (ABES) · doi:10.70675/49be81c2z656fz400dzbc64z391cf8330a65
Bubna, A. K. (2025) · Springer eBooks · doi:10.1007/978-981-95-3791-4_36
Baskara-Yhuellou, I. (2013) · theses.fr (ABES) · doi:10.70675/d74258fez17ffz424dz94cezbaf6e617cf55
Álvarez-Izquierdo, M., Pérez-Crespo, M., Esteban, J. G., Muñoz-Antolí, C., & Toledo, R. (2020) · Figshare · doi:10.6084/m9.figshare.13336108
Additional file 1 of Oleanolic acid ameliorates intestinal alterations associated with EAE
Gutierrez, B., Gallardo, I., Ruiz, L., Álvarez, Y., Cachofeiro, V., Margollés, A., Hernández, M., & Nieto, M. L. (2020) · Figshare · doi:10.6084/m9.figshare.13297194
Papel de BTLA en el eje cardio-renal
Masot, N. D. (2023) · RECERCAT (Consorci de Serveis Universitaris de Catalunya)
Garraud, K. (2012) · theses.fr (ABES) · doi:10.70675/b87948f7za3e8z43eazab93zaaac88a562ea · Cited by 1
IL-17/Th17 au cours de l'inflammation chronique : ciblage des interactions cellulaires
Noack, M. (2016) · theses.fr (ABES) · doi:10.70675/6c14da0dz4722z4f7dza68fz69984c282e4c · Cited by 1
IL - 17 et réponse inflammatoire systémique : focus sur le foie et le muscle
Beringer, A. (2018) · theses.fr (ABES) · doi:10.70675/2d9a348ez5879z4d92z938fz1e4047d398bc
Akim-Shittu, N. O., Peng, G., Tan, Y., Abudouwanli, A., Sun, Q., Yang, M., Zhao, W., Ogawa, H., Okumura, K., & Niyonsaba, F. (2026) · Clinical Reviews in Allergy & Immunology · doi:10.1007/s12016-026-09196-w
“In addition to promoting IL-5 and IL-13 secretion, IL-25 suppresses IL-12-and IL-23-dependent signaling cascades, thereby limiting Th1 and Th17 differentiation and reinforcing type 2 dominance [98, 99].”
The role of IL-25 in rhinovirus-induced asthma exacerbations
Beale, J. (2013) · Spiral (Imperial College London) · doi:10.25560/18679
Metadata
- Authors
- Kleinschek, M. A., Owyang, A. M., Joyce-Shaikh, B., Langrish, C. L., Chen, Y., Gorman, D. M., Blumenschein, W. M., McClanahan, T., Brombacher, F., Hurst, S. D., Kastelein, R. A., & Cua, D. J.
- Affiliations
- 1Discovery Research
- 2Experimental Pathology and Pharmacology, Schering-Plough Biopharma, Palo Alto, CA 94304
- University of Cape Town (ZA)
- Venue
- The Journal of Experimental Medicine
- Publisher
- Rockefeller University Press
- Published
- 2007-01-02
- Volume
- 204
- Issue
- 1
- Pages
- 161-170
- ISSN
- 0022-1007 (ISSN-L)
- 1540-9538
- PMC
- PMC2118427
- OpenAlex
- W2118140057
- Cited by
- 396
- References
- 58
- Citations by year
- 2026: 4 · 2025: 12 · 2024: 7 · 2023: 11 · 2022: 13 · 2021: 14 · 2020: 20 · 2019: 14 · 2018: 15 · 2017: 12 · 2016: 23 · 2015: 14 · 2014: 24 · 2013: 15 · 2012: 32
- FWCI
- 16.20
- Type
- journal article
- Language
- en
- Open access
- green
- europepmc.org
- Licence
- cc-by-nc-sa
- Locations
- The Journal of Experimental Medicine (publishedVersion)
- Europe PMC (PubMed Central) (publishedVersion, cc-by-nc-sa)
- PubMed Central (publishedVersion, cc-by-nc-sa)
- PubMed (publishedVersion)
- Topics
- Life Sciences › Immunology and Microbiology › Immunology › Psoriasis: Treatment and Pathogenesis
- Life Sciences › Immunology and Microbiology › Immunology › T-cell and B-cell Immunology
- Health Sciences › Medicine › Clinical Neurology › Multiple Sclerosis Research Studies
- Keywords
- IL-25, Th17 cells, IL-17, autoimmune encephalomyelitis, IL-23, IL-13, dendritic cells, IL-1β, interleukin-6, IL-17 family cytokines, organ-specific autoimmunity, Th2 immune response, relapsing-remitting EAE, cytokine therapy
- MeSH terms
- Animals, Base Sequence, Central Nervous System, DNA, Encephalomyelitis, Autoimmune, Experimental, Female, T-Lymphocytes, Helper-Inducer, Inflammation, Interferon-gamma, Interleukins, Male, Mice, Inbred C57BL, Autoimmunity, Mice, Knockout, Th2 Cells, Interleukin-17, Mice
About these checks
Registry, retraction, Cites and statistics results are computed, not judged, with one exception: a printed reference that no index lists is read once by a model before it counts as a citation error. Claims are extracted by a model and kept only when their quote appears verbatim in the text; each cited source is then checked, with a model’s help, for whether it says what the claim relies on. Those verdicts can be wrong — read the claim’s quote and the cited source before relying on one.
Statistics and arithmetic are recomputed, not judged.
Confidence bands are shown only for fields calibrated on our annotated test set. None is calibrated yet, so no band is shown.
What counts as a claim ›How we measure confidence ›How we check this ›
Are you an author, or do you see a problem with this page? Request a review
Data sources
Bibliographic data: Semantic Scholar, OpenAlex, Crossref.
Contains information from the Semantic Scholar Academic Graph Datasets, made available under the ODC Attribution License (ODC-BY 1.0).
Semantic Scholar’s data is described in: Kinney, R., et al. (2023). The Semantic Scholar Open Data Platform. arXiv:2301.10140.
