Cited by 145

The DOI matches its Crossref record.

Molecular mechanism of mast cell–mediated innate defense against endothelin and snake venom sarafotoxin

Schneider, Lars A., Schlenner, Susan M., Feyerabend, Thorsten B., Wunderlin, Markus, Rodewald, Hans-Reimer·2007·The Journal of Experimental Medicine

Abstract

Mast cells are protective against snake venom sarafotoxins that belong to the endothelin (ET) peptide family. The molecular mechanism underlying this recently recognized innate defense pathway is unknown, but secretory granule proteases have been invoked. To specifically disrupt a single protease function without affecting expression of other proteases, we have generated a mouse mutant selectively lacking mast cell carboxypeptidase A (Mc-cpa) activity. Using this mutant, we have now identified Mc-cpa as the essential protective mast cell enzyme. Mass spectrometry of peptide substrates after cleavage by normal or mutant mast cells showed that removal of a single amino acid, the C-terminal tryptophan, from ET and sarafotoxin by Mc-cpa is the principle molecular mechanism underlying this very rapid mast cell response. Mast cell proteases can also cleave ET and sarafotoxin internally, but such “nicking” is not protective because intramolecular disulfide bridges maintain peptide function. We conclude that mast cells attack ET and sarafotoxin exactly at the structure required for toxicity, and hence sarafotoxins could not “evade” Mc-cpa's substrate specificity without loss of toxicity.

Overview

The claims and statistics of this paper haven’t been checked yet.

Run the check — free, no account needed. It reads the open-access text and checks the sources it cites.

A few free checks a day · papers already verified open instantly · results are public

Integrity signals

Registry

Crossref · 10.1084/jem.20071262

Cites

Statistics

Figures

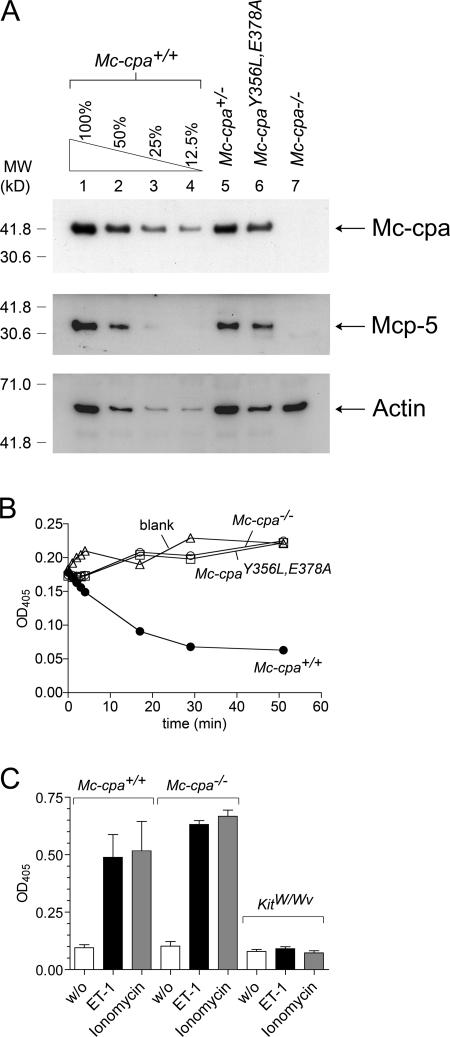
Figure 1. Protein expression, carboxypeptidase activity, and ET-1–induced degranulation in mutant mast cells. (A) Lysates of purified peritoneal mast cells from Mc-cpa+/+ (lanes 1–4), Mc-cpa+/− (lane 5), Mc-cpaY356L,E378A (lane 6), and Mc-cpa−/− (lane 7) mice were analyzed by Western blotting for Mc-cpa (top), Mcp-5 (middle), and actin (bottom) expression. Mc-cpa+/+ cell lysates were titrated to estimate the level of Mc-cpa expression in Mc-cpaY356L,E378A mice. 100% in lane 1 corresponds to 14,000 purified peritoneal mast cells. Densitometric measurements of actin expression showed 637, 222, 69, and 46 arbitrary units in lanes 1–4, respectively, and 622, 283, and 601 in lanes 5–7, respectively. Measurements for Mc-cpa expression showed 592, 303, 130, and 70 arbitrary units in lanes 1–4, respectively, and 401, 270, and <1 in lanes 5–7, respectively. Based on these values, we estimate that Mc-cpaY356L,E378A mast cells expressed ∼80% of the Mc-cpa amount expressed in normal mast cells. (B) Lysates of 10,000 peritoneal mast cells from Mc-cpa+/+ (•), Mc-cpa−/− (○), and Mc-cpaY356L,E378A (□) mice, and the blank (without cells) control (▵) were analyzed for carboxypeptidase activity by test substrate (45). Both Mc-cpa−/− and Mc-cpaY356L,E378A mast cells lacked Mc-cpa activity. (C) Mast cell degranulation in response to ET-1 in vitro. PECs from Mc-cpa+/+, Mc-cpa−/−, and KitW/Wv mice were left without stimulus (white bars), treated with ET-1 (black bars), or treated with ionomycin (gray bars). Supernatants were analyzed for β-hexosaminidase release as a measure for degranulation by colorimetric assay (16). The release is mast cell specific, as shown by the absence of β-hexosaminidase release in PECs from KitW/Wv mice. Data summarize the mean ± one SD for three (Mc-cpa+/+ and Mc-cpa−/−) and two (KitW/Wv) independent experiments. Release was significantly different comparing unstimulated versus ET-1–stimulated Mc-cpa+/+ (P = 0.046) and unstimulated versus ET-1–stimulated Mc-cpa−/− (P = 0.001) mast cells, indicating specific degranulation of both genotypes by ET-1. In both genotypes, stimulations by ET-1 and ionomycin were not significantly different. P = 0.5 for Mc-cpa+/+ and P = 0.1 for Mc-cpa−/−.
Figure 1. Protein expression, carboxypeptidase activity, and ET-1–induced degranulation in mutant mast cells. (A) Lysates of purified peritoneal mast cells from Mc-cpa+/+ (lanes 1–4), Mc-cpa+/− (lane 5), Mc-cpaY356L,E378A (lane 6), and Mc-cpa−/− (lane 7) mice were analyzed by Western blotting for Mc-cpa (top), Mcp-5 (middle), and actin (bottom) expression. Mc-cpa+/+ cell lysates were titrated to estimate the level of Mc-cpa expression in Mc-cpaY356L,E378A mice. 100% in lane 1 corresponds to 14,000 purified peritoneal mast cells. Densitometric measurements of actin expression showed 637, 222, 69, and 46 arbitrary units in lanes 1–4, respectively, and 622, 283, and 601 in lanes 5–7, respectively. Measurements for Mc-cpa expression showed 592, 303, 130, and 70 arbitrary units in lanes 1–4, respectively, and 401, 270, and <1 in lanes 5–7, respectively. Based on these values, we estimate that Mc-cpaY356L,E378A mast cells expressed ∼80% of the Mc-cpa amount expressed in normal mast cells. (B) Lysates of 10,000 peritoneal mast cells from Mc-cpa+/+ (•), Mc-cpa−/− (○), and Mc-cpaY356L,E378A (□) mice, and the blank (without cells) control (▵) were analyzed for carboxypeptidase activity by test substrate (45). Both Mc-cpa−/− and Mc-cpaY356L,E378A mast cells lacked Mc-cpa activity. (C) Mast cell degranulation in response to ET-1 in vitro. PECs from Mc-cpa+/+, Mc-cpa−/−, and KitW/Wv mice were left without stimulus (white bars), treated with ET-1 (black bars), or treated with ionomycin (gray bars). Supernatants were analyzed for β-hexosaminidase release as a measure for degranulation by colorimetric assay (16). The release is mast cell specific, as shown by the absence of β-hexosaminidase release in PECs from KitW/Wv mice. Data summarize the mean ± one SD for three (Mc-cpa+/+ and Mc-cpa−/−) and two (KitW/Wv) independent experiments. Release was significantly different comparing unstimulated versus ET-1–stimulated Mc-cpa+/+ (P = 0.046) and unstimulated versus ET-1–stimulated Mc-cpa−/− (P = 0.001) mast cells, indicating specific degranulation of both genotypes by ET-1. In both genotypes, stimulations by ET-1 and ionomycin were not significantly different. P = 0.5 for Mc-cpa+/+ and P = 0.1 for Mc-cpa−/−.CC BY-NC-SA · PubMed Central
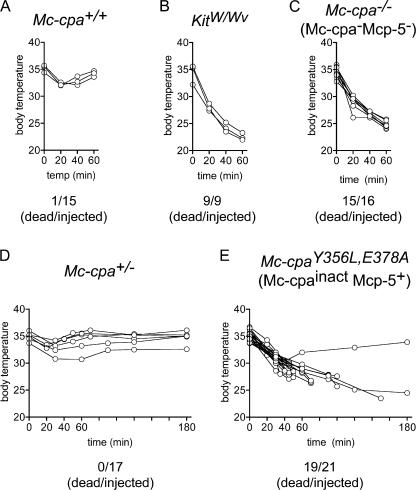
Figure 2. Susceptibility of Mc-cpa−/− and Mc-cpaY356L,E378A mutant mice to ET-1. ET-1 was injected intraperitoneally into Mc-cpa+/+ (A), KitW/Wv (B), Mc-cpa−/− (C), Mc-cpa+/− (D), and Mc-cpaY356L,E378A (E) mice, and the body temperature was tracked by rectal measurements at the indicated time points. Summarized total numbers of dead per injected mice are indicated for each genotype. For clarity, the temperature kinetic is shown for representative mice. Mc-cpa+/+ and Mc-cpa+/− showed a mild and transient temperature drop (A and D), whereas mast cell–deficient KitW/Wv (B), and mice lacking Mc-cpa and Mcp-5 (Mc-cpa−/−; C) succumbed to ET-1 injection within 60 min. Mice lacking only catalytically active Mc-cpa (Mc-cpaY356L,E378A; E) were also largely susceptible to ET-1, but the kinetic of the temperature drop was delayed compared with KitW/Wv or Mc-cpa−/− mice.
Figure 2. Susceptibility of Mc-cpa−/− and Mc-cpaY356L,E378A mutant mice to ET-1. ET-1 was injected intraperitoneally into Mc-cpa+/+ (A), KitW/Wv (B), Mc-cpa−/− (C), Mc-cpa+/− (D), and Mc-cpaY356L,E378A (E) mice, and the body temperature was tracked by rectal measurements at the indicated time points. Summarized total numbers of dead per injected mice are indicated for each genotype. For clarity, the temperature kinetic is shown for representative mice. Mc-cpa+/+ and Mc-cpa+/− showed a mild and transient temperature drop (A and D), whereas mast cell–deficient KitW/Wv (B), and mice lacking Mc-cpa and Mcp-5 (Mc-cpa−/−; C) succumbed to ET-1 injection within 60 min. Mice lacking only catalytically active Mc-cpa (Mc-cpaY356L,E378A; E) were also largely susceptible to ET-1, but the kinetic of the temperature drop was delayed compared with KitW/Wv or Mc-cpa−/− mice.CC BY-NC-SA · PubMed Central
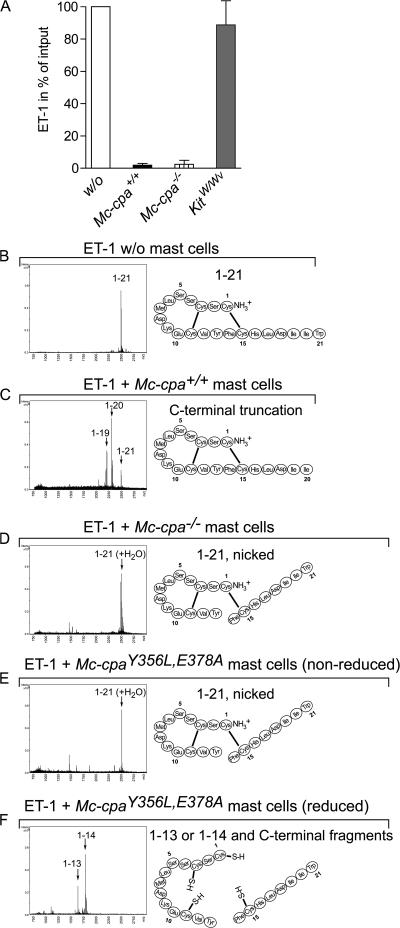
Figure 3. Degradation of ET-1 by mast cells. (A) ELISA measurements of “residual” ET-1 after incubation of ET-1 with no cells (open bar), or with PECs from Mc-cpa+/+ (solid bar), Mc-cpa−/− (striped bar), or KitW/Wv (shaded bar) mice. Mast cell–containing PECs from Mc-cpa+/+ (P = 0.030 [significant] comparing Mc-cpa+/+ versus KitW/Wv mice), and Mc-cpa−/− (P = 0.037 [significant] comparing Mc-cpa−/− versus KitW/Wv mice) mice abolished ET-1 reactivity by ELISA, suggesting that ET-1 was degraded regardless (P = 0.78 [not significant] comparing Mc-cpa+/+ vs. Mc-cpa−/−) of the mast cell genotype. Data summarize the mean ± one standard deviation for three independent experiments. (B–F) Mass spectrometric analysis of ET-1 degradation (left), and schematic depiction of substrate products (right). ET-1 was left untreated (B) or incubated with ionomycin-stimulated purified peritoneal mast cells from Mc-cpa+/+ (C), Mc-cpa−/− (D), or Mc-cpaY356L,E378A (E and F) mice. C-terminal degradation, evident by the appearance of ET-1 fragments corresponding to the molecular masses of 1–19 and 1–20, was mediated by Mc-cpa+/+ (C), but not by Mc-cpa−/− (D) or Mc-cpaY356L,E378A (E), mast cells. However, after incubation of ET-1 with Mc-cpa−/− (D) or Mc-cpaY356L,E378A (E) mast cells, the molecular mass increased from 2,492 (ET-1; B) to 2,510 daltons (ET-1 plus water; D and E). Hydrolysis of ET-1 was demonstrated after reduction of the samples by the disappearance of the ET-1 1–21 peak, and the appearance of new fragments with molecular masses of 1,639 and 1,786 daltons (see Materials and methods) corresponding to ET-1 1–13 and 1–14, respectively (F). Data are representative of three independent experiments.
Figure 3. Degradation of ET-1 by mast cells. (A) ELISA measurements of “residual” ET-1 after incubation of ET-1 with no cells (open bar), or with PECs from Mc-cpa+/+ (solid bar), Mc-cpa−/− (striped bar), or KitW/Wv (shaded bar) mice. Mast cell–containing PECs from Mc-cpa+/+ (P = 0.030 [significant] comparing Mc-cpa+/+ versus KitW/Wv mice), and Mc-cpa−/− (P = 0.037 [significant] comparing Mc-cpa−/− versus KitW/Wv mice) mice abolished ET-1 reactivity by ELISA, suggesting that ET-1 was degraded regardless (P = 0.78 [not significant] comparing Mc-cpa+/+ vs. Mc-cpa−/−) of the mast cell genotype. Data summarize the mean ± one standard deviation for three independent experiments. (B–F) Mass spectrometric analysis of ET-1 degradation (left), and schematic depiction of substrate products (right). ET-1 was left untreated (B) or incubated with ionomycin-stimulated purified peritoneal mast cells from Mc-cpa+/+ (C), Mc-cpa−/− (D), or Mc-cpaY356L,E378A (E and F) mice. C-terminal degradation, evident by the appearance of ET-1 fragments corresponding to the molecular masses of 1–19 and 1–20, was mediated by Mc-cpa+/+ (C), but not by Mc-cpa−/− (D) or Mc-cpaY356L,E378A (E), mast cells. However, after incubation of ET-1 with Mc-cpa−/− (D) or Mc-cpaY356L,E378A (E) mast cells, the molecular mass increased from 2,492 (ET-1; B) to 2,510 daltons (ET-1 plus water; D and E). Hydrolysis of ET-1 was demonstrated after reduction of the samples by the disappearance of the ET-1 1–21 peak, and the appearance of new fragments with molecular masses of 1,639 and 1,786 daltons (see Materials and methods) corresponding to ET-1 1–13 and 1–14, respectively (F). Data are representative of three independent experiments.CC BY-NC-SA · PubMed Central
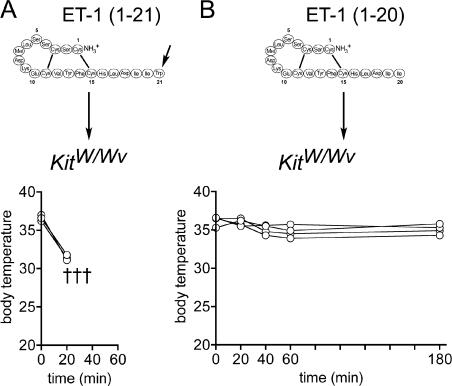
Figure 4. Removal of tryptophan from the C terminus renders ET-1 nontoxic for mast cell–deficient mice. Synthetic peptides of ET-1 (1–21; A) or of ET-1 minus tryptophan in position 21 (1–20; B) were injected intraperitoneally into mast cell–deficient KitW/Wv mice, and the body temperature was followed by rectal measurements at indicated time points. Mast cell–deficient KitW/Wv mice were resistant to ET-1 (1–20), but succumbed to ET-1 (1–21).
Figure 4. Removal of tryptophan from the C terminus renders ET-1 nontoxic for mast cell–deficient mice. Synthetic peptides of ET-1 (1–21; A) or of ET-1 minus tryptophan in position 21 (1–20; B) were injected intraperitoneally into mast cell–deficient KitW/Wv mice, and the body temperature was followed by rectal measurements at indicated time points. Mast cell–deficient KitW/Wv mice were resistant to ET-1 (1–20), but succumbed to ET-1 (1–21).CC BY-NC-SA · PubMed Central
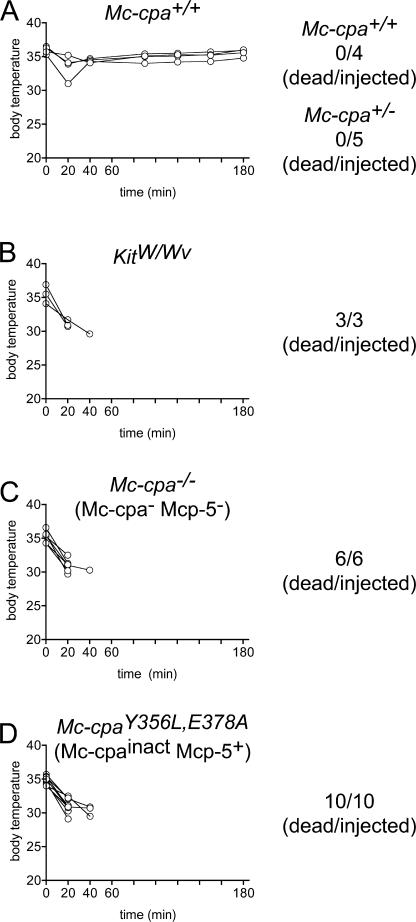
Figure 5. Susceptibility of Mc-cpa mutants to S6b. The S6b was injected intraperitoneally into Mc-cpa+/+ (A), Mc-cpa+/− (only numbers shown in A), KitW/Wv (B), Mc-cpa−/− (C), and Mc-cpaY356L,E378A (D) mice, and the body temperature was followed by rectal measurements at the indicated time points. Summarized total numbers of dead per injected mice are indicated for each genotype. The temperature kinetic of Mc-cpa+/− mice (not depicted) was similar to the one from Mc-cpa+/+ mice. All strains except for Mc-cpa+/+ and Mc-cpa+/− mice succumbed to S6b injection within 60 min. The full susceptibility of Mc-cpaY356L,E378A mice demonstrates the essential role of Mc-cpa enzyme activity for survival of snake venom S6b.
Figure 5. Susceptibility of Mc-cpa mutants to S6b. The S6b was injected intraperitoneally into Mc-cpa+/+ (A), Mc-cpa+/− (only numbers shown in A), KitW/Wv (B), Mc-cpa−/− (C), and Mc-cpaY356L,E378A (D) mice, and the body temperature was followed by rectal measurements at the indicated time points. Summarized total numbers of dead per injected mice are indicated for each genotype. The temperature kinetic of Mc-cpa+/− mice (not depicted) was similar to the one from Mc-cpa+/+ mice. All strains except for Mc-cpa+/+ and Mc-cpa+/− mice succumbed to S6b injection within 60 min. The full susceptibility of Mc-cpaY356L,E378A mice demonstrates the essential role of Mc-cpa enzyme activity for survival of snake venom S6b.CC BY-NC-SA · PubMed Central
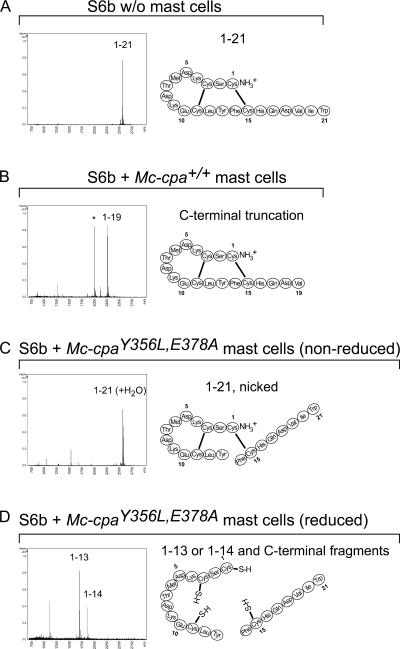
Figure 6. Degradation of S6b by mast cells. (A–D) Mass spectrometric analyses (left side) of degradation products of S6b. Resulting peptides are schematically depicted on the right side. S6b was left untreated (A) or incubated with ionomycin-stimulated purified mast cells from Mc-cpa+/+ (B) or Mc-cpaY356L,E378A (C and D) mice. C-terminal degradation, which is evident from the appearance of fragments corresponding to the molecular mass of S6b (1–19; 2,266 daltons), was mediated by Mc-cpa+/+ (B), but not by Mc-cpaY356L,E378A (C) mast cells. The peak marked by the asterisk in B does not correspond to a fragment of S6b, and it was not observed in a second experiment. The molecular mass of S6b (1–21) increased after incubation with Mc-cpaY356L,E378A mast cells from 2,565 (1–21; A) to 2,583 daltons (S6b 1–21 plus water; C). This indicated hydrolysis of S6b, which was proven after reduction of the samples by the disappearance of the S6b 1–21 peak, and the appearance of residual fragments with molecular masses of 1,710 and 1,858 daltons (see Materials and methods) corresponding to S6b 1–13 and 1–14, respectively (D). Data are representative for two independent experiments.
Figure 6. Degradation of S6b by mast cells. (A–D) Mass spectrometric analyses (left side) of degradation products of S6b. Resulting peptides are schematically depicted on the right side. S6b was left untreated (A) or incubated with ionomycin-stimulated purified mast cells from Mc-cpa+/+ (B) or Mc-cpaY356L,E378A (C and D) mice. C-terminal degradation, which is evident from the appearance of fragments corresponding to the molecular mass of S6b (1–19; 2,266 daltons), was mediated by Mc-cpa+/+ (B), but not by Mc-cpaY356L,E378A (C) mast cells. The peak marked by the asterisk in B does not correspond to a fragment of S6b, and it was not observed in a second experiment. The molecular mass of S6b (1–21) increased after incubation with Mc-cpaY356L,E378A mast cells from 2,565 (1–21; A) to 2,583 daltons (S6b 1–21 plus water; C). This indicated hydrolysis of S6b, which was proven after reduction of the samples by the disappearance of the S6b 1–21 peak, and the appearance of residual fragments with molecular masses of 1,710 and 1,858 daltons (see Materials and methods) corresponding to S6b 1–13 and 1–14, respectively (D). Data are representative for two independent experiments.CC BY-NC-SA · PubMed Central
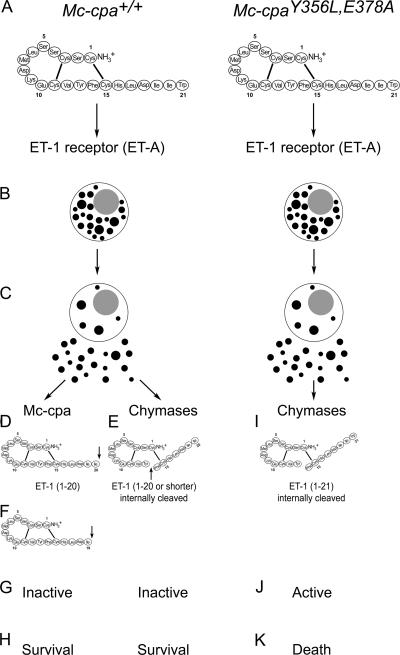
Figure 7. Molecular mechanism of ET family peptide degradation by Mc-cpa. (A–C) ET-1 and S6b, shown here for ET-1, stimulate mast cells via binding to ET receptors. The receptor type most prominently expressed on peritoneal mast cells is ETA. ETA activation leads to massive degranulation, which is comparable to stimulation via ionomycin, and release of mast cell granule content. These early events are identical in mast cells from Mc-cpa+/+ (A–C; left) and Mc-cpaY356L,E378A (A–C; right) mice. (D–H) Mast cells secrete a set of proteases that include one carboxypeptidase A (Mc-cpa) and several chymases that include Mcp-5. Mc-cpa attacks the C terminus of ETs, and removes amino acids in position 21 (Trp; D) and 20 (Ile; F). These modifications render ETs and related toxins biologically inactive by three orders of magnitude (G; 34), and the mice survive (H). Mc-cpaY356L,E378A mice, which selectively lack active Mc-cpa, are unable to attack the C terminus of ET-1 (I). Mast cell products (possibly Mcp-4) other than Mc-cpa and Mcp-5 attack ET-1 internally by hydrolysis (E and I). Although the molecular structure (46) of position 13–nicked ET-1 is likely altered, ET-1 fragmentation is prevented by the disulfide bridge (1 to 15; E and I), and the molecules retain their toxicity (J and K), unless the C terminus is truncated (E). Mc-cpaY356L,E378A mutant mice are unable to do so, and succumb to exogenous ET-1 and related toxins, thereby demonstrating the essential role of Mc-cpa for this innate immune pathway. Whether or not Mc-cpa is also involved in the degradation of endogenously produced ETs remains to be investigated.
Figure 7. Molecular mechanism of ET family peptide degradation by Mc-cpa. (A–C) ET-1 and S6b, shown here for ET-1, stimulate mast cells via binding to ET receptors. The receptor type most prominently expressed on peritoneal mast cells is ETA. ETA activation leads to massive degranulation, which is comparable to stimulation via ionomycin, and release of mast cell granule content. These early events are identical in mast cells from Mc-cpa+/+ (A–C; left) and Mc-cpaY356L,E378A (A–C; right) mice. (D–H) Mast cells secrete a set of proteases that include one carboxypeptidase A (Mc-cpa) and several chymases that include Mcp-5. Mc-cpa attacks the C terminus of ETs, and removes amino acids in position 21 (Trp; D) and 20 (Ile; F). These modifications render ETs and related toxins biologically inactive by three orders of magnitude (G; 34), and the mice survive (H). Mc-cpaY356L,E378A mice, which selectively lack active Mc-cpa, are unable to attack the C terminus of ET-1 (I). Mast cell products (possibly Mcp-4) other than Mc-cpa and Mcp-5 attack ET-1 internally by hydrolysis (E and I). Although the molecular structure (46) of position 13–nicked ET-1 is likely altered, ET-1 fragmentation is prevented by the disulfide bridge (1 to 15; E and I), and the molecules retain their toxicity (J and K), unless the C terminus is truncated (E). Mc-cpaY356L,E378A mutant mice are unable to do so, and succumb to exogenous ET-1 and related toxins, thereby demonstrating the essential role of Mc-cpa for this innate immune pathway. Whether or not Mc-cpa is also involved in the degradation of endogenously produced ETs remains to be investigated.CC BY-NC-SA · PubMed Central

Verification

Claims the paper makes

The claims and statistics of this paper haven’t been checked yet.

Run the check — free, no account needed. It reads the open-access text and checks the sources it cites.

A few free checks a day · papers already verified open instantly · results are public

Claims other papers make about this one

Each is checked against this paper’s own text: does it say what the citing paper says it does?

Self-check

Percentages, sums and reported differences re-computed from the paper’s own numbers.

The self-check needs the paper’s full text.

Citations

Cites

No references could be resolved yet.

Research works printed but not linked: 44

  1. 1996, Nature., 381, 75, 10.1038/381075a0 · DOI
  2. 1996, Nature., 381, 77, 10.1038/381077a0 · DOI
  3. 1999, Br. Med. Bull., 55, 30, 10.1258/0007142991902286 · DOI
  4. 2000, Eur. J. Pharmacol., 407, 1, 10.1016/S0014-2999(00)00675-0 · DOI
  5. 2003, Can. J. Physiol. Pharmacol., 81, 635, 10.1139/y03-050 · DOI
  6. 1995, N. Engl. J. Med., 333, 356, 10.1056/NEJM199508103330607 · DOI
  7. 1990, J. Exp. Med., 172, 1741, 10.1084/jem.172.6.1741 · DOI
  8. 1996, Crit. Care Med., 24, 721, 10.1097/00003246-199604000-00033 · DOI
  9. 2004, Eur. J. Immunol., 34, 1910, 10.1002/eji.200424912 · DOI
  10. 2004, Nature., 432, 512, 10.1038/nature03085 · DOI · Paper page
  11. 2006, Science., 313, 526, 10.1126/science.1128877 · DOI · Paper page
  12. 1998, J. Clin. Immunol., 18, 169, 10.1023/A:1020574820797 · DOI
  13. 2002, Mol. Immunol., 38, 1353, 10.1016/S0161-5890(02)00087-1 · DOI
  14. 2006, FEBS J., 273, 1871, 10.1111/j.1742-4658.2006.05211.x · DOI
  15. 2005, Mol. Cell. Biol., 25, 6199, 10.1128/MCB.25.14.6199-6210.2005 · DOI
  16. 2004, J. Biol. Chem., 279, 40897, 10.1074/jbc.M405856200 · DOI
  17. 1996, FASEB J., 10, 1307
  18. 1987, J. Immunol., 139, 3771, 10.4049/jimmunol.139.11.3771 · DOI
  19. 2004, Biochem. J., 379, 217, 10.1042/bj20031230 · DOI
  20. 1989, J. Biol. Chem., 264, 20094, 10.1016/S0021-9258(19)47223-2 · DOI
  21. 2002, J. Biol. Chem., 277, 18579, 10.1074/jbc.M110356200 · DOI
  22. 2001, Cell. Mol. Life Sci., 58, 1790, 10.1007/PL00000819 · DOI
  23. 1998, Biochemistry., 37, 16555, 10.1021/bi981678i · DOI
  24. 2001, Biochemistry., 40, 10197, 10.1021/bi010807j · DOI
  25. 1978, Blood., 52, 447, 10.1182/blood.V52.2.447.447 · DOI · Paper page
  26. 1990, Proc. Natl. Acad. Sci. USA., 87, 4702, 10.1073/pnas.87.12.4702 · DOI
  27. 2002, Arterioscler. Thromb. Vasc. Biol., 22, 268, 10.1161/hq0202.103994 · DOI
  28. 2005, Trends Immunol., 26, 235, 10.1016/j.it.2005.03.007 · DOI
  29. 1988, Science., 242, 268, 10.1126/science.2845579 · DOI
  30. 2000, J. Exp. Med., 192, 1849, 10.1084/jem.192.12.1849 · DOI · Paper page
  31. 2006, Nat. Med., 12, 999, 10.1038/nm0906-999 · DOI
  32. 1988, Biochem. Biophys. Res. Commun., 156, 1182, 10.1016/S0006-291X(88)80757-5 · DOI
  33. 2000, Biophys. J., 79, 3083, 10.1016/S0006-3495(00)76543-X · DOI
  34. 1995, Eur. J. Surg., 161, 9
  35. 2000, Biochim. Biophys. Acta., 1501, 211, 10.1016/S0925-4439(00)00025-9 · DOI
  36. 2002, Shock., 18, 415, 10.1097/00024382-200211000-00005 · DOI
  37. 2004, J. Perinat. Med., 32, 522
  38. 1989, Neuropeptides., 14, 231, 10.1016/0143-4179(89)90051-6 · DOI
  39. 1998, Gut., 42, 696, 10.1136/gut.42.5.696 · DOI
  40. 2000, Life Sci., 67, 1947, 10.1016/S0024-3205(00)00783-9 · DOI
  41. 2004, Blood., 104, 1688
  42. 2000, Nucleic Acids Res., 28, E78, 10.1093/nar/28.16.e78 · DOI
  43. 2002, Biol. Chem., 383, 793
  44. 1994, Nat. Struct. Biol., 1, 311, 10.1038/nsb0594-311 · DOI

Cited by

Sorted by citations

Metadata

Authors
Schneider, L. A., Schlenner, S. M., Feyerabend, T. B., Wunderlin, M., & Rodewald, H.-R.
Venue
The Journal of Experimental Medicine
Published
2007-10-08
Volume
204
Issue
11
Pages
2629-2639
ISSN
  • 1540-9538
  • 0022-1007
Cited by
145
References
0
Language
en

About these checks

Registry, retraction, Cites and statistics results are computed, not judged, with one exception: a printed reference that no index lists is read once by a model before it counts as a citation error. Claims are extracted by a model and kept only when their quote appears verbatim in the text; each cited source is then checked, with a model’s help, for whether it says what the claim relies on. Those verdicts can be wrong — read the claim’s quote and the cited source before relying on one.

Statistics and arithmetic are recomputed, not judged.

Confidence bands are shown only for fields calibrated on our annotated test set. None is calibrated yet, so no band is shown.

What counts as a claim ›How we measure confidence ›How we check this ›

Are you an author, or do you see a problem with this page? Request a review