Student or educator? Sign up with your school email and get 6 months of Pro free.
Cited by 153

The DOI matches its Crossref record; 42 of the 42 references it cites were found in a registry or an index.

Regulation of T cell receptor signaling by activation-induced zinc influx

Yu, Mingcan, Lee, Won-Woo, Tomar, Deepak, Pryshchep, Sergey, Czesnikiewicz-Guzik, Marta, Lamar, David L., Li, Guangjin, Singh, Karnail, Tian, Lu, Weyand, Cornelia M., Goronzy, Jörg J.·2011·Journal of Experimental Medicine

Abstract

Zinc is a trace element that is essential for innate and adaptive immune responses. In addition to being a structural element of many proteins, zinc also functions as a neurotransmitter and an intracellular messenger. Temporal or spatial changes in bioavailable zinc may influence the activity of several enzymes, including kinases and phosphatases. We provide evidence that zinc functions as an ionic signaling molecule after T cell activation. Cytoplasmic zinc concentrations increased within 1 min after T cell receptor (TCR) triggering, in particular in the subsynaptic compartment. The increase depended on the extracellular zinc concentrations and was inhibited by silencing zinc transporter Zip6. Increased zinc influx reduced the recruitment of SHP-1 to the TCR activation complex, augmented ZAP70 phosphorylation and sustained calcium influx. By calibrating TCR activation thresholds, increased extracellular zinc bioavailability facilitated the induction of T cell proliferative responses to suboptimal stimuli.

Overview

The claims and statistics of this paper haven’t been checked yet.

Run the check — free, no account needed. It reads the open-access text and checks the sources it cites.

A few free checks a day · papers already verified open instantly · results are public

Integrity signals

Registry

Crossref · 10.1084/jem.20100031

Cites

42 of 42 references verified0 citation errors · 0 not checkable

Statistics

Figures

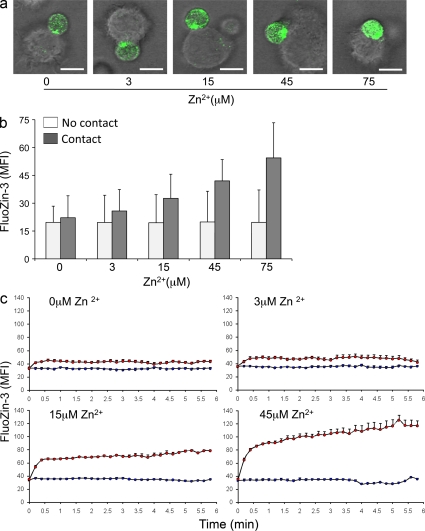
Figure 1. Activation-induced increase in cytoplasmic zinc. (a) CD4 T cells were labeled with zinc ion–specific probe FluoZin-3 AM and pelleted with TSST-1/SEB-loaded mDC by centrifugation for 1 min in RPMI medium supplemented with the indicated concentrations of ZnCl2. Cells were analyzed by confocal microscopy at 10 min after centrifugation. Confocal images of representative T cell–DC clusters at increasing zinc concentrations are shown. Bars, 10 µm. (b) FluoZin-3 fluorescence was determined for CD4 T cells that had established membrane contact with DCs (shaded bars). Isolated unstimulated CD4 T cells served as control (open bars). Data are expressed as mean ± SD of MFI of >50 individual cells and are representative of three experiments. Intracellular zinc concentrations were significantly influenced by extracellular zinc concentrations (P < 0.001) in T cells recognizing superantigen-loaded DCs. (c) FluoZin-3–labeled CD4 T cells were cultured with TSST-1/SEB-loaded mDC RPMI medium supplemented with 0, 3, 15, and 45 µM ZnCl2 and followed by live-cell imaging (12-s interval between frames). The line graphs show the tracing of T cells that were not in contact with DCs (blue line) and of T cells that had established an interaction platform with DCs (red line). Data shows the mean ± SEM of >10 individual cells and are representative of three experiments.
Figure 1. Activation-induced increase in cytoplasmic zinc. (a) CD4 T cells were labeled with zinc ion–specific probe FluoZin-3 AM and pelleted with TSST-1/SEB-loaded mDC by centrifugation for 1 min in RPMI medium supplemented with the indicated concentrations of ZnCl2. Cells were analyzed by confocal microscopy at 10 min after centrifugation. Confocal images of representative T cell–DC clusters at increasing zinc concentrations are shown. Bars, 10 µm. (b) FluoZin-3 fluorescence was determined for CD4 T cells that had established membrane contact with DCs (shaded bars). Isolated unstimulated CD4 T cells served as control (open bars). Data are expressed as mean ± SD of MFI of >50 individual cells and are representative of three experiments. Intracellular zinc concentrations were significantly influenced by extracellular zinc concentrations (P < 0.001) in T cells recognizing superantigen-loaded DCs. (c) FluoZin-3–labeled CD4 T cells were cultured with TSST-1/SEB-loaded mDC RPMI medium supplemented with 0, 3, 15, and 45 µM ZnCl2 and followed by live-cell imaging (12-s interval between frames). The line graphs show the tracing of T cells that were not in contact with DCs (blue line) and of T cells that had established an interaction platform with DCs (red line). Data shows the mean ± SEM of >10 individual cells and are representative of three experiments.CC BY-NC-SA · PubMed Central
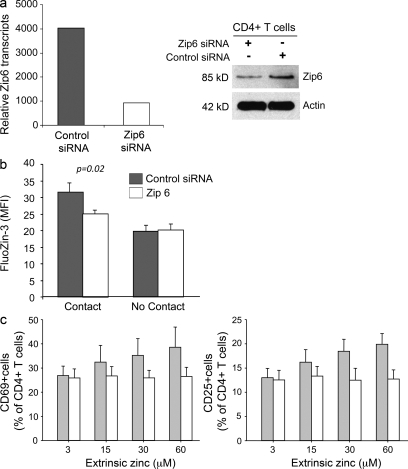
Figure 2. Activation-induced zinc influx is mediated by the zinc transporter Zip6. (a, left) CD4 T cells were transfected with scrambled control siRNA (gray bars) or with Zip6 siRNA (open bars). Zip6 mRNA was quantified 48 h after transfection by quantitative PCR. Zip6 transcripts normalized to β-actin transcripts are representative of three experiments. (a, right) Zip6 protein in control and specifically transfected T cells were detected by Western blotting. (b) On day 2 after transfection, T cells were labeled with FluoZin-3 AM and pelleted with TSST-1/SEB-loaded mDC in medium supplemented with 45 µM zinc. MFI was obtained for individual T cells that were or were not in contact with DC by confocal microscopy 10 min after 1 min of centrifugation. Results are expressed as mean ± SEM of >100 cells and are representative of three experiments. Zip6 silencing reduced the increase in FluoZin-3 MFI by ∼50% (P = 0.02). (c) CD4 T cells transfected with control or Zip6 siRNA were stimulated with TSST-1 and mDC for 24 h. Frequencies of CD25- and CD69-expressing cells were determined by flow cytometry. Data are shown as mean ± SEM of four experiments.
Figure 2. Activation-induced zinc influx is mediated by the zinc transporter Zip6. (a, left) CD4 T cells were transfected with scrambled control siRNA (gray bars) or with Zip6 siRNA (open bars). Zip6 mRNA was quantified 48 h after transfection by quantitative PCR. Zip6 transcripts normalized to β-actin transcripts are representative of three experiments. (a, right) Zip6 protein in control and specifically transfected T cells were detected by Western blotting. (b) On day 2 after transfection, T cells were labeled with FluoZin-3 AM and pelleted with TSST-1/SEB-loaded mDC in medium supplemented with 45 µM zinc. MFI was obtained for individual T cells that were or were not in contact with DC by confocal microscopy 10 min after 1 min of centrifugation. Results are expressed as mean ± SEM of >100 cells and are representative of three experiments. Zip6 silencing reduced the increase in FluoZin-3 MFI by ∼50% (P = 0.02). (c) CD4 T cells transfected with control or Zip6 siRNA were stimulated with TSST-1 and mDC for 24 h. Frequencies of CD25- and CD69-expressing cells were determined by flow cytometry. Data are shown as mean ± SEM of four experiments.CC BY-NC-SA · PubMed Central
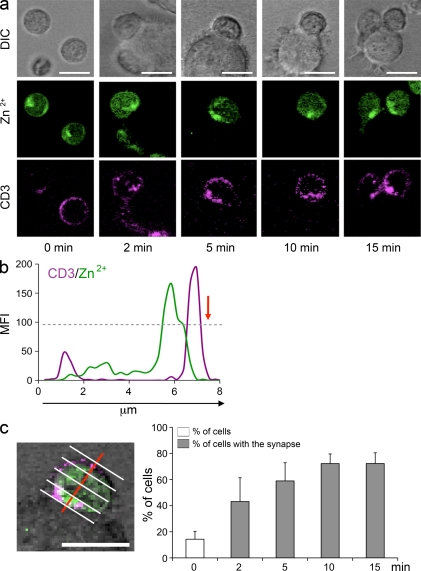
Figure 3. Subsynaptic accumulation of cytoplasmic zinc. (a) FluoZin-3–labeled CD4 T cells (green) were stained with anti-CD3 mAb (APC, purple), pelleted with TSST-1/SEB-loaded DC by centrifugation, and analyzed by confocal microscopy. DIC (top row) confocal images, FluoZin-3 fluorescence (middle row), and CD3 (bottom row) of representative T cells that had established contact with a DC are shown. Unstimulated isolated T cells (left) showed a patchy dispersed distribution of FluoZin-3 fluorescence (green). In CD4 T cells that had established a synapse with DCs, the green fluorescence was clustered in the subsynaptic region directly adjacent to the clustered CD3 molecules. (b) The image shows FluoZin-3 and CD3 fluorescence along a cross section perpendicular to the synapse (red arrow) through an individual T cell in contact with a DC 10 min after stimulation. (c) T cells were divided into quartiles parallel to the synaptic interphase (perpendicular to the red line) and FluoZin-3 MFIs were determined for each quartile. Subsynaptic accumulation of cytoplasmic zinc was defined as greater than twofold FluoZin-3 fluorescence intensities in the quartile next to the contact area compared with the distal quartile. Frequencies of T cells with accumulation of cytoplasmic zinc at indicated time points after stimulation are shown based on the analysis of >20 T cells forming a synapse with a DC (closed bars). Results are shown as mean ± SD frequencies obtained from four visual fields. FluoZin-3 fluorescence accumulation in a given quartile was found in 14% of isolated T cells not in contact with a DC (open bars). T cell stimulation significantly induced zinc sequestration in the subsynaptic region (P < 0.001). One experiment representative of four is shown. Bars, 10 µm.
Figure 3. Subsynaptic accumulation of cytoplasmic zinc. (a) FluoZin-3–labeled CD4 T cells (green) were stained with anti-CD3 mAb (APC, purple), pelleted with TSST-1/SEB-loaded DC by centrifugation, and analyzed by confocal microscopy. DIC (top row) confocal images, FluoZin-3 fluorescence (middle row), and CD3 (bottom row) of representative T cells that had established contact with a DC are shown. Unstimulated isolated T cells (left) showed a patchy dispersed distribution of FluoZin-3 fluorescence (green). In CD4 T cells that had established a synapse with DCs, the green fluorescence was clustered in the subsynaptic region directly adjacent to the clustered CD3 molecules. (b) The image shows FluoZin-3 and CD3 fluorescence along a cross section perpendicular to the synapse (red arrow) through an individual T cell in contact with a DC 10 min after stimulation. (c) T cells were divided into quartiles parallel to the synaptic interphase (perpendicular to the red line) and FluoZin-3 MFIs were determined for each quartile. Subsynaptic accumulation of cytoplasmic zinc was defined as greater than twofold FluoZin-3 fluorescence intensities in the quartile next to the contact area compared with the distal quartile. Frequencies of T cells with accumulation of cytoplasmic zinc at indicated time points after stimulation are shown based on the analysis of >20 T cells forming a synapse with a DC (closed bars). Results are shown as mean ± SD frequencies obtained from four visual fields. FluoZin-3 fluorescence accumulation in a given quartile was found in 14% of isolated T cells not in contact with a DC (open bars). T cell stimulation significantly induced zinc sequestration in the subsynaptic region (P < 0.001). One experiment representative of four is shown. Bars, 10 µm.CC BY-NC-SA · PubMed Central
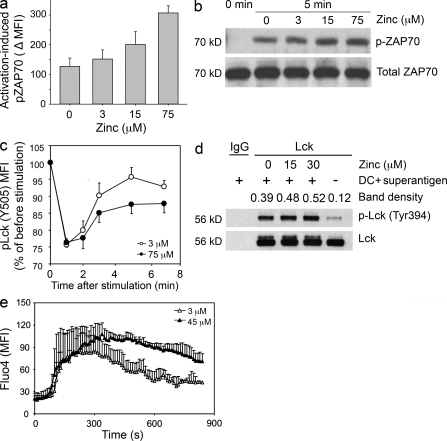
Figure 4. Activation-induced zinc influx augments TCR signaling. (a) CD4 T cells were stimulated for 5 min by copelleting with TSST/SEB-loaded DC in medium supplemented with 0, 3, 15, and 75 µM zinc. Phosphorylated ZAP70 levels in cell conjugates were quantified by Phosflow. Activation-induced increases in pZAP70 MFI are shown as mean ± SEM of three experiments. (b) Cell lysates from stimulated CD4 T cells were analyzed for pZAP70 by Western blotting. Membranes were stripped and reprobed for total ZAP70. One experiment representative of three is shown. (c) PBMCs were activated by CD3/CD28 cross-linking in medium supplemented with 3 µM (open circles) and 75 µM (closed circles) zinc. Cells were fixed at indicated time points, barcoded with different concentrations of Alexa Fluor 488–NHS, and analyzed for pLck (Y505). Results are shown as the pLck MFI in stimulated CD4 T cells as compared with unstimulated cells and represent mean ± SEM of seven experiments. (d) CD4 T cells were pelleted with TSST and DC in medium supplemented with 0, 15, and 30 µM zinc, incubated for 10 min, and lysed. Lck immune precipitates were analyzed for Y394 phosphorylation by Western blotting. One experiment representative of three is shown. (e) Fluo-4–labeled CD4+ T cells were co-cultured with DC pulsed with 10 ng/ml TSST-1 and 10 ng/ml SEB in medium supplemented with 3 µM (open triangles) and 45 µM (closed triangles) zinc. Fluo-4 fluorescence indicative of cytoplasmic calcium was monitored by live-cell imaging in individual cells that had established contact with a DC. Data are shown as mean ± SEM of 10 T cells and are representative of three independent experiments.
Figure 4. Activation-induced zinc influx augments TCR signaling. (a) CD4 T cells were stimulated for 5 min by copelleting with TSST/SEB-loaded DC in medium supplemented with 0, 3, 15, and 75 µM zinc. Phosphorylated ZAP70 levels in cell conjugates were quantified by Phosflow. Activation-induced increases in pZAP70 MFI are shown as mean ± SEM of three experiments. (b) Cell lysates from stimulated CD4 T cells were analyzed for pZAP70 by Western blotting. Membranes were stripped and reprobed for total ZAP70. One experiment representative of three is shown. (c) PBMCs were activated by CD3/CD28 cross-linking in medium supplemented with 3 µM (open circles) and 75 µM (closed circles) zinc. Cells were fixed at indicated time points, barcoded with different concentrations of Alexa Fluor 488–NHS, and analyzed for pLck (Y505). Results are shown as the pLck MFI in stimulated CD4 T cells as compared with unstimulated cells and represent mean ± SEM of seven experiments. (d) CD4 T cells were pelleted with TSST and DC in medium supplemented with 0, 15, and 30 µM zinc, incubated for 10 min, and lysed. Lck immune precipitates were analyzed for Y394 phosphorylation by Western blotting. One experiment representative of three is shown. (e) Fluo-4–labeled CD4+ T cells were co-cultured with DC pulsed with 10 ng/ml TSST-1 and 10 ng/ml SEB in medium supplemented with 3 µM (open triangles) and 45 µM (closed triangles) zinc. Fluo-4 fluorescence indicative of cytoplasmic calcium was monitored by live-cell imaging in individual cells that had established contact with a DC. Data are shown as mean ± SEM of 10 T cells and are representative of three independent experiments.CC BY-NC-SA · PubMed Central
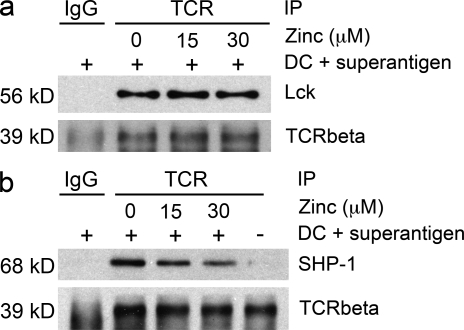
Figure 5. Zinc influx regulates SHP-1 recruitment to the TCR activation complex. CD4 T cells were stimulated with TSST and DC for 10 min in medium supplemented with 0, 15, and 30 µM zinc (lanes 2–4). Unstimulated T cells were included as control (lane 5). The TCR activation complex was immunoprecipitated with TCR-specific antibodies and the precipitate was probed for the amount of TCR-β chain, Lck (a), and SHP-1 (b) by Western blotting. Precipitation with secondary antibodies only was used as a control (lane 1). One experiment representative of three is shown.
Figure 5. Zinc influx regulates SHP-1 recruitment to the TCR activation complex. CD4 T cells were stimulated with TSST and DC for 10 min in medium supplemented with 0, 15, and 30 µM zinc (lanes 2–4). Unstimulated T cells were included as control (lane 5). The TCR activation complex was immunoprecipitated with TCR-specific antibodies and the precipitate was probed for the amount of TCR-β chain, Lck (a), and SHP-1 (b) by Western blotting. Precipitation with secondary antibodies only was used as a control (lane 1). One experiment representative of three is shown.CC BY-NC-SA · PubMed Central
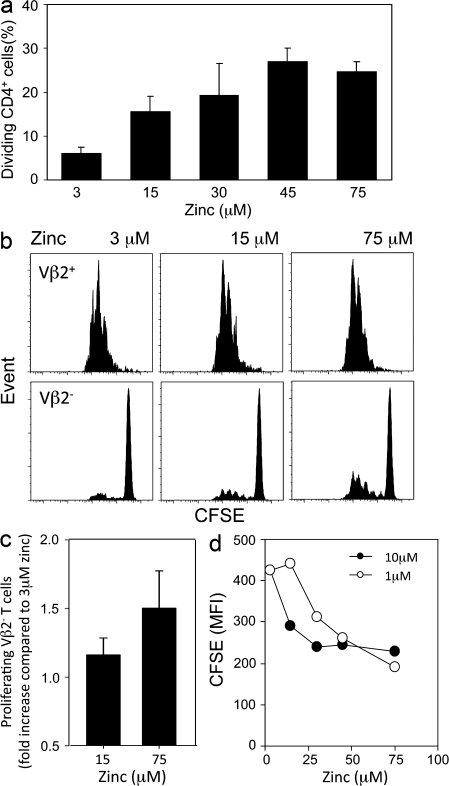
Figure 6. Zinc tunes TCR activation threshold. (a) CFSE-labeled CD4 T cells were stimulated with suboptimal concentrations of plate-bound anti-CD3/anti-CD28 antibodies in medium supplemented with ZnCl2 as indicated. CFSE histograms were used to determine the percentage of CD4 T cells that had entered cell cycle and divided. Results are representative of seven experiments and are shown as mean ± SD of quadruplicate wells. (b) CFSE-labeled CD4+CD45RA+ naive T cells were stimulated with mature DC and 0.04 ng/ml of TSST-1 at indicated zinc concentrations. Representative CFSE histograms of TCR Vβ2-positive and -negative CD4 T cells are shown. (c) The fraction of TSST low-avidity Vβ2− T cells that had entered cell division was determined. Data obtained with medium containing 15 and 75 µM zinc are expressed relative to the results obtained with 3 µM zinc and are shown as mean ± SD of 11 experiments. (d) 3.L2 TCR transgenic mouse splenocytes were labeled with CFSE and stimulated with 1 and 10 µM Hb64-76 peptide in zinc-supplemented medium. Results are shown as CFSE MFI on day 5 and are representative of three experiments.
Figure 6. Zinc tunes TCR activation threshold. (a) CFSE-labeled CD4 T cells were stimulated with suboptimal concentrations of plate-bound anti-CD3/anti-CD28 antibodies in medium supplemented with ZnCl2 as indicated. CFSE histograms were used to determine the percentage of CD4 T cells that had entered cell cycle and divided. Results are representative of seven experiments and are shown as mean ± SD of quadruplicate wells. (b) CFSE-labeled CD4+CD45RA+ naive T cells were stimulated with mature DC and 0.04 ng/ml of TSST-1 at indicated zinc concentrations. Representative CFSE histograms of TCR Vβ2-positive and -negative CD4 T cells are shown. (c) The fraction of TSST low-avidity Vβ2− T cells that had entered cell division was determined. Data obtained with medium containing 15 and 75 µM zinc are expressed relative to the results obtained with 3 µM zinc and are shown as mean ± SD of 11 experiments. (d) 3.L2 TCR transgenic mouse splenocytes were labeled with CFSE and stimulated with 1 and 10 µM Hb64-76 peptide in zinc-supplemented medium. Results are shown as CFSE MFI on day 5 and are representative of three experiments.CC BY-NC-SA · PubMed Central

Verification

Claims the paper makes

The claims and statistics of this paper haven’t been checked yet.

Run the check — free, no account needed. It reads the open-access text and checks the sources it cites.

A few free checks a day · papers already verified open instantly · results are public

Claims other papers make about this one

Each is checked against this paper’s own text: does it say what the citing paper says it does?

Self-check

Percentages, sums and reported differences re-computed from the paper’s own numbers.

The self-check needs the paper’s full text.

Citations

Cites

Show all 42 references

Cited by

See all 153

Metadata

Authors
Yu, M., Lee, W.-W., Tomar, D., Pryshchep, S., Czesnikiewicz-Guzik, M., Lamar, D. L., Li, G., Singh, K., Tian, L., Weyand, C. M., & Goronzy, J. J.
Affiliations
  • Division of Immunology and Rheumatology, Department of Medicine 1 , and 2
  • Lowance Center for Human Immunology, Emory University, Atlanta, GA 30322 3
Venue
Journal of Experimental Medicine
Published
2011-03-21
Volume
208
Issue
4
Pages
775-785
ISSN
  • 1540-9538
  • 0022-1007
Cited by
153
References
42
Language
en

About these checks

Registry, retraction, Cites and statistics results are computed, not judged, with one exception: a printed reference that no index lists is read once by a model before it counts as a citation error. Claims are extracted by a model and kept only when their quote appears verbatim in the text; each cited source is then checked, with a model’s help, for whether it says what the claim relies on. Those verdicts can be wrong — read the claim’s quote and the cited source before relying on one.

Statistics and arithmetic are recomputed, not judged.

Confidence bands are shown only for fields calibrated on our annotated test set. None is calibrated yet, so no band is shown.

What counts as a claim ›How we measure confidence ›How we check this ›

Are you an author, or do you see a problem with this page? Request a review

How to cite

Cite CoChat for the checks on this page, and the paper for its own findings.

This page
CoChat. (2026). Citation check: Regulation of T cell receptor signaling by activation-induced zinc influx. https://app.cochat.ai/papers/10.1084/jem.20100031
The paper
Yu, M., Lee, W.-W., Tomar, D., Pryshchep, S., Czesnikiewicz-Guzik, M., Lamar, D. L., Li, G., Singh, K., Tian, L., Weyand, C. M., & Goronzy, J. J. (2011). Regulation of T cell receptor signaling by activation-induced zinc influx. Journal of Experimental Medicine. https://doi.org/10.1084/jem.20100031

Data sources

Bibliographic data: Semantic Scholar, OpenAlex, Crossref.

Contains information from the Semantic Scholar Academic Graph Datasets, made available under the ODC Attribution License (ODC-BY 1.0).

Semantic Scholar’s data is described in: Kinney, R., et al. (2023). The Semantic Scholar Open Data Platform. arXiv:2301.10140.