Cited by 186Skin and Cellular Biology ResearchDermatology and Skin DiseasesGenetic and rare skin diseases.

The DOI matches its Crossref record; 70 of the 70 references it cites were found in a registry or an index.

Epidermal ADAM17 maintains the skin barrier by regulating EGFR ligand–dependent terminal keratinocyte differentiation

Open access

Abstract

ADAM17 (a disintegrin and metalloproteinase 17) is ubiquitously expressed and cleaves membrane proteins, such as epidermal growth factor receptor (EGFR) ligands, l-selectin, and TNF, from the cell surface, thus regulating responses to tissue injury and inflammation. However, little is currently known about its role in skin homeostasis. We show that mice lacking ADAM17 in keratinocytes (A17ΔKC) have a normal epidermal barrier and skin architecture at birth but develop pronounced defects in epidermal barrier integrity soon after birth and develop chronic dermatitis as adults. The dysregulated expression of epidermal differentiation proteins becomes evident 2 d after birth, followed by reduced transglutaminase (TGM) activity, transepidermal water loss, up-regulation of the proinflammatory cytokine IL-36α, and inflammatory immune cell infiltration. Activation of the EGFR was strongly reduced in A17ΔKC skin, and topical treatment of A17ΔKC mice with recombinant TGF-α significantly improved TGM activity and decreased skin inflammation. Finally, we show that mice lacking the EGFR in keratinocytes (EgfrΔKC) closely resembled A17ΔKC mice. Collectively, these results identify a previously unappreciated critical role of the ADAM17–EGFR signaling axis in maintaining the homeostasis of the postnatal epidermal barrier and suggest that this pathway could represent a good target for treatment of epidermal barrier defects.

Overview

The claims and statistics of this paper haven’t been checked yet.

Run the check — free, no account needed. It reads the open-access text and checks the sources it cites.

A few free checks a day · papers already verified open instantly · results are public

Integrity signals

Registry

Crossref · 10.1084/jem.20112258

Cites

70 of 70 references verified0 citation errors · 0 not checkable

Statistics

Figures

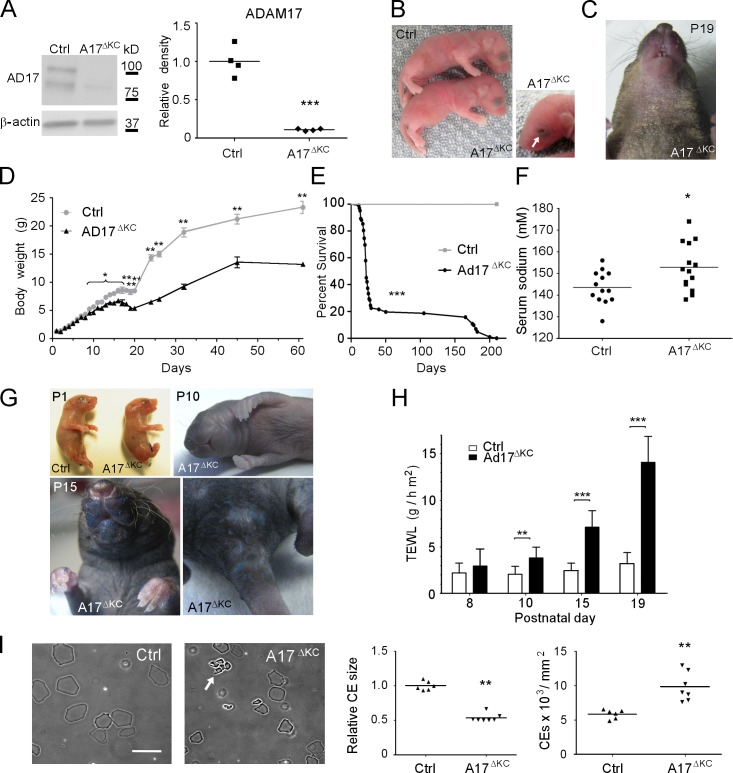
Figure 1. Keratinocyte-specific ADAM17 deficiency results in postnatal epidermal barrier defects. (A) Western blot analysis to detect ADAM17 in lysates from P3 epidermal splits of control (Ctrl) or A17ΔKC mice. (B) Newborn A17ΔKC mice and their littermate controls. 7.5% of A17ΔKC newborn mice had open eyes at birth, indicated by arrow. (C) Dry scaly skin of A17ΔKC mice at P19. (D) Body weight of A17ΔKC versus control mice at different ages (n ≥ 4). (E) Survival curve of A17ΔKC mice (n = 100) versus controls (Ctrl, n = 25). Mantel-Cox test: ***, P < 0.001. (F) Serum sodium concentration of A17ΔKC versus control mice between P15 and P25. (G) Toluidine blue dye penetration assays were performed with newborn mice (P1), P10, and P15 animals indicating outside-in barrier defects (n = 3 per age group). Blue staining of the umbilical cord and the cut tail at P1 is a positive control. (H) TEWL in A17ΔKC and control littermates at P8, P10, P15, and P19 (n ≥ 4 for P8; n ≥ 8 for P10, P15, and P19). (I) Preparation of CEs from 25-mm2 P15 back skin samples. CE clustering is indicated by the arrow. Results: mean ± SD. Student’s t test: *, P < 0.05; **, P < 0.01; ***, P < 0.001. Bar, 20 µm.
Figure 1. Keratinocyte-specific ADAM17 deficiency results in postnatal epidermal barrier defects. (A) Western blot analysis to detect ADAM17 in lysates from P3 epidermal splits of control (Ctrl) or A17ΔKC mice. (B) Newborn A17ΔKC mice and their littermate controls. 7.5% of A17ΔKC newborn mice had open eyes at birth, indicated by arrow. (C) Dry scaly skin of A17ΔKC mice at P19. (D) Body weight of A17ΔKC versus control mice at different ages (n ≥ 4). (E) Survival curve of A17ΔKC mice (n = 100) versus controls (Ctrl, n = 25). Mantel-Cox test: ***, P < 0.001. (F) Serum sodium concentration of A17ΔKC versus control mice between P15 and P25. (G) Toluidine blue dye penetration assays were performed with newborn mice (P1), P10, and P15 animals indicating outside-in barrier defects (n = 3 per age group). Blue staining of the umbilical cord and the cut tail at P1 is a positive control. (H) TEWL in A17ΔKC and control littermates at P8, P10, P15, and P19 (n ≥ 4 for P8; n ≥ 8 for P10, P15, and P19). (I) Preparation of CEs from 25-mm2 P15 back skin samples. CE clustering is indicated by the arrow. Results: mean ± SD. Student’s t test: *, P < 0.05; **, P < 0.01; ***, P < 0.001. Bar, 20 µm.CC BY-NC-SA · PubMed Central
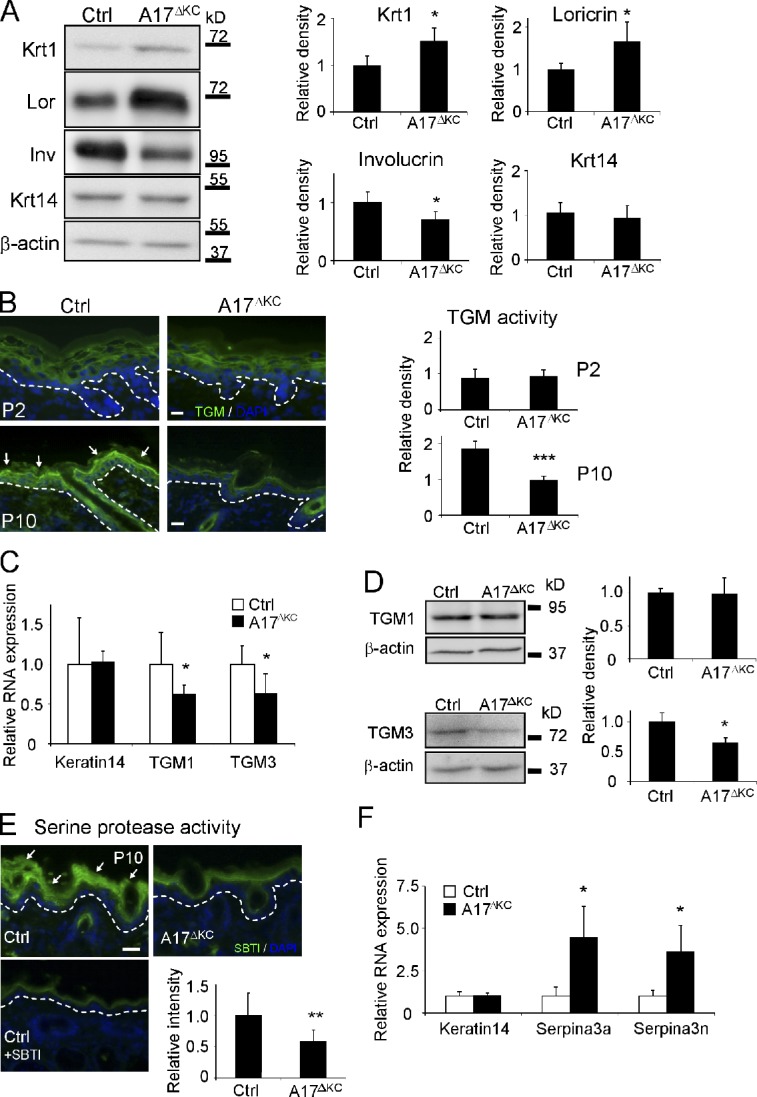
Figure 2. Decreased TGM activity and altered expression of epidermal differentiation markers in A17ΔKC skin. (A) Western blots of epidermis lysates analyzing epidermal keratin1, keratin14, loricrin, and involucrin expression in A17ΔKC skin (quantification: n = 5). (B) In situ detection of TGM activity in A17ΔKC and control epidermis at P2 and P10, with TGM activity in the stratum granulosum of control epidermis indicated by arrows (quantification: n = 6). (C) Quantitative RT-PCR from total RNA of P10 A17ΔKC skin analyzing TGM1, TGM3, and keratin14 (n = 4). (D) Quantitative immunoblot analysis from P10 skin lysates analyzing TGM1 and TGM3 in A17ΔKC animals (n = 4). (E) Detection of serine protease activity in P10 skin with SBTI Alexa Fluor 488 conjugates in the stratum granulosum and stratum corneum in control skin (arrows) and in A17ΔKC skin (n = 3). The negative controls with an excess of unlabeled SBTI resulted in diminished signals. (F) RT-PCR analysis from total RNA derived from P10 skin for serpina3a, serpina3n, and keratin14 (n = 4). The dashed lines in B and E represent the basement membrane. Bars, 20 µm. Results: mean ± SD. Students t test: *, P < 0.05; **, P < 0.01; ***, P < 0.001.
Figure 2. Decreased TGM activity and altered expression of epidermal differentiation markers in A17ΔKC skin. (A) Western blots of epidermis lysates analyzing epidermal keratin1, keratin14, loricrin, and involucrin expression in A17ΔKC skin (quantification: n = 5). (B) In situ detection of TGM activity in A17ΔKC and control epidermis at P2 and P10, with TGM activity in the stratum granulosum of control epidermis indicated by arrows (quantification: n = 6). (C) Quantitative RT-PCR from total RNA of P10 A17ΔKC skin analyzing TGM1, TGM3, and keratin14 (n = 4). (D) Quantitative immunoblot analysis from P10 skin lysates analyzing TGM1 and TGM3 in A17ΔKC animals (n = 4). (E) Detection of serine protease activity in P10 skin with SBTI Alexa Fluor 488 conjugates in the stratum granulosum and stratum corneum in control skin (arrows) and in A17ΔKC skin (n = 3). The negative controls with an excess of unlabeled SBTI resulted in diminished signals. (F) RT-PCR analysis from total RNA derived from P10 skin for serpina3a, serpina3n, and keratin14 (n = 4). The dashed lines in B and E represent the basement membrane. Bars, 20 µm. Results: mean ± SD. Students t test: *, P < 0.05; **, P < 0.01; ***, P < 0.001.CC BY-NC-SA · PubMed Central
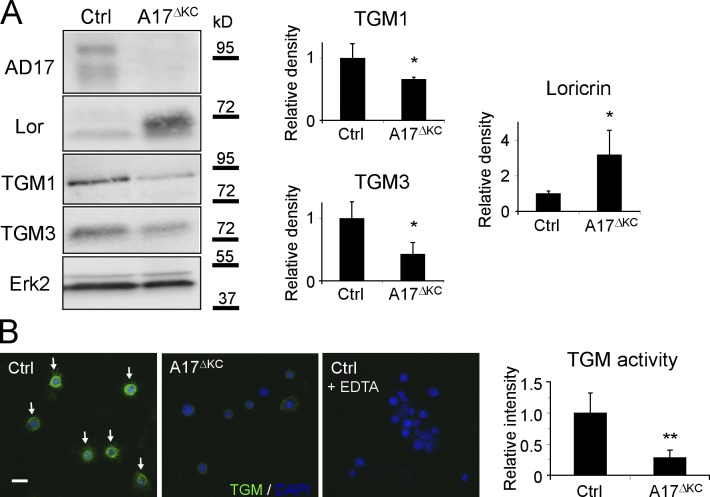
Figure 3. A17ΔKC keratinocytes exhibit cell autonomous dysregulated terminal differentiation. (A) Western blot of keratinocytes for expression of ADAM17 (AD17), TGMs 1 and 3, and loricrin (Lor) in A17ΔKC keratinocytes and controls (Ctrl). n = 3. (B) In vitro TGM activity in 24-h suspension-cultured control keratinocytes (arrows) and in A17ΔKC keratinocytes (n = 6). Wild-type keratinocytes probed with an excess of EDTA served as negative control. Bar, 20 µm. Results: mean ± SD, students t test: *, P < 0.05; **, P < 0.01.
Figure 3. A17ΔKC keratinocytes exhibit cell autonomous dysregulated terminal differentiation. (A) Western blot of keratinocytes for expression of ADAM17 (AD17), TGMs 1 and 3, and loricrin (Lor) in A17ΔKC keratinocytes and controls (Ctrl). n = 3. (B) In vitro TGM activity in 24-h suspension-cultured control keratinocytes (arrows) and in A17ΔKC keratinocytes (n = 6). Wild-type keratinocytes probed with an excess of EDTA served as negative control. Bar, 20 µm. Results: mean ± SD, students t test: *, P < 0.05; **, P < 0.01.CC BY-NC-SA · PubMed Central
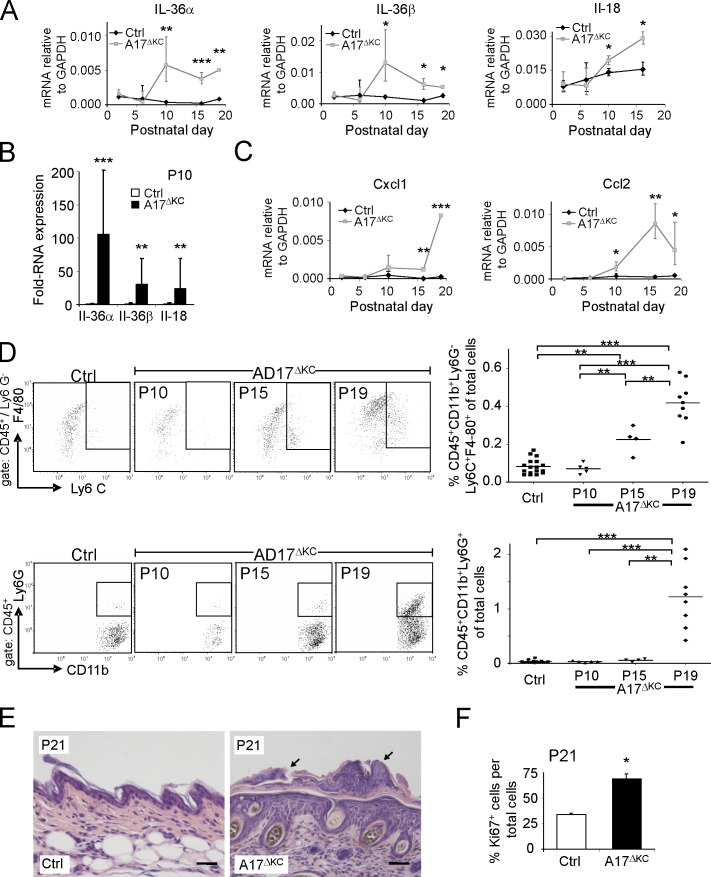
Figure 4. Skin barrier defects result in increased IL-36α, immune cell infiltration, and epidermal thickening. (A) qPCR analysis of P2-P19 skin for IL-36α, IL-36β, and IL-18. (B) qPCR analysis of P10 epidermis for IL-36α, IL-36β, and IL-18 (n = 4). (C) qPCR analysis of P2–P19 skin for CCL2, and CXCL1 relative to GAPDH. n ≥ 3. (D) Flow cytometry of skin cell suspensions gated for CD45+ and further analyzed for neutrophils (CD11b+Ly6G+) and inflammatory macrophages (CD11b+Ly6G−Ly6C+F4/80+). P10 (n = 5), P15 (n = 4), and P19 (n ≥ 8) are shown. (E) Sections of H&E-stained A17ΔKC skin at P21 showed neutrophil accumulation on the surface and adjacent to hair follicles (black arrows). (F) Percentage of Ki67-positive keratinocytes in A17ΔKC skin at P21 (n = 3). Bars, 50 µm. Results: mean ± SD. Student’s t test: *, P < 0.05; **, P < 0.01; ***, P < 0.001.
Figure 4. Skin barrier defects result in increased IL-36α, immune cell infiltration, and epidermal thickening. (A) qPCR analysis of P2-P19 skin for IL-36α, IL-36β, and IL-18. (B) qPCR analysis of P10 epidermis for IL-36α, IL-36β, and IL-18 (n = 4). (C) qPCR analysis of P2–P19 skin for CCL2, and CXCL1 relative to GAPDH. n ≥ 3. (D) Flow cytometry of skin cell suspensions gated for CD45+ and further analyzed for neutrophils (CD11b+Ly6G+) and inflammatory macrophages (CD11b+Ly6G−Ly6C+F4/80+). P10 (n = 5), P15 (n = 4), and P19 (n ≥ 8) are shown. (E) Sections of H&E-stained A17ΔKC skin at P21 showed neutrophil accumulation on the surface and adjacent to hair follicles (black arrows). (F) Percentage of Ki67-positive keratinocytes in A17ΔKC skin at P21 (n = 3). Bars, 50 µm. Results: mean ± SD. Student’s t test: *, P < 0.05; **, P < 0.01; ***, P < 0.001.CC BY-NC-SA · PubMed Central
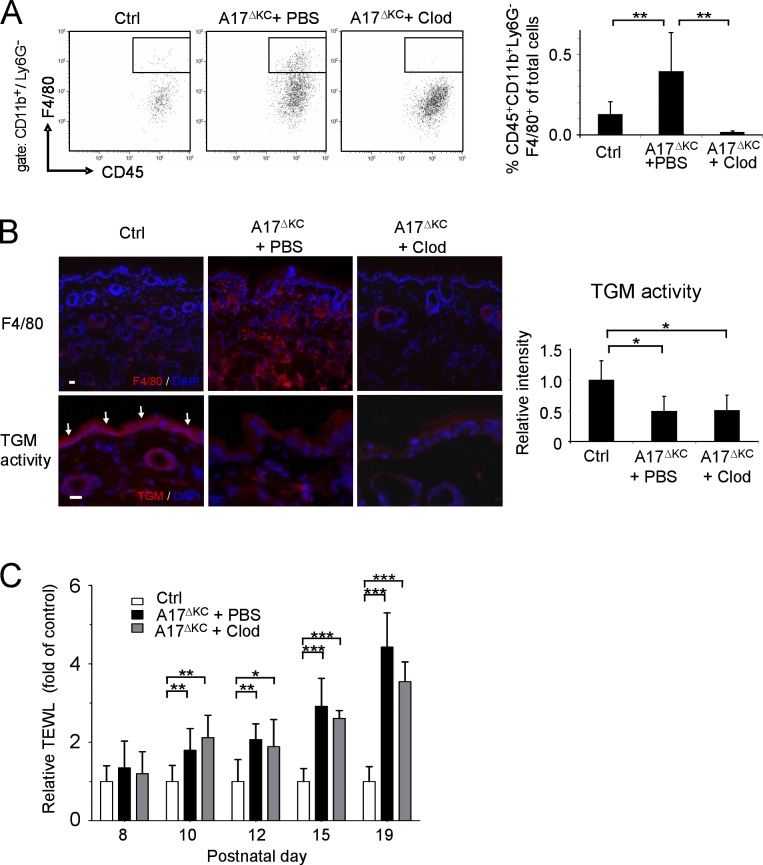
Figure 5. Infiltrating skin macrophages do not cause the skin barrier defects in A17ΔKC mice. For depletion of dermal macrophages, A17ΔKC mice were subcutaneously injected with clodronate-loaded liposomes (A17ΔKC + Clod) or PBS-loaded liposomes (A17ΔKC + PBS, Ctrl) into the back skin. (A) Flow cytometry of skin macrophages at P19 gated for CD11b+Ly6G− and further analyzed for skin macrophages (CD45+F4/80+; n = 5). (B) Immunofluorescence staining of A17ΔKC skin with anti-F4/80 antibodies to detect macrophages (top) and for TGM activity (bottom, arrows in Ctrl; n ≥ 5 per group). Bars, 20 µm. (C) TEWL from the back skin of A17ΔKC mice injected with clodronate-loaded (A17ΔKC + Clod) or control (A17ΔKC + PBS) liposomes and from control mice was detected from P8 to P19 (n ≥ 5 per group). Data are mean ± SD. *, P < 0.05; **, P < 0.01; ***, P < 0.001.
Figure 5. Infiltrating skin macrophages do not cause the skin barrier defects in A17ΔKC mice. For depletion of dermal macrophages, A17ΔKC mice were subcutaneously injected with clodronate-loaded liposomes (A17ΔKC + Clod) or PBS-loaded liposomes (A17ΔKC + PBS, Ctrl) into the back skin. (A) Flow cytometry of skin macrophages at P19 gated for CD11b+Ly6G− and further analyzed for skin macrophages (CD45+F4/80+; n = 5). (B) Immunofluorescence staining of A17ΔKC skin with anti-F4/80 antibodies to detect macrophages (top) and for TGM activity (bottom, arrows in Ctrl; n ≥ 5 per group). Bars, 20 µm. (C) TEWL from the back skin of A17ΔKC mice injected with clodronate-loaded (A17ΔKC + Clod) or control (A17ΔKC + PBS) liposomes and from control mice was detected from P8 to P19 (n ≥ 5 per group). Data are mean ± SD. *, P < 0.05; **, P < 0.01; ***, P < 0.001.CC BY-NC-SA · PubMed Central
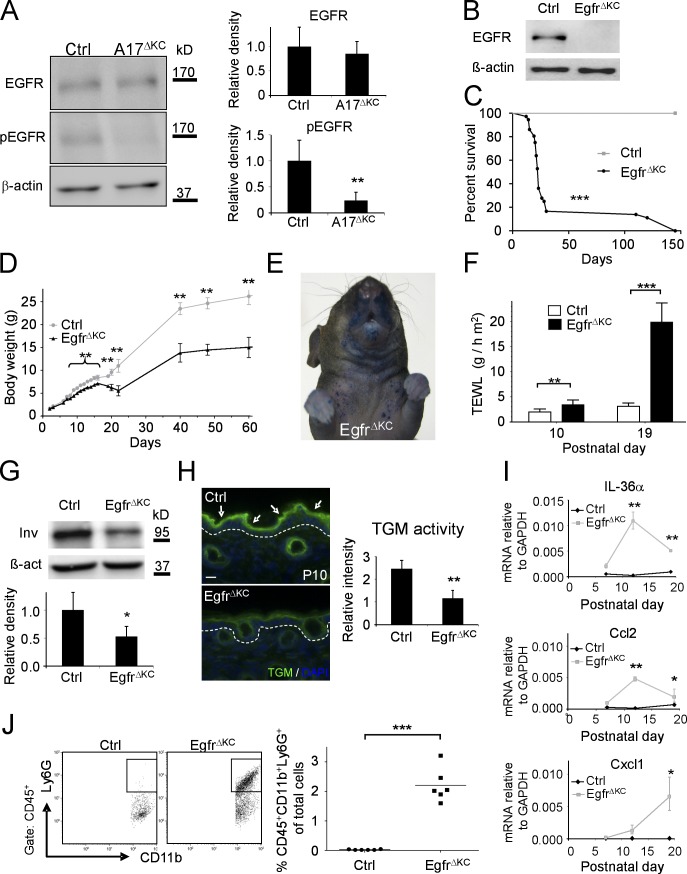
Figure 6. EgfrΔKC mice have similar epidermal differentiation and barrier defects as A17ΔKC mice. (A) Western blot of A17ΔKC skin lysates for phospho-EGFR (pEGFR) and total EGFR compared with controls (Ctrl; n = 4). (B) Immunoblot analysis of epidermal splits of EgfrΔKC skin for EGFR. (C) Survival curve of control (Crtl) versus EgfrΔKC littermate mice (n = 30). Mantel-Cox test: ***, P < 0.001. (D) Body weight of EgfrΔKC versus control mice at different ages (n ≥ 4). (E) Pronounced toluidine blue dye penetration around the snout and the upper trunk of P15 EgfrΔKC animals (representative of three animals). (F) TEWL from EgfrΔKC mice compared with controls at P10 and P19 (n ≥ 4). (G) Western blot of P3 back skin with involucrin antibodies in EgfrΔKC versus control skin (Ctrl). n ≥ 3. (H) In situ TGM activity (arrows) in P10 skin from EgfrΔKC epidermis compared with controls (Ctrl; n = 3). The dashed line represents the basement membrane. Bar, 20 µm. (I) qPCR with total RNA from P7, P12, and P19 skin for IL36α, Ccl2, and Cxcl1. (J) Flow cytometry of P19 skin cell suspensions for neutrophilic infiltrates (CD45+CD11b+Ly6G+; n = 6). Results: mean ± SD. Student’s t test: *, P < 0.05; **, P < 0.01; ***, P < 0.001.
Figure 6. EgfrΔKC mice have similar epidermal differentiation and barrier defects as A17ΔKC mice. (A) Western blot of A17ΔKC skin lysates for phospho-EGFR (pEGFR) and total EGFR compared with controls (Ctrl; n = 4). (B) Immunoblot analysis of epidermal splits of EgfrΔKC skin for EGFR. (C) Survival curve of control (Crtl) versus EgfrΔKC littermate mice (n = 30). Mantel-Cox test: ***, P < 0.001. (D) Body weight of EgfrΔKC versus control mice at different ages (n ≥ 4). (E) Pronounced toluidine blue dye penetration around the snout and the upper trunk of P15 EgfrΔKC animals (representative of three animals). (F) TEWL from EgfrΔKC mice compared with controls at P10 and P19 (n ≥ 4). (G) Western blot of P3 back skin with involucrin antibodies in EgfrΔKC versus control skin (Ctrl). n ≥ 3. (H) In situ TGM activity (arrows) in P10 skin from EgfrΔKC epidermis compared with controls (Ctrl; n = 3). The dashed line represents the basement membrane. Bar, 20 µm. (I) qPCR with total RNA from P7, P12, and P19 skin for IL36α, Ccl2, and Cxcl1. (J) Flow cytometry of P19 skin cell suspensions for neutrophilic infiltrates (CD45+CD11b+Ly6G+; n = 6). Results: mean ± SD. Student’s t test: *, P < 0.05; **, P < 0.01; ***, P < 0.001.CC BY-NC-SA · PubMed Central
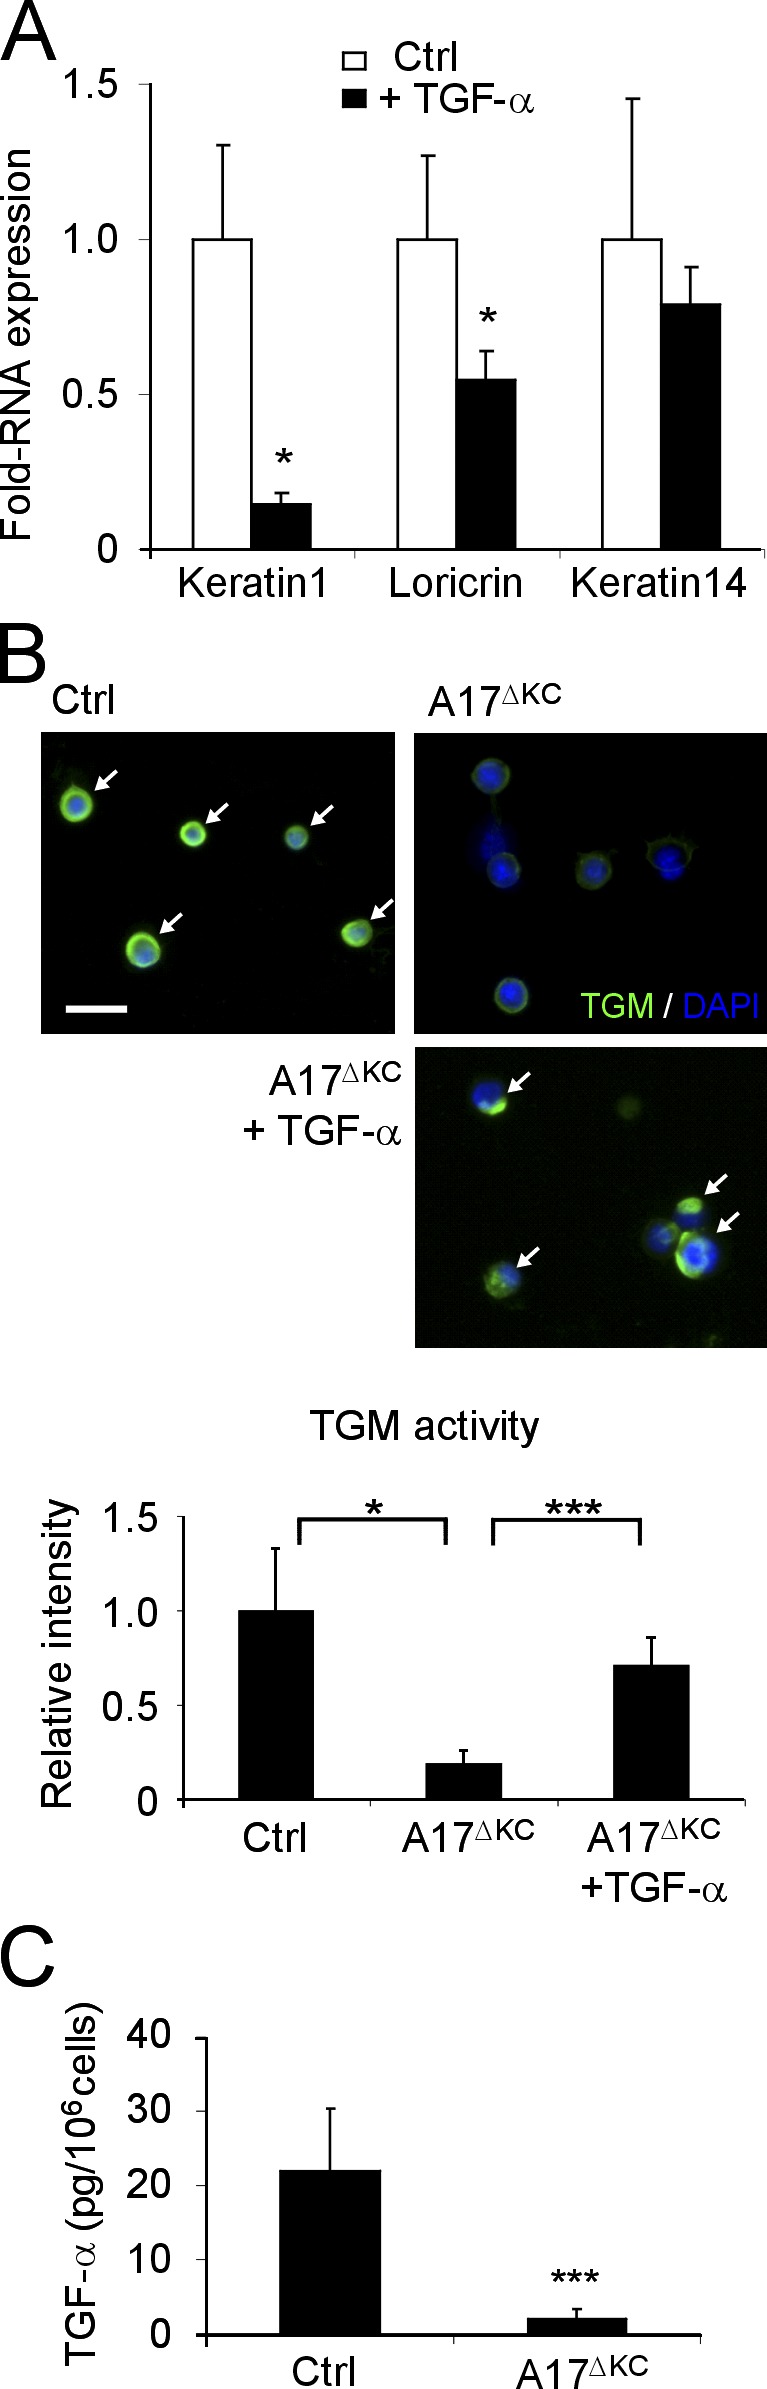
Figure 7. EGFR stimulation with TGF-α regulates terminal differentiation. (A) ECM-disrupted keratinocyte suspensions were incubated with and without 40 ng/ml TGF-α for 48 h, and total RNA was then analyzed by qPCR for keratin1, loricrin, and keratin14 (n = 3). (B) Suspension cultured keratinocytes analyzed for in vitro TGM activity (arrows). Bar, 20 µm. A17ΔKC keratinocytes were cultured with 40 ng/ml TGF-α when indicated (n = 3 per group). (C) TGF-α ELISA in the supernatants of control and A17ΔKC keratinocytes cultured for 24 h (n = 7). Results: mean ± SD. Student’s t test: *, P < 0.05; ***, P < 0.001.
Figure 7. EGFR stimulation with TGF-α regulates terminal differentiation. (A) ECM-disrupted keratinocyte suspensions were incubated with and without 40 ng/ml TGF-α for 48 h, and total RNA was then analyzed by qPCR for keratin1, loricrin, and keratin14 (n = 3). (B) Suspension cultured keratinocytes analyzed for in vitro TGM activity (arrows). Bar, 20 µm. A17ΔKC keratinocytes were cultured with 40 ng/ml TGF-α when indicated (n = 3 per group). (C) TGF-α ELISA in the supernatants of control and A17ΔKC keratinocytes cultured for 24 h (n = 7). Results: mean ± SD. Student’s t test: *, P < 0.05; ***, P < 0.001.CC BY-NC-SA · PubMed Central
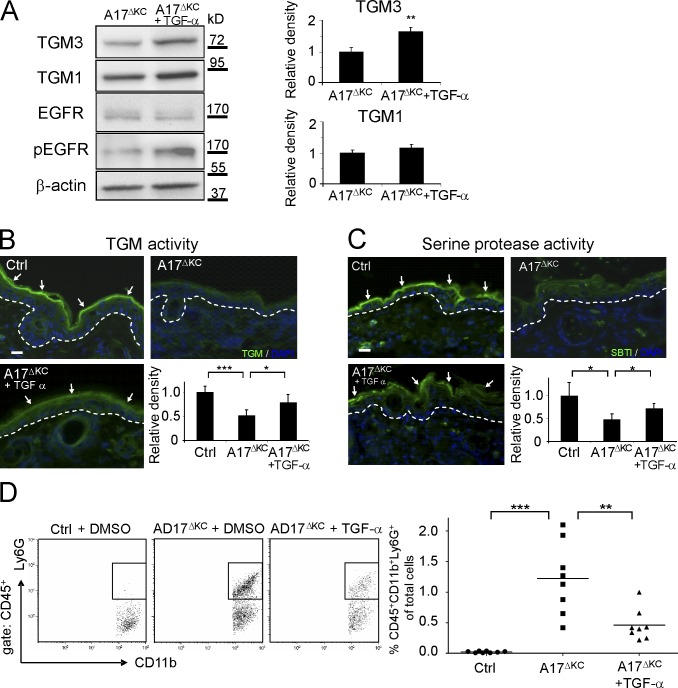
Figure 8. Application of TGF-α reconstitutes the skin barrier. (A) Immunoblot analysis of DMSO control versus TGF-α–treated A17ΔKC skin (n = 4). (B) TGM activity (arrows) in P19 control or A17ΔKC skin treated with TGF-α (n = 5 per group). (C) Serine protease activity (detected with SBTI Alexa Fluor 488 conjugates; arrows) in control or A17ΔKC skin treated with TGF-α (n = 3). The dashed lines in B and C represent the basement membrane. (D) For flow cytometric detection, the skin cell suspensions were gated for CD45 and further analyzed for neutrophils (CD11b+Ly6G+; n = 8 per group). Results: mean ± SD. Student’s t test: *, P < 0.05; **, P < 0.01; ***, P < 0.001. Bars, 20 µm.
Figure 8. Application of TGF-α reconstitutes the skin barrier. (A) Immunoblot analysis of DMSO control versus TGF-α–treated A17ΔKC skin (n = 4). (B) TGM activity (arrows) in P19 control or A17ΔKC skin treated with TGF-α (n = 5 per group). (C) Serine protease activity (detected with SBTI Alexa Fluor 488 conjugates; arrows) in control or A17ΔKC skin treated with TGF-α (n = 3). The dashed lines in B and C represent the basement membrane. (D) For flow cytometric detection, the skin cell suspensions were gated for CD45 and further analyzed for neutrophils (CD11b+Ly6G+; n = 8 per group). Results: mean ± SD. Student’s t test: *, P < 0.05; **, P < 0.01; ***, P < 0.001. Bars, 20 µm.CC BY-NC-SA · PubMed Central
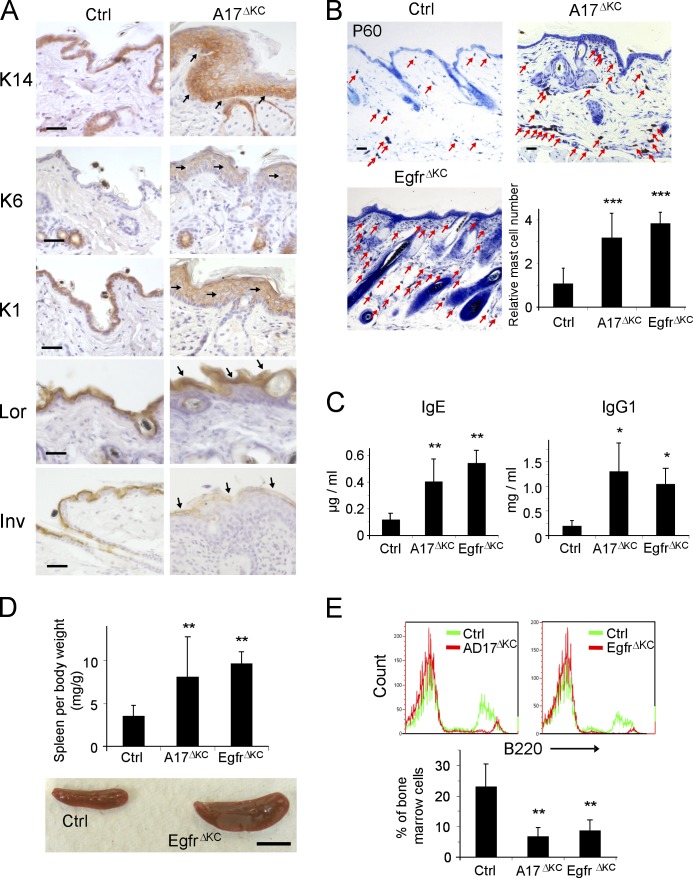
Figure 9. Prolonged epidermal ADAM17 deficiency leads to chronic dermatitis. (A) Immunohistological staining of P60 epidermis with antibodies against the basal keratinocyte marker keratin14, hyperproliferation marker keratin 6, the early differentiation marker keratin1, and the terminal differentiation markers involucrin and loricrin. Arrows indicate staining localization. (B) Toluidine blue staining of back skin sections revealed a pronounced dermal accumulation of mast cells (arrows; n = 4). Bars: (A and B) 50 µm. (C) Concentrations of IgE and IgG1, measured by ELISA in serum of P60 animals (n ≥ 3). (D) Spleen weight in control, A17ΔKC, and EgfrΔKC animals (n = 14). Bar, 1 cm. (E) Anti-B220 PE-stained B cell populations compared with controls in bone marrow flow cytometry (n ≥ 4). Data are mean ± SD. *, P < 0.05; **, P < 0.01; ***, P < 0.001.
Figure 9. Prolonged epidermal ADAM17 deficiency leads to chronic dermatitis. (A) Immunohistological staining of P60 epidermis with antibodies against the basal keratinocyte marker keratin14, hyperproliferation marker keratin 6, the early differentiation marker keratin1, and the terminal differentiation markers involucrin and loricrin. Arrows indicate staining localization. (B) Toluidine blue staining of back skin sections revealed a pronounced dermal accumulation of mast cells (arrows; n = 4). Bars: (A and B) 50 µm. (C) Concentrations of IgE and IgG1, measured by ELISA in serum of P60 animals (n ≥ 3). (D) Spleen weight in control, A17ΔKC, and EgfrΔKC animals (n = 14). Bar, 1 cm. (E) Anti-B220 PE-stained B cell populations compared with controls in bone marrow flow cytometry (n ≥ 4). Data are mean ± SD. *, P < 0.05; **, P < 0.01; ***, P < 0.001.CC BY-NC-SA · PubMed Central

Verification

Claims the paper makes

The claims and statistics of this paper haven’t been checked yet.

Run the check — free, no account needed. It reads the open-access text and checks the sources it cites.

A few free checks a day · papers already verified open instantly · results are public

Claims other papers make about this one

Each is checked against this paper’s own text: does it say what the citing paper says it does?

Self-check

Percentages, sums and reported differences re-computed from the paper’s own numbers.

The self-check needs the paper’s full text.

Citations

Cites

Show all 70 references

Cited by

Sorted by citations

See all 186

Metadata

Authors
Franzke, C.-W., Cobzaru, C., Triantafyllopoulou, A., Löffek, S., Horiuchi, K., Threadgill, D. W., Kurz, T., van Rooijen, N., Bruckner-Tuderman, L., & Blobel, C. P.
Affiliations
  • University of Freiburg (DE)
  • Keio University (JP)
  • North Carolina State University (US)
  • Vrije Universiteit Amsterdam (NL)
  • Department of Dermatology 1 and 2
  • Hospital for Special Surgery (US)
Corresponding author
  • Franzke, Claus-Werner
  • Blobel, Carl P.
Venue
Journal of Experimental Medicine
Published
2012-05-07
Volume
209
Issue
6
Pages
1105-1119
ISSN
  • 0022-1007 (ISSN-L)
  • 1540-9538
OpenAlex
W2141275577
Cited by
186
References
70
Citations by year
2026: 8 · 2025: 11 · 2024: 11 · 2023: 8 · 2022: 16 · 2021: 11 · 2020: 12 · 2019: 17 · 2018: 12 · 2017: 11 · 2016: 10 · 2015: 16 · 2014: 19 · 2013: 22 · 2012: 2
FWCI
8.94
Type
journal article
Language
en
Open access
Locations
  • The Journal of Experimental Medicine (publishedVersion)
  • Europe PMC (PubMed Central) (publishedVersion, cc-by-nc-sa)
  • PubMed Central (publishedVersion, cc-by-nc-sa)
  • PubMed (publishedVersion)
  • Amsterdam UMC (VU Amsterdam) - Institutional Repository (publishedVersion, other-oa)
  • Digital Academic REpository of VU University Amsterdam (Vrije Universiteit Amsterdam) (submittedVersion)
  • Pure Amsterdam UMC (submittedVersion, other-oa)
  • Data Archiving and Networked Services (DANS) (submittedVersion, other-oa)
Funders
  • European Commission (268390)
  • Deutsche Forschungsgemeinschaft (SFB-850/B6, SFB850)
  • Albert-Ludwigs-Universität Freiburg
  • National Institutes of Health (NIH-R01)
  • Medizinische Fakultät der Albert-Ludwigs-Universität Freiburg
  • National Cancer Institute (R01CA092479)
  • National Institute of General Medical Sciences (R01GM064750, GM-64750)
Topics
  • Life Sciences › Biochemistry, Genetics and Molecular Biology › Cell Biology › Skin and Cellular Biology Research
  • Health Sciences › Medicine › Dermatology › Dermatology and Skin Diseases
  • Health Sciences › Medicine › Dermatology › Genetic and rare skin diseases.
Keywords
ADAM17, epidermal growth factor receptor, skin barrier, keratinocyte differentiation, transglutaminase, transepidermal water loss, IL-36α, skin inflammation, chronic dermatitis, transforming growth factor-alpha
MeSH terms
ADAM17 Protein, Epidermal Cells, Administration, Topical, Animals, Animals, Newborn, Cell Differentiation, Dermatitis, Atopic, Epidermis, Interleukin-1, Macrophages, Mice, Mutant Strains, Transglutaminases, Skin, Keratinocytes, Transforming Growth Factor alpha, Gene Expression Regulation, Developmental, Mice, ADAM Proteins, ErbB Receptors

About these checks

Registry, retraction, Cites and statistics results are computed, not judged, with one exception: a printed reference that no index lists is read once by a model before it counts as a citation error. Claims are extracted by a model and kept only when their quote appears verbatim in the text; each cited source is then checked, with a model’s help, for whether it says what the claim relies on. Those verdicts can be wrong — read the claim’s quote and the cited source before relying on one.

Statistics and arithmetic are recomputed, not judged.

Confidence bands are shown only for fields calibrated on our annotated test set. None is calibrated yet, so no band is shown.

What counts as a claim ›How we measure confidence ›How we check this ›

Are you an author, or do you see a problem with this page? Request a review