

The DOI matches its Crossref record; 35 of the 35 references it cites were found in a registry or an index.
PDK1 regulation of mTOR and hypoxia-inducible factor 1 integrate metabolism and migration of CD8+ T cells
Open accessAbstract
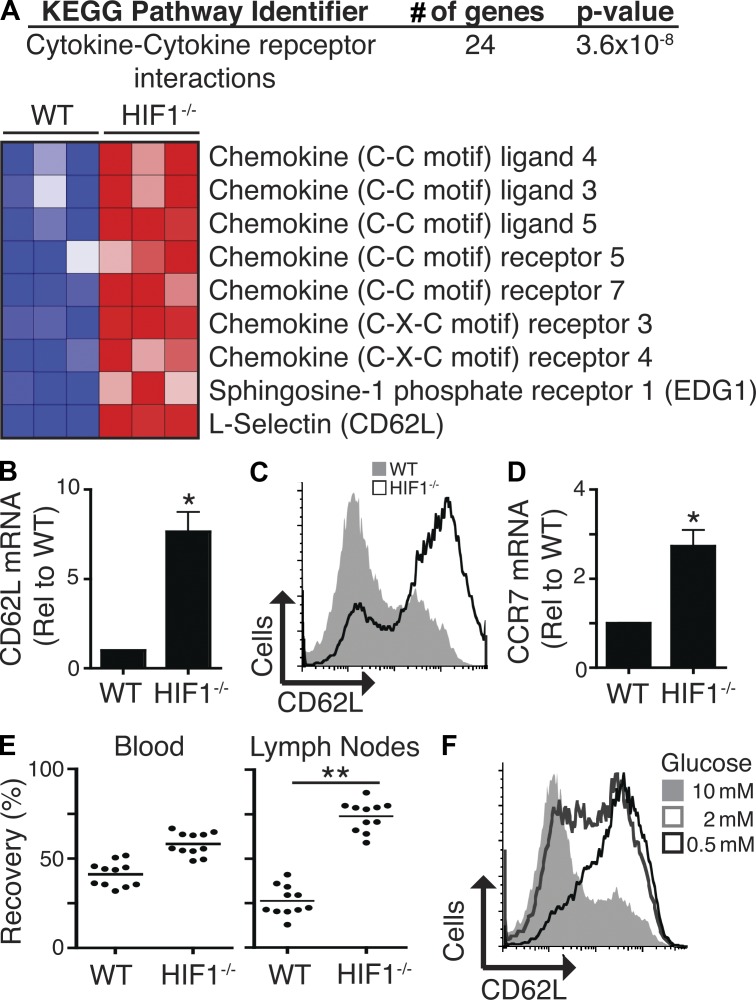
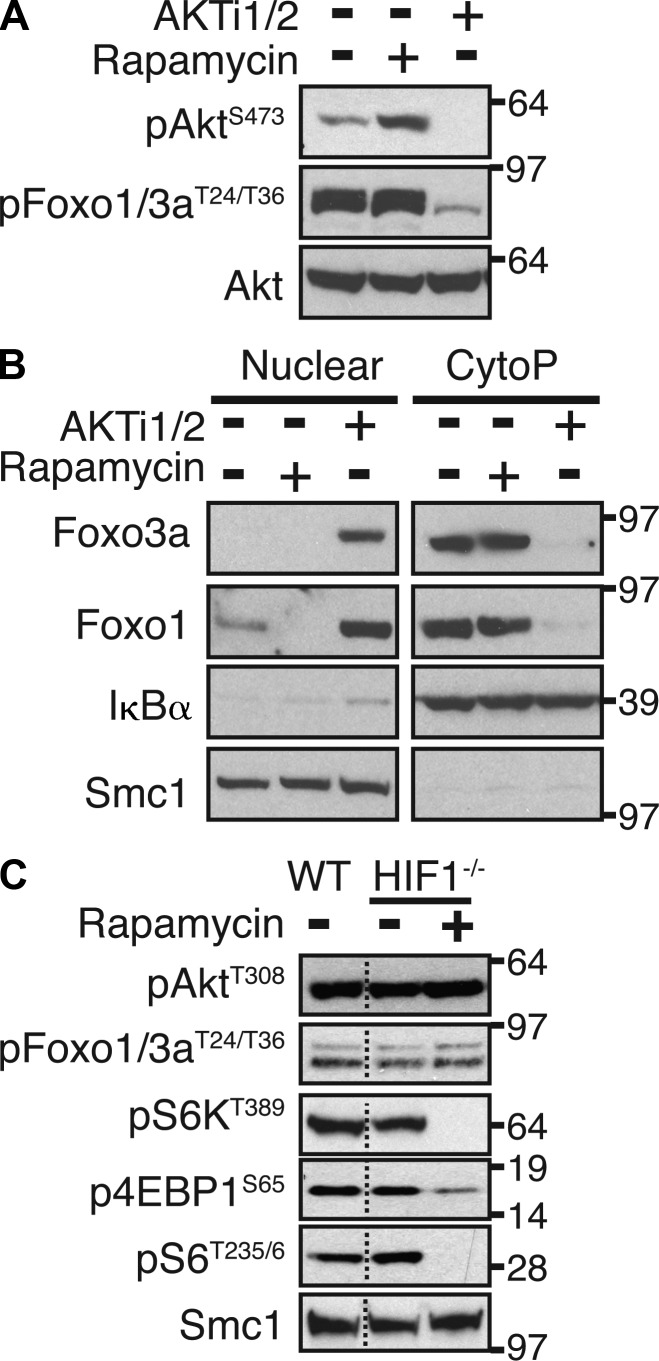
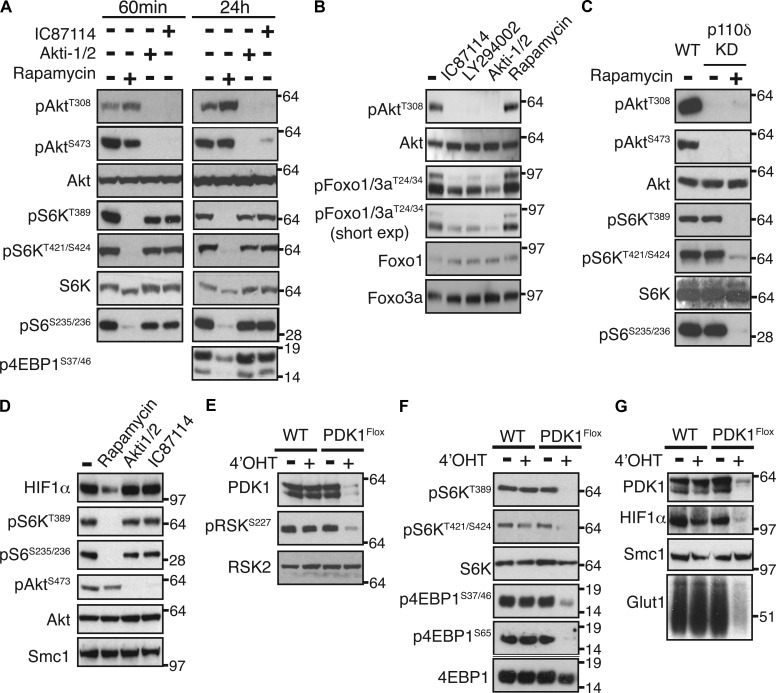
mTORC1 (mammalian target of rapamycin complex 1) controls transcriptional programs that determine CD8+ cytolytic T cell (CTL) fate. In some cell systems, mTORC1 couples phosphatidylinositol-3 kinase (PI3K) and Akt to the control of glucose uptake and glycolysis. However, PI3K–Akt-independent mechanisms control glucose metabolism in CD8+ T cells, and the role of mTORC1 has not been explored. The present study now demonstrates that mTORC1 activity in CD8+ T cells is not dependent on PI3K or Akt but is critical to sustain glucose uptake and glycolysis in CD8+ T cells. We also show that PI3K- and Akt-independent pathways mediated by mTORC1 regulate the expression of HIF1 (hypoxia-inducible factor 1) transcription factor complex. This mTORC1–HIF1 pathway is required to sustain glucose metabolism and glycolysis in effector CTLs and strikingly functions to couple mTORC1 to a diverse transcriptional program that controls expression of glucose transporters, multiple rate-limiting glycolytic enzymes, cytolytic effector molecules, and essential chemokine and adhesion receptors that regulate T cell trafficking. These data reveal a fundamental mechanism linking nutrient and oxygen sensing to transcriptional control of CD8+ T cell differentiation.
Overview
The claims and statistics of this paper haven’t been checked yet.
Run the check — free, no account needed. It reads the open-access text and checks the sources it cites.
Integrity signals
Registry
Cites
Statistics
Figures
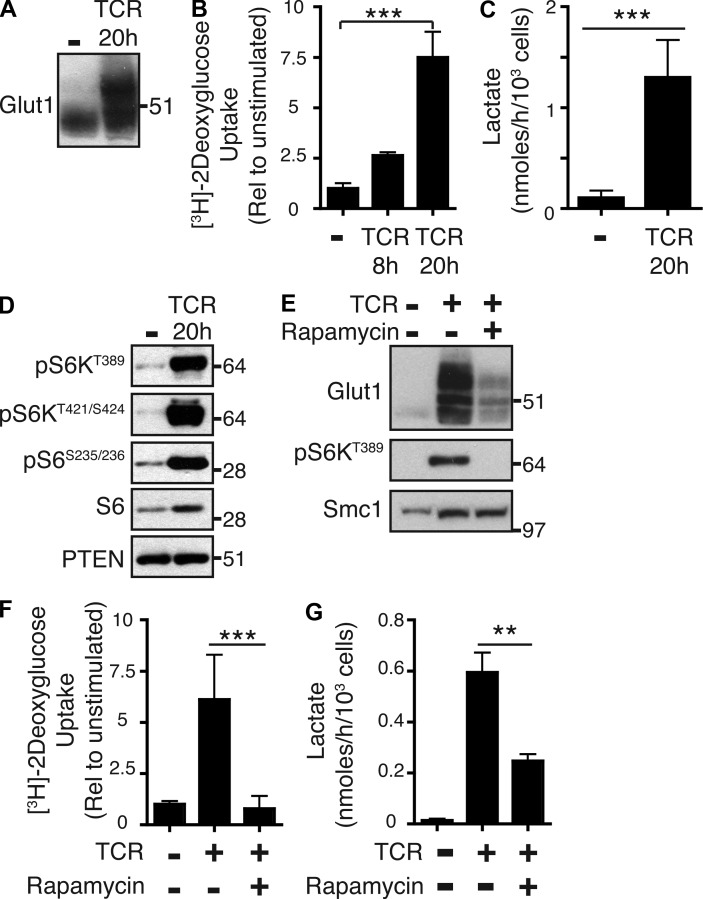
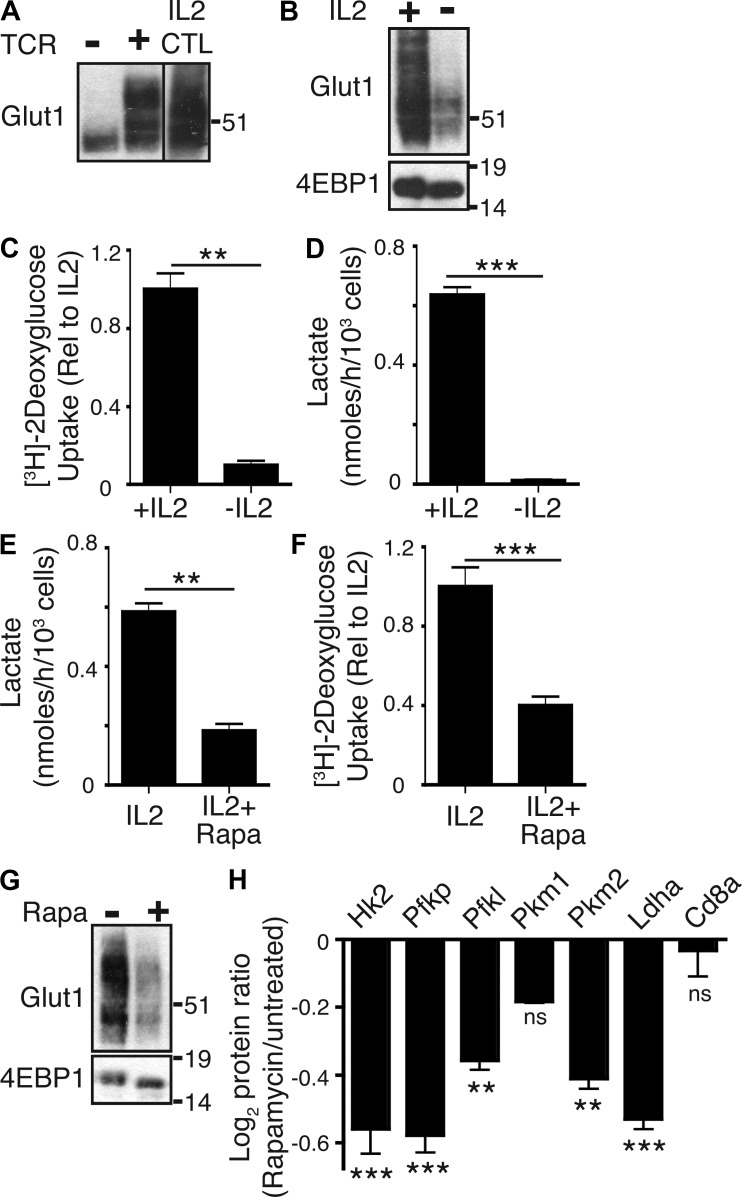
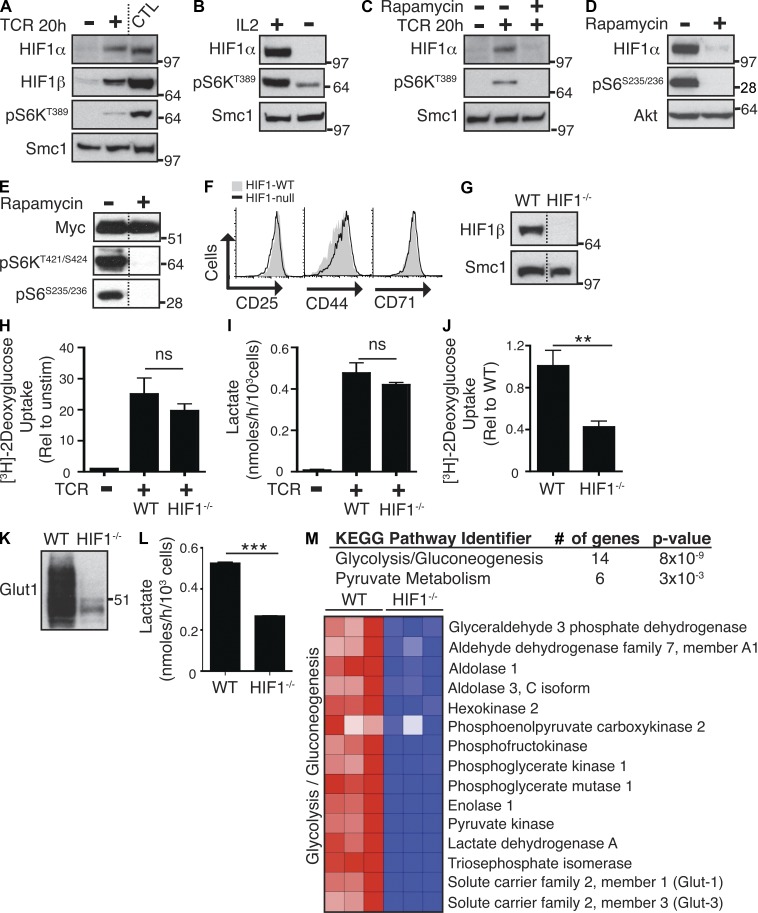
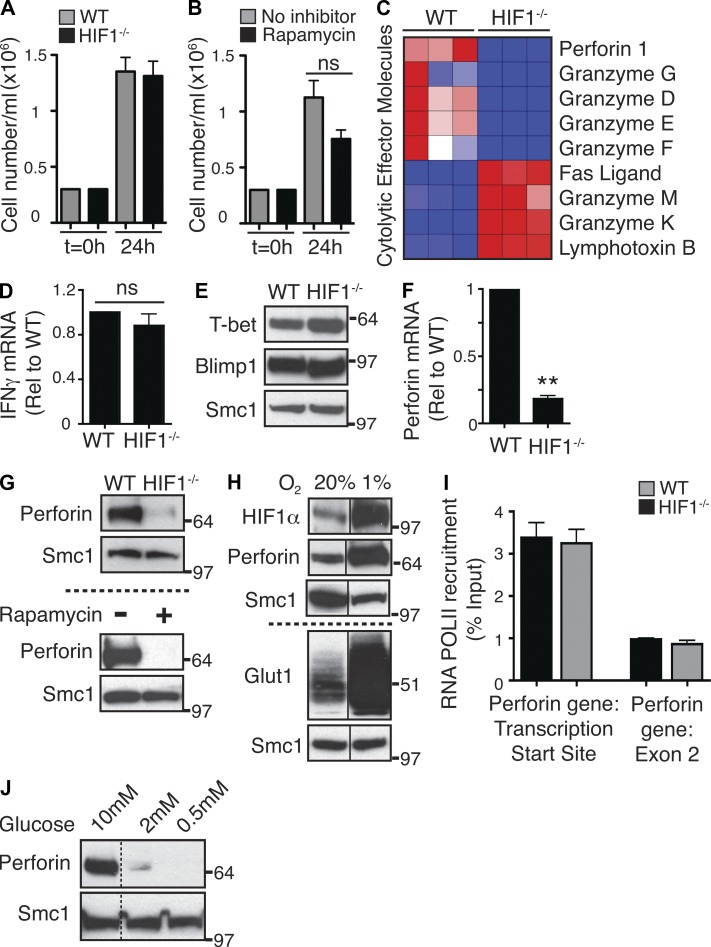
Verification
Claims the paper makes
The claims and statistics of this paper haven’t been checked yet.
Run the check — free, no account needed. It reads the open-access text and checks the sources it cites.
Claims other papers make about this one
Each is checked against this paper’s own text: does it say what the citing paper says it does?
In the citing paper
“D-2-HG activates NF-κB in bone marrow stromal cells in an IκB kinase-independent fashion, thus generating a stromal niche for IDH mutant AML development138.”
From Coupling Krebs cycle metabolites to signalling in immunity and cancer (2018) · cites this paper as [138]
Self-check
Percentages, sums and reported differences re-computed from the paper’s own numbers.
The self-check needs the paper’s full text.
Citations
Cites
Systematic and integrative analysis of large gene lists using DAVID bioinformatics resources
Huang, D. W., Sherman, B. T., & Lempicki, R. A. (2009) · Nature Protocols · doi:10.1038/nprot.2008.211 · Cited by 35,890
Cox, J., & Mann, M. (2008) · Nature Biotechnology · doi:10.1038/nbt.1511 · Cited by 14,855
Huang, D. W., Sherman, B. T., & Lempicki, R. A. (2009) · Nucleic Acids Research · doi:10.1093/nar/gkn923 · Cited by 14,108
Prolonged Rapamycin Treatment Inhibits mTORC2 Assembly and Akt/PKB
Sarbassov, D. D., Ali, S. M., Sengupta, S., Sheen, J.-H., Hsu, P. P., Bagley, A. F., Markhard, A. L., & Sabatini, D. M. (2006) · Molecular Cell · doi:10.1016/j.molcel.2006.03.029 · Cited by 2,365
The transcription factor Myc controls metabolic reprogramming upon T lymphocyte activation
Wang, R., Dillon, C. P., Shi, L. Z., Milasta, S., Carter, R., Finkelstein, D., McCormick, L. L., Fitzgerald, P., Chi, H., Munger, J., et al. (2011) · Immunity · doi:10.1016/j.immuni.2011.09.021 · Cited by 2,140 · cited 4×
“In this respect, a previous study has implicated c-myc as a major regulator of glucose metabolism in T cells (Wang et al., 2011).”
BackgroundInfluentialShi, L. Z., Wang, R., Huang, G., Vogel, P., Neale, G., Green, D. R., & Chi, H. (2011) · Journal of Experimental Medicine · doi:10.1084/jem.20110278 · Cited by 1,803
mTOR regulates memory CD8 T-cell differentiation
Araki, K., Turner, A. P., Shaffer, V. O., Gangappa, S., Keller, S. A., Bachmann, M. F., Larsen, C. P., & Ahmed, R. (2009) · Nature · doi:10.1038/nature08155 · Cited by 1,575
HIF-1: upstream and downstream of cancer metabolism
Semenza, G. L. (2009) · Current Opinion in Genetics & Development · doi:10.1016/j.gde.2009.10.009 · Cited by 1,437
Delgoffe, G. M., Pollizzi, K. N., Waickman, A. T., Heikamp, E., Meyers, D. J., Horton, M. R., Xiao, B., Worley, P. F., & Powell, J. D. (2011) · Nature Immunology · doi:10.1038/ni.2005 · Cited by 1,141
Tolerance induction in double specific T-cell receptor transgenic mice varies with antigen
Pircher, H., Bürki, K., Lang, R., Hengartner, H., & Zinkernagel, R. M. (1989) · Nature · doi:10.1038/342559a0 · Cited by 1,019
Cited by
Sorted by citations
Items 501–596 of 596
Potez, M., Souza, G. R., Spiess, P. E., Pilon‐Thomas, S., & Chahoud, J. (2025) · Nature Reviews Urology · doi:10.1038/s41585-025-01088-6 · Cited by 1
Jiang, X., Wu, H., Yan, N., Wu, A., Wang, X., Wen, Y., An, J., Chen, J., Yan, J., Wang, C., et al. (2025) · Research · doi:10.34133/research.1002 · Cited by 1
Yu, X., Zhou, J., Lei, J., Ge, H., Zhang, Z., Fu, Y., Han, X., Hu, Q., Ding, H., Geng, W., et al. (2025) · Cell Death and Disease · doi:10.1038/s41419-025-08039-4 · Cited by 1
Distinct sensing of BCAAs by mTOR and c-Myc governs T cell proliferation, independent of catabolism
Rome, K., Hall, E., Le, T. N. V., Jaccard, A., Wu, A., Snyder, N. W., Wellen, K. E., & Bailis, W. (2026) · EMBO Reports · doi:10.64898/2026.01.16.699967 · Cited by 1
Enhanced HIF-1α cooperation by a human RORγt mutant potentiates Th17 pathogenicity
Dong, P., Liu, L. S., Yu, J., Li, N., Davidorf, B., Shen, S., Bouch, R. J., Zhang, J., Ho, D., Xiao, G., et al. (2026) · Cell Reports · doi:10.1016/j.celrep.2026.117123 · Cited by 1
T cell lymphomas: cancers of aberrant immune synapse signalling
Tauber, P. A., & Ruland, J. (2026) · Nature reviews. Immunology · doi:10.1038/s41577-026-01283-5 · Cited by 1
Thelwell, J., & Johnson, A. J. (2026) · Neuroglia · doi:10.3390/neuroglia7030018 · Cited by 1
PI3K-Dependent Platelet Signaling in Vascular Inflammation and Atherothrombosis
Borst, O., Lang, F. J. W., & Münzer, P. (2017) · Cardiac and vascular biology · doi:10.1007/978-3-319-66224-4_11 · Cited by 1
Luan, W., & Qi, F. (2022) · Medical Hypotheses · doi:10.1016/j.mehy.2022.110841 · Cited by 1
Finlay, D. K., Rosenzweig, E., Sinclair, L. V., Feijoo‐Carnero, C., Hukelmann, J. L., Rolf, J., Panteleyev, A. A., Okkenhaug, K., & Cantrell, D. A. (2012) · The Journal of Cell Biology · doi:10.1083/jcb1996oia8 · Cited by 1
Self-citationRathod, S., Aggarwal, V., Upadhyay, A., & Choudhari, R. (2022) · Springer eBooks · doi:10.1007/978-981-16-6226-3_7 · Cited by 1
Blebbistatin induces chondrogenesis of single mesenchymal cells via PI3K/PDK1/mTOR/p70S6K pathway
Kim, H., Kim, D.-H., Jeong, B., Kim, J., Lee, S.-R., & Sonn, J. K. (2017) · Biologia · doi:10.1515/biolog-2017-0078 · Cited by 1
Transcriptional Regulation of T Cell Metabolism Reprograming
Zhang, J., Bi, G., Xia, Y., Li, P., Deng, X., Wei, Z., & Yang, X. (2017) · Advances in experimental medicine and biology · doi:10.1007/978-94-024-1170-6_3 · Cited by 1
PDK1/mTOR Signaling in Myeloid Cells Differentially Regulates the Early and Late Stages of Sepsis
Du, J., Li, G., Hua, M., Han, J., Yu, H., Zeng, H., Li, A., & Kong, Y. (2020) · Mediators of Inflammation · doi:10.1155/2020/5437175 · Cited by 1
Tumor-Induced Metabolism and T Cells Located in Tumor Environment
Iranparast, S., Tayebi, S., Ahmadpour, F., & Yousefi, B. (2020) · Current Cancer Drug Targets · doi:10.2174/1568009620666200720010647 · Cited by 1
McFarlane, A., Fyfe, P. K., & Moraga, I. (2021) · Elsevier eBooks · doi:10.1016/b978-0-12-820472-6.00112-2 · Cited by 2
Wang, T., Gnanaprakasam, J. R., Chen, X., Kang, S., Xu, X., Sun, H., Liu, L., Miller, E., Cassel, T., Sun, Q., et al. (2019) · bioRxiv (Cold Spring Harbor Laboratory) · doi:10.1101/766642 · Cited by 1
Modified Hypoxia Inducible Factor expression in CD8+ T cells increases anti-tumor efficacyPreprint
Veliça, P., Cunha, P. P., Vojnovic, N., Foskolou, I. P., Bargiela, D., Gojković, M., Rundqvist, H., & Johnson, R. S. (2020) · bioRxiv (Cold Spring Harbor Laboratory) · doi:10.1101/2020.06.18.159137 · Cited by 1
Lactate regulation of activation in CD8+ T cellsPreprint
Barbieri, L., Veliça, P., Gameiro, P. A., Cunha, P. P., Foskolou, I. P., Bargiela, D., Rundqvist, H., & Johnson, R. S. (2021) · bioRxiv (Cold Spring Harbor Laboratory) · doi:10.1101/2021.12.14.472728 · Cited by 1
Zhu, C., Boucheron, N., Rîca, R., Stolz, V., Halilbasic, E., Claudel, T., Al-Rubaye, O., Lercher, A., Baumgartner, M., Sandner, L., et al. (2022) · bioRxiv (Cold Spring Harbor Laboratory) · doi:10.1101/2022.02.10.479975 · Cited by 1
Improving Therapies of Rhabdomyosarcoma
Ridzewski, R. (2016) · doi:10.53846/goediss-5454 · Cited by 1
Pathogenic CD8 T cell responses are driven by neutrophil-mediated hypoxia in cutaneous leishmaniasisPreprint
Fowler, E. A., Amorim, C. F., Mostacada, K., Yan, A., Sacramento, L. A., Stanco, R. A., Hales, E. D. S., Varkey, A., Zong, W., Wu, G. D., et al. (2023) · bioRxiv (Cold Spring Harbor Laboratory) · doi:10.1101/2023.10.18.562926 · Cited by 1
PIM kinase control of CD8 T cell protein synthesis and cell traffickingPreprint
Marchingo, J. M., Spinelli, L., Pathak, S., & Cantrell, D. A. (2024) · eLife · doi:10.7554/elife.98622 · Cited by 1
Self-citationMassively multiplex multimodal chemical screens at single-cell resolutionPreprint
Chen, K. Y., Lopez, R., Eraslan, B., Hata, M., Takeshima, Y., Makino, K., Kibayashi, T., Ichiyama, K., Biton, A., Huetter, J.-C., et al. (2026) · bioRxiv (Cold Spring Harbor Laboratory) · doi:10.64898/2026.05.23.727396 · Cited by 1
Hypoxia: A Formidable Saboteur of the Anti-tumor Response
Hasmim, M., Messai, Y., Terry, S., Janji, B., Noman, M. Z., & Chouaı̈b, S. (2015) · Resistance to targeted anti-cancer therapeutics · doi:10.1007/978-3-319-17807-3_6
Gubser, P. M. (2013) · edoc (University of Basel) · doi:10.5451/unibas-006161384
JB Review Pleiotropic roles of mTOR complexes in haemato-lymphopoiesis and leukemogenesis
Hoshii, T., Matsuda, S., & Hirao, A. (2014)
Rebellón-Sánchez, D. E., Morales, T. J. P., Alba, J. S. M., Guerrero, J. S. C., & Goméz, B. M. B. (2014) · Redalyc (Universidad Autónoma del Estado de México)
Cellular Metabolism Controls Lymphocyte Activation and Differentiation
Powell, J. D., & Sun, I. (2016) · Elsevier eBooks · doi:10.1016/b978-0-12-374279-7.11013-6
Effects of Ageing on Adaptive Immune Responses
Henson, S. M. (2016) · Springer eBooks · doi:10.1007/978-3-319-43365-3_2
The Secrets of T Cell Polarization
Vargas, T. R., & Apétoh, L. (2017) · Springer eBooks · doi:10.1007/978-3-319-62431-0_5
Aznab, M., & Rezaei, M. (2018) · International Journal of Cancer Management · doi:10.5812/ijcm.82420
Donnelly, R. P. (2016) · Arrow@dit (Dublin Institute of Technology)
The Contribution Of Metabolism To The Regulation Of Caspase Activity And Cell Death In T Lymphocytes
Secinaro, M. A. (2019) · ScholarWorks -A service of University of Vermont Libraries (University of Vermont)
Intracellular Sensors and Cellular Metabolism in Allogeneic Hematopoietic Stem Cell Transplantation
Byersdorfer, C. A., & Reddy, P. R. (2019) · Elsevier eBooks · doi:10.1016/b978-0-12-812630-1.00019-0
Transcriptional control of tissue-resident memory T cell generation
Cvetkovski, F. (2019) · doi:10.7916/d8-n16c-b343
Regulation of T Lymphocytes by Fibroblastic Reticular Cells
Brown, F. D. (2018) · Digital Access to Scholarship at Harvard (DASH) (Harvard University)
Targeting metabolism to potentiate NK cell-based therapies
Dhar, P., & Wu, J. D. (2021) · Elsevier eBooks · doi:10.1016/b978-0-12-824375-6.00016-3
Metabolic Profile of Adaptive Immune Cells
Domínguez-Amorocho, O. A., Soto‐Heredero, G., & Mittelbrunn, M. (2021) · Springer eBooks · doi:10.1007/978-3-030-86684-6_6
Latte: il Tar del Lazio chiama in causa l'Ue
Martirano, L. (2000) · Informatore agrario
Gudgeon, N. H., Munford, H., Bishop, E. L., Hill, J., Fulton-Ward, T., Bending, D., Roberts, J., Tennant, D. A., & Dimeloe, S. (2021) · SSRN Electronic Journal · doi:10.2139/ssrn.3992090
Feitosa, A. C. M. (2020) · Digital Library of Theses and Dissertations (Universidade de São Paulo) · doi:10.11606/t.42.2020.tde-18122019-110528
Kane, L. (2020) · Faculty Opinions – Post-Publication Peer Review of the Biomedical Literature · doi:10.3410/f.734903427.793578160
Faculty Opinions recommendation of Signaling networks in immunometabolism.
Kane, L. (2020) · Faculty Opinions – Post-Publication Peer Review of the Biomedical Literature · doi:10.3410/f.737610223.793578145
Leonard, W. J., & Spolski, R. J. (2017) · Faculty Opinions – Post-Publication Peer Review of the Biomedical Literature · doi:10.3410/f.726682554.793537547
Limitations of Adaptive Immune System in Solid Tumours
Liang, R. (2022) · International Conference on Biotechnology, Life Science and Medical Engineering (BLSME) · doi:10.23977/blsme.2022006
Eliminating the hypoxia driven immunosuppression in tumors to enable immunotherapies of cancer
Halpin-Veszeleiova, K. (2022) · Digital Repository Service (Northeastern University) · doi:10.17760/d20455931
Applications of bioinformatics and machine learning in the analysis of proteomics data
Li, B. (2023) · Utrecht University Repository (Utrecht University) · doi:10.33540/1818
Wu, H., Zhao, X., Hochrein, S. M., Eckstein, M., Gubert, G. F., Knöpper, K., Mansilla, A. M., Öner, A., Doucet-Ladevèze, R., Schmitz, W., et al. (2023) · bioRxiv (Cold Spring Harbor Laboratory) · doi:10.1101/2023.08.31.555662
Mai, L. T., Swaminathan, S., Nguyen, T. H., Charpentier, T., Loucif, H., Carmona‐Pérez, L., Lamarre, A., Heinonen, K. M., Fritz, J. H., & Stäger, S. (2024) · bioRxiv (Cold Spring Harbor Laboratory) · doi:10.1101/2024.01.29.577789
Yu, X., Zhou, J., Lei, J., Ge, H., Zhang, Z., Fu, Y., Han, X., Hu, Q., Ding, H., Geng, W., et al. (2024) · bioRxiv (Cold Spring Harbor Laboratory) · doi:10.1101/2024.05.31.596765
Spatial quantification of cellular metabolism in tissues by metabolic regulome profiling
Glauner, T. A., Truxa, S., Cetin, M., Schlüter, K., Calafato, D., & Hartmann, F. J. (2024) · Elsevier eBooks · doi:10.1016/b978-0-12-822213-3.00006-1
PIM kinase control of CD8 T cell protein synthesis and cell traffickingPreprint
Marchingo, J. M., Spinelli, L., Pathak, S., & Cantrell, D. A. (2024) · eLife · doi:10.7554/elife.98622.1
Self-citationT cell metabolism and cancer immunotherapy
Li, Q., & Zhang, Z. (2024) · Elsevier eBooks · doi:10.1016/b978-0-443-13827-0.00006-8
The Immunometabolism of Natural Killer Cell Responses
Keane, C., Gardiner, C. M., & Finlay, D. K. (2025) · Springer eBooks · doi:10.1007/978-3-662-68816-8_41-1
Self-citationCancer Biology and Microenvironment
Wang, Y., Liu, T., Peng, S., Jin, L., & Chen, Y. (2025) · Springer eBooks · doi:10.1007/978-981-19-8930-8_1
Madrigal-Avilés, A., Plajer, V., Mendonca, P. R. V., Serve, S., Soriano‐Baguet, L., Brenner, D., Dzamukova, M. R., Mashreghi, M., & Löhning, M. (2025) · bioRxiv (Cold Spring Harbor Laboratory) · doi:10.1101/2025.04.03.647060
PIM kinase control of CD8 T cell protein synthesis and cell traffickingPreprint
Marchingo, J. M., Spinelli, L., Pathak, S., & Cantrell, D. A. (2025) · eLife · doi:10.7554/elife.98622.2
Self-citationCellular Metabolism Controls Lymphocyte Activation and Differentiation
Powell, J. D., & Sun, I. (2025) · Elsevier eBooks · doi:10.1016/b978-0-12-824465-4.00180-0
Immunometabolism Governs T Cell Immunity
Raynor, J. L., Shi, H., & Chi, H. (2025) · Elsevier eBooks · doi:10.1016/b978-0-12-824465-4.00275-1
Kalia, V., Ahmed, R., & Sarkar, S. (2025) · Elsevier eBooks · doi:10.1016/b978-0-12-824465-4.00292-1
The MARK2 kinase acts as a gatekeeper of CD28-dependent co-stimulation in T cellsPreprint
Ferran, H., Marconi, F., Dogniaux, S., Goudot, C., Zellner, A., Cools, T., Larcher, T., Brisebard, É., Paillon, N., FIORE, F., et al. (2025) · bioRxiv (Cold Spring Harbor Laboratory) · doi:10.1101/2025.10.13.682047
Protection Against Type 1 Diabetes Development in Mice With 4E-BP2 Deletion
Pita-Grisanti, V., Peçanha, F. L. M., Louzada, R. A. N., Blandino-Rosano, M., Jaramillo, C., Arenas, N., Bayer, A. L., & Bernal‐Mizrachi, E. (2025) · Diabetes · doi:10.2337/db25-0348
Hamilton, K. S. (2014) · D-Scholarship@Pitt (University of Pittsburgh)
Cheng, O., Ryan, E. K., Bennett, M., Clutter, C., Cacioppo, J. G., Aubé, J., Hogan, A. E., & Leung, D. T. (2025) · Immunology · doi:10.1111/imm.70086
Le, T. N. V., Trihemasava, K., Turner, L. H., Rome, K., Wu, A., & Bailis, W. (2026) · bioRxiv (Cold Spring Harbor Laboratory) · doi:10.64898/2026.01.16.699963
Li, J., Yang, S., Yuan, Y., Li, N., Wang, X., Wang, Z., Zhu, X., Hua, L., Yu, M., Wang, Y., et al. (2026) · Cell Reports Medicine · doi:10.1016/j.xcrm.2026.103127
Onofrio, L. I., Abrate, C., Strusberg, I., Morales, L., Ceschin, D. G., Montes, C. L., Stempin, C. C., & Rodríguez, E. V. A. (2026) · Cell Death and Disease · doi:10.1038/s41419-026-08610-7
Metabolic fueling of hematopoietic stem cell differentiation to the erythroid lineage
Oburoglu, L. (2014) · theses.fr (ABES) · doi:10.70675/2a8ca582z1bd3z4b90z96c1z5964d1e426b9
Targeting the metabolic environment to modulate T cell effector function
Matias, M. I. (2019) · theses.fr (ABES) · doi:10.70675/0582ddaaze61dz4707z9cb1zdb8fe1d82653
Impact du ciblage du domaine de liaison de HIF-1α avec HIF-1β sur le paysage immunitaire du mélanome
Lequeux, A. (2020) · theses.fr (ABES) · doi:10.70675/a29d12dbz79c1z4d37za978z2e2319131c82
Corral, D. (2020) · theses.fr (ABES) · doi:10.70675/5891ec8az223cz458dzb5cezd92ba38e80aa
Chen, Q., Luo, M., Lin, W., Lu, L., Zhong, C., Liu, A., & Xie, L. (2026) · Discover Oncology · doi:10.1007/s12672-026-04658-1
The anti-tumoral effects of a low protein diet and of the IRE1α signaling
Turtos, A. M. (2022) · theses.fr (ABES) · doi:10.70675/fd90a3e8ze35az42fdzbd0ez966f12ddad22
Brown, A. K., Niu, H., Shen, J., Zhang, Y., de Castro, P. A. S. V., Kasmani, M. Y., Lin, S., Topchyan, P., Mani, N. L., Volberding, P. J., et al. (2026) · The Journal of Immunology · doi:10.1093/jimmun/vkag062
Tuning PI3K: striking the right balance for optimal CD8 T-cell responses
Cannons, J. L., Pichler, A., & Schwartzberg, P. L. (2026) · The Journal of Immunology · doi:10.1093/jimmun/vkaf296
Turnquist, A., Javaid, A., Wilkins, O. M., Kolling, F., Pioli, P. A., Paulos, C. M., Frost, H. R., & Usherwood, E. J. (2026) · The Journal of Immunology · doi:10.1093/jimmun/vkag108
Tan, T. C. J., Spanos, C., & Tollervey, D. W. (2026) · bioRxiv (Cold Spring Harbor Laboratory) · doi:10.64898/2026.06.07.730558
Goedhart, N. B., Camerini, E., Cretenet, G., Grootemaat, A. E., Vlaskov, K., Jacobs, C. F., d’Hargues, Y., van der Wel, N. N., Vrieling, F., Schomakers, B. V., et al. (2026) · bioRxiv (Cold Spring Harbor Laboratory) · doi:10.64898/2026.06.09.731122
Abo, H., Kim, S.-E. G., Ngo, V. L., Kuczma, M., & Gewirtz, A. T. (2026) · Mucosal Immunology · doi:10.1016/j.mucimm.2026.100382
Integrating T cell signaling and metabolism to enhance T cell engager responses in solid tumors
Scaglione, M., Engavale, M. B., Chun, M. G. H., Sawant, D. V., Lu, D., & LaGory, E. L. (2026) · Frontiers in Immunology · doi:10.3389/fimmu.2026.1887842
Metabolic switch: lymphocytes and the onset of T-cell-mediated autoimmunity
Jahromi, A. M., Mirzaei, F., Mirzazadeh, S., Meri, S., Kabelitz, D., & Kalantar, K. (2026) · Cellular and Molecular Immunology · doi:10.1038/s41423-026-01460-5 · Cited by 1
Gu, S., Yang, Y., Li, D., Gu, Y., Zhang, S., Liu, C., & Zhang, H. (2026) · International Immunopharmacology · doi:10.1016/j.intimp.2026.117357
Coupling and uncoupling cell cycle and metabolism in CD8+ T cells
van Haften, F. J., Hepp, H. S., Biemond, M., & Arens, R. (2026) · Trends in Immunology · doi:10.1016/j.it.2026.09.001
Shin, H. R. (2026) · Kosin Medical Journal · doi:10.7180/kmj.26.191
Intestinal T-cell migration: unraveling mechanisms and therapeutic implications
Sun, Y., Liu, Y., Xie, L., Zhu, L., & Peng, W. (2026) · Journal of Advanced Research · doi:10.1016/j.jare.2026.10.019
Metabolic gatekeepers shape immune cell function in rheumatoid arthritis
Jia, L., Kothagundla, M. N., Goronzy, J. J., & Weyand, C. M. (2026) · Clinical Science · doi:10.1042/cs20250834
Molecular mechanisms regulating T-cell receptor signaling and T-cell function
Kurilin, V. V., Fisher, M. S., & Vitalievitch, S. S. (2026) · Frontiers in Immunology · doi:10.3389/fimmu.2026.2002535
Metadata
- Authors
- Finlay, D. K., Rosenzweig, E., Sinclair, L. V., Feijoo-Carnero, C., Hukelmann, J. L., Rolf, J., Panteleyev, A. A., Okkenhaug, K., & Cantrell, D. A.
- Affiliations
- Trinity College Dublin (IE)
- University of Dundee (GB)
- Division of Cell Signalling and Immunology, College of Life Sciences 3 ; and 4
- Babraham Institute (GB)
- Corresponding author
- Finlay, David K.
- Cantrell, Doreen A.
- ORCID
- Venue
- Journal of Experimental Medicine
- Publisher
- Rockefeller University Press
- Published
- 2012-11-26
- Volume
- 209
- Issue
- 13
- Pages
- 2441-2453
- ISSN
- 0022-1007 (ISSN-L)
- 1540-9538
- PMC
- PMC3526360
- OpenAlex
- W2164164239
- Cited by
- 596
- References
- 35
- Citations by year
- 2026: 29 · 2025: 33 · 2024: 32 · 2023: 43 · 2022: 46 · 2021: 59 · 2020: 47 · 2019: 56 · 2018: 45 · 2017: 43 · 2016: 49 · 2015: 46 · 2014: 36 · 2013: 29 · 2012: 2
- FWCI
- 14.52
- Type
- journal article
- Language
- en
- Open access
- bronze
- doi.org
- Locations
- The Journal of Experimental Medicine (publishedVersion)
- Europe PMC (PubMed Central) (publishedVersion, cc-by-nc-sa)
- PubMed Central (publishedVersion, cc-by-nc-sa)
- PubMed (publishedVersion)
- Discovery Research Portal (University of Dundee) (acceptedVersion, other-oa)
- Arrow@dit (Dublin Institute of Technology) (acceptedVersion)
- Trinity's Access to Research Output (TARA) (Trinity College Dublin) (submittedVersion, cc-by-nc-sa)
- Apollo (University of Cambridge) (submittedVersion, cc-by-nc-sa)
- Apollo
- Funders
- University of Dundee
- Wellcome Trust (097418/Z/11/Z, 095691, 065975, 097418)
- Topics
- Life Sciences › Biochemistry, Genetics and Molecular Biology › Molecular Biology › PI3K/AKT/mTOR signaling in cancer
- Life Sciences › Immunology and Microbiology › Immunology › T-cell and B-cell Immunology
- Life Sciences › Biochemistry, Genetics and Molecular Biology › Cancer Research › Cancer, Hypoxia, and Metabolism
- Keywords
- mTORC1, CD8+ T cells, cytotoxic T lymphocytes, HIF-1, glucose metabolism, glycolysis, glucose uptake, T cell migration, T cell differentiation, nutrient sensing, oxygen sensing, glucose transporters, chemokine receptors, cell adhesion receptors
- MeSH terms
- Mechanistic Target of Rapamycin Complex 1, Animals, Cell Differentiation, Cell Movement, Gene Expression Regulation, Glucose, Glycolysis, Interleukin-2, Mice, Inbred C57BL, Mice, Mutant Strains, Mice, Transgenic, Proteins, Receptors, Antigen, T-Cell, Protein Serine-Threonine Kinases, CD8-Positive T-Lymphocytes, Chemokines, Receptors, Chemokine, Phosphatidylinositol 3-Kinases, Multiprotein Complexes, Proto-Oncogene Proteins c-akt, Mice, Aryl Hydrocarbon Receptor Nuclear Translocator, Hypoxia-Inducible Factor 1, Hypoxia-Inducible Factor 1, alpha Subunit, TOR Serine-Threonine Kinases, 3-Phosphoinositide-Dependent Protein Kinases
About these checks
Registry, retraction, Cites and statistics results are computed, not judged, with one exception: a printed reference that no index lists is read once by a model before it counts as a citation error. Claims are extracted by a model and kept only when their quote appears verbatim in the text; each cited source is then checked, with a model’s help, for whether it says what the claim relies on. Those verdicts can be wrong — read the claim’s quote and the cited source before relying on one.
Statistics and arithmetic are recomputed, not judged.
Confidence bands are shown only for fields calibrated on our annotated test set. None is calibrated yet, so no band is shown.
What counts as a claim ›How we measure confidence ›How we check this ›
Are you an author, or do you see a problem with this page? Request a review
