Cited by 35

The DOI matches its Crossref record; 11 of the 11 references it cites were found in a registry or an index.

Pten loss in the bone marrow leads to G-CSF–mediated HSC mobilization

Tesio, Melania, Oser, Gabriela M., Baccelli, Irène, Blanco-Bose, William, Wu, Hong, Göthert, Joachim R., Kogan, Scott C., Trumpp, Andreas·2013·Journal of Experimental Medicine

Abstract

The phosphatase and tumor suppressor PTEN inhibits the phosphoinositol-3-kinase (PI3K) signaling pathway and plays a key role in cell growth, proliferation, survival, and migration. Pten conditional deletion using MxCre or Scl-CreERT leads to splenomegaly and leukemia formation, which occurs after the relocation of normal hematopoietic stem cells (HSCs) from the bone marrow to the spleen. Unexpectedly, dormant HSCs in the bone marrow do not enter the cell cycle upon Pten loss, they do not lose self-renewal activity, and they are not exhausted. Instead, Pten deficiency causes an up-regulation of the PI3K pathway in myeloid cells, but not in HSCs. Strikingly, myeloid cells secrete high levels of G-CSF upon Pten loss, leading to the mobilization of HSCs from the bone marrow and accumulation in the spleen. After deletion of Pten in mice lacking G-CSF, the splenomegaly, myeloproliferative disease, and splenic HSC accumulation are rescued. Our data show that although PTEN has little if any role in normal HSCs, it is essential to prevent overt G-CSF production by myeloid and stromal cells which otherwise causes HSCs to relocate to the spleen followed by lethal leukemia initiation.

Overview

The claims and statistics of this paper haven’t been checked yet.

Run the check — free, no account needed. It reads the open-access text and checks the sources it cites.

A few free checks a day · papers already verified open instantly · results are public

Integrity signals

Registry

Crossref · 10.1084/jem.20122768

Cites

11 of 11 references verified0 citation errors · 0 not checkable

Statistics

Figures

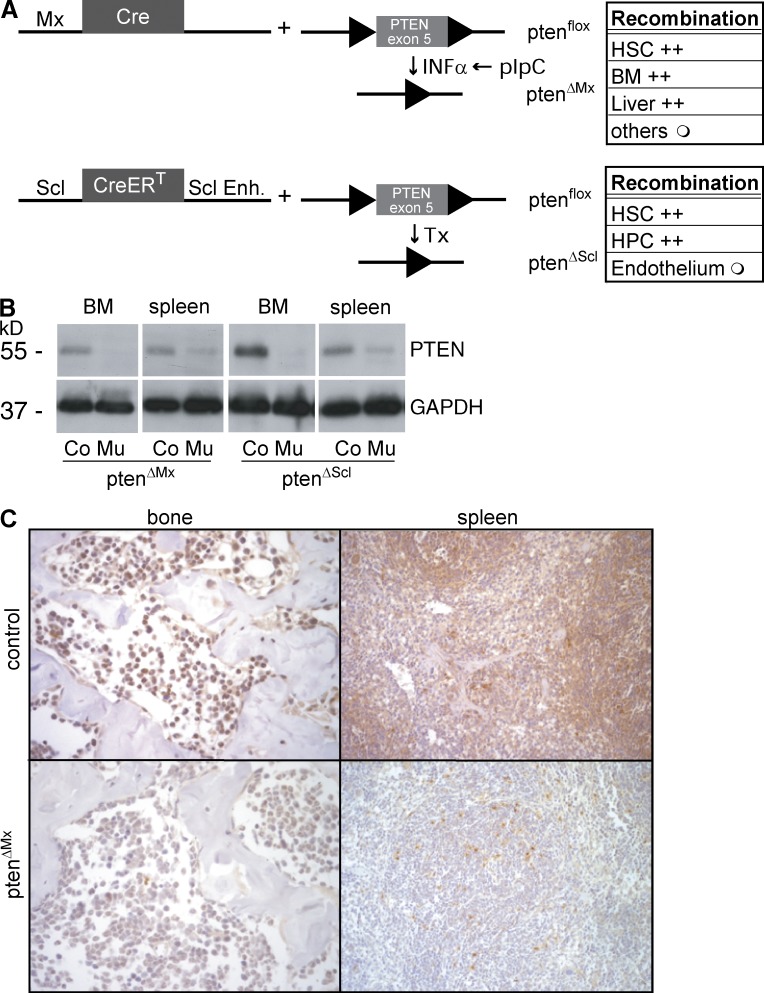
Figure 1. Conditional elimination of the ptenflox allele in the hematopoietic system using SCL-CreERT and Mx-Cre. (A) Schematic diagram of the two conditional KO approaches and description about the tissue-specific recombination efficiency (right); +, >90%; ○, <50%. (B) Western blot showing the efficiency of Pten elimination in BM and spleen. (C) Analysis of PTEN expression in sections of bone and spleen using immunohistochemistry. Representative figures (bone, 1 cm = 250 µM; spleen, 1 cm = 500 µM) are shown. The data presented are representative of least three different independent experiments.
Figure 1. Conditional elimination of the ptenflox allele in the hematopoietic system using SCL-CreERT and Mx-Cre. (A) Schematic diagram of the two conditional KO approaches and description about the tissue-specific recombination efficiency (right); +, >90%; ○, <50%. (B) Western blot showing the efficiency of Pten elimination in BM and spleen. (C) Analysis of PTEN expression in sections of bone and spleen using immunohistochemistry. Representative figures (bone, 1 cm = 250 µM; spleen, 1 cm = 500 µM) are shown. The data presented are representative of least three different independent experiments.CC BY-NC-SA · PubMed Central
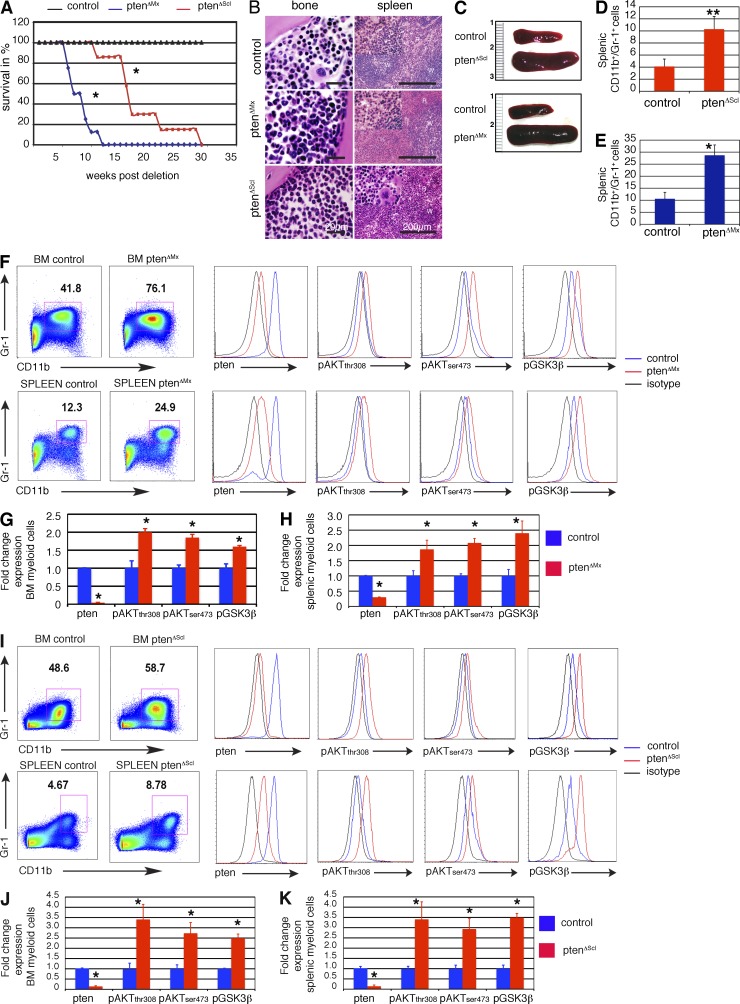
Figure 2. Elimination of Pten using SCL-CreERT causes premature lethality. (A) Kaplan-Meyer analysis showing lethality upon Pten deletion in PtenΔMx and PtenΔScl mice. P < 0.05. n = 6 mice each group. (B) Hematoxylin & Eosin (H&E)–stained histological sections of bone and spleen showing MPD in the spleen and granulocytic hyperplasia in the bone. R, red pulp; W, white pulp. Bars: (spleen) 200 µm; (bone) 20 µm. (C) Splenomegaly in PtenΔMx and PtenΔScl mice 4 and 7 wk after deletion, respectively. (D) Splenic CD11b+Gr-1+ cells in control or PtenΔScl mice. Three independent experiments, n = 7 controls and n = 6 mutants. ** indicates statistically significant change, P = 0.001. (E) Splenic CD11b+Gr-1+ cells in control or PtenΔMx mice. Three independent experiments, n = 8 each group. P = 0.029. (F–H) Pten, pAktTh308, pAktSer473, and pGSK3βSer9 levels in BM (top) and splenic (bottom) CD11b+Gr-1+ cells of PtenΔMx and control counterparts pI-pC injected for 15 d. Data were obtained using a detergent-based protocol (Cytofix/Cytoperm; BD). A representative FACS plot (F) and the fold change in the expression levels (G and H) are shown. Three independent experiments, n = 6 controls and n = 4 mutants. P < 0.05 for all stainings of BM and spleen. (I–K) Pten, pAktTh308, pAktSer473, and pGSK3βSer9 levels in BM (top) and splenic (bottom) CD11b+Gr-1+ cells of PtenΔScl and control counterparts fed with Tx diet for 28 d. Data were obtained using a detergent-based protocol (Cytofix/Cytoperm). A representative FACS plot (I) and the fold change in the expression levels (J and K) are shown. Three independent experiments, n = 6 each group. P < 0.05 for all stainings of BM and spleen. Data are provided as mean ± SE. Unless otherwise indicated, * indicates statistically significant change with P < 0.05.
Figure 2. Elimination of Pten using SCL-CreERT causes premature lethality. (A) Kaplan-Meyer analysis showing lethality upon Pten deletion in PtenΔMx and PtenΔScl mice. P < 0.05. n = 6 mice each group. (B) Hematoxylin & Eosin (H&E)–stained histological sections of bone and spleen showing MPD in the spleen and granulocytic hyperplasia in the bone. R, red pulp; W, white pulp. Bars: (spleen) 200 µm; (bone) 20 µm. (C) Splenomegaly in PtenΔMx and PtenΔScl mice 4 and 7 wk after deletion, respectively. (D) Splenic CD11b+Gr-1+ cells in control or PtenΔScl mice. Three independent experiments, n = 7 controls and n = 6 mutants. ** indicates statistically significant change, P = 0.001. (E) Splenic CD11b+Gr-1+ cells in control or PtenΔMx mice. Three independent experiments, n = 8 each group. P = 0.029. (F–H) Pten, pAktTh308, pAktSer473, and pGSK3βSer9 levels in BM (top) and splenic (bottom) CD11b+Gr-1+ cells of PtenΔMx and control counterparts pI-pC injected for 15 d. Data were obtained using a detergent-based protocol (Cytofix/Cytoperm; BD). A representative FACS plot (F) and the fold change in the expression levels (G and H) are shown. Three independent experiments, n = 6 controls and n = 4 mutants. P < 0.05 for all stainings of BM and spleen. (I–K) Pten, pAktTh308, pAktSer473, and pGSK3βSer9 levels in BM (top) and splenic (bottom) CD11b+Gr-1+ cells of PtenΔScl and control counterparts fed with Tx diet for 28 d. Data were obtained using a detergent-based protocol (Cytofix/Cytoperm). A representative FACS plot (I) and the fold change in the expression levels (J and K) are shown. Three independent experiments, n = 6 each group. P < 0.05 for all stainings of BM and spleen. Data are provided as mean ± SE. Unless otherwise indicated, * indicates statistically significant change with P < 0.05.CC BY-NC-SA · PubMed Central
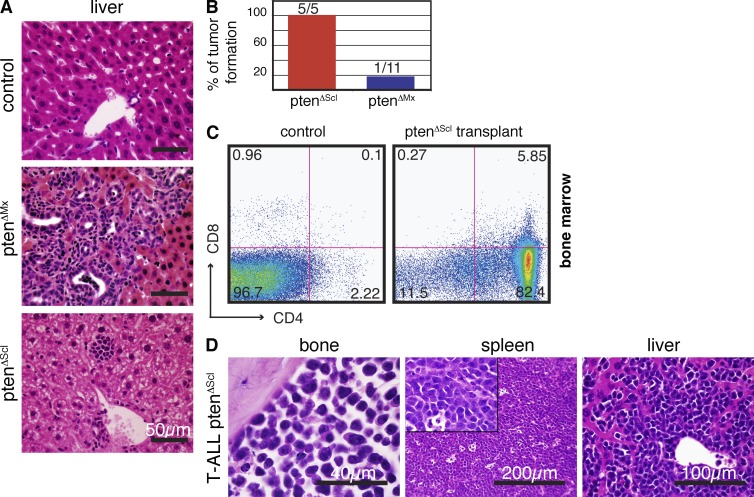
Figure 3. Elimination of Pten using SCL-CreERT induces leukemia. (A) H&E-stained histological sections of livers from PtenΔMx, PtenΔScl, or control mice. (B) Frequency of tumors in NOD/SCID mice after transplantation of 106 BM cells of sick PtenΔScl mice and PtenΔMx, n = 5 and n = 11, respectively. Data are provided as mean ± SE. (C) FACS profile showing CD4 and CD8 expression in the BM of a control NOD/SCID mouse (left) and a PtenΔScl transplanted NOD/SCID mouse (right). (D) H&E-stained histological sections of bone, spleen, and liver of a typical PtenΔScl mouse showing T-ALL.
Figure 3. Elimination of Pten using SCL-CreERT induces leukemia. (A) H&E-stained histological sections of livers from PtenΔMx, PtenΔScl, or control mice. (B) Frequency of tumors in NOD/SCID mice after transplantation of 106 BM cells of sick PtenΔScl mice and PtenΔMx, n = 5 and n = 11, respectively. Data are provided as mean ± SE. (C) FACS profile showing CD4 and CD8 expression in the BM of a control NOD/SCID mouse (left) and a PtenΔScl transplanted NOD/SCID mouse (right). (D) H&E-stained histological sections of bone, spleen, and liver of a typical PtenΔScl mouse showing T-ALL.CC BY-NC-SA · PubMed Central
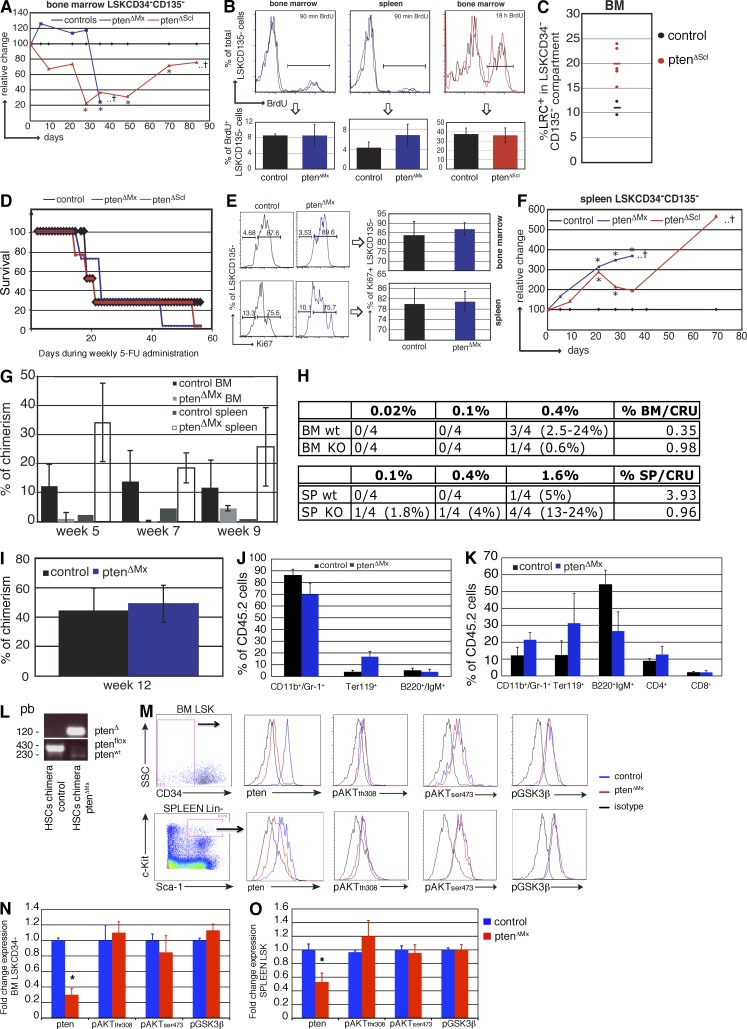
Figure 4. Phenotypic and functional analysis of Pten-deficient HSCs. (A) Kinetic analysis of the relative change of LSKCD34−CD135− cells in the BM of PtenΔMx and PtenΔScl mice compared with controls (set to 100%). The asterisk indicates statistical significant change (P < 0.05). The cross indicates that the majority of mice do not survive beyond this time point. Each dot represents the mean value obtained from three to four mice. (B) FACS plots (top) and bar graph (bottom) showing the percentage of BrdU+ cells within the LSKCD135− population in BM and spleen after 90 min and in BM after 18 h of BrdU labeling. P = 0.99, P = 0.19, and P = 0.75, respectively. (C) Percentage of BrdU LRCs within the LSKCD34−CD135−population. Mice were initially labeled for 10 d with BrdU, followed by simultaneous induction of SCL-CreERT with Tx and 70 d of a BrdU free chase period. P = 0.02. Each dot represents a single mouse. Horizontal bars indicate mean values. (D) Kaplan-Meyer curve showing the survival of PtenΔMx and PtenΔScl mice (15 d [Mx] or 21 d [Scl] after deletion) during weekly 5-FU administration. n = 7 PtenΔMxmice, n = 4 PtenΔScl mice, n = 4 of each control group. (E) Analysis of intracellular Ki67 expression in LSKCD135− cells from BM (top, P = 0.43) and spleen (bottom, P = 0.81) of ptenΔMx mice. (F) Kinetic analysis of the relative change of LSKCD34−CD135− cells in the spleen of PtenΔMx and PtenΔScl mice compared with controls (set to 100%). The asterisk indicates statistically significant change (P < 0.05). The cross indicates that the majority of mice do not survive beyond this time point. Each dot represents the mean value obtained from three to four mice. (G) Bar graph showing CD45.2 donor contribution 5, 7, and 9 wk after transplantation of 0.4% of total BM and 1.6% of total splenocytes of control and PtenΔMx mice into CD45.1 hosts. n = 4 each group. (H) Limiting dilution analysis of BM cells (top) and splenocytes (bottom) of ptenΔMx (KO) and control (wt) mice. Values represent reconstituted mice (chimerism > 0.5%) versus total mice transplanted. CRUs were calculated using the method of maximum likelihood. The number of mice per group is indicated. (I) Percentage of CD45.2 donor contribution 12 wk after transplantation of 2500 LSK cells of control and PtenΔMx mice into CD45.1 hosts. (J and K) Multilineage reconstitution after transplantation of 2500 BM (J) or splenic (K) LSK cells from ptenΔMx mice. n = 2 controls, n = 3 mutants. (L) PCR analysis of DNA from FACS-sorted donor (CD45.2) splenocytes 12 wk after transplantation showing the absence of the Ptenflox but presence of the PtenΔ allele. (M–O) Pten, pAktTh308, pAktSer473, and pGSK3βSer9 levels in BM LSKCD135−CD34− (top) or splenic LSK cells (bottom) of PtenΔMx and controls (pI-pC treated). A representative FACS plot (M) and the fold change in the expression levels (N and O) are shown. Three independent experiments, n = 6 for each group. BM: P = 0.01 Pten, P > 0.05 pAktTh308, pAktSer473, and pGSK3βSer9. Spleen: P = 0.04 Pten, P > 0.05 pAktTh308, pAktSer473, and pGSK3βSer9. Unless otherwise indicated, the data presented in this figure refer to at least three independent experiments using at least three mice per group. Data are provided as mean ± SE.
Figure 4. Phenotypic and functional analysis of Pten-deficient HSCs. (A) Kinetic analysis of the relative change of LSKCD34−CD135− cells in the BM of PtenΔMx and PtenΔScl mice compared with controls (set to 100%). The asterisk indicates statistical significant change (P < 0.05). The cross indicates that the majority of mice do not survive beyond this time point. Each dot represents the mean value obtained from three to four mice. (B) FACS plots (top) and bar graph (bottom) showing the percentage of BrdU+ cells within the LSKCD135− population in BM and spleen after 90 min and in BM after 18 h of BrdU labeling. P = 0.99, P = 0.19, and P = 0.75, respectively. (C) Percentage of BrdU LRCs within the LSKCD34−CD135−population. Mice were initially labeled for 10 d with BrdU, followed by simultaneous induction of SCL-CreERT with Tx and 70 d of a BrdU free chase period. P = 0.02. Each dot represents a single mouse. Horizontal bars indicate mean values. (D) Kaplan-Meyer curve showing the survival of PtenΔMx and PtenΔScl mice (15 d [Mx] or 21 d [Scl] after deletion) during weekly 5-FU administration. n = 7 PtenΔMxmice, n = 4 PtenΔScl mice, n = 4 of each control group. (E) Analysis of intracellular Ki67 expression in LSKCD135− cells from BM (top, P = 0.43) and spleen (bottom, P = 0.81) of ptenΔMx mice. (F) Kinetic analysis of the relative change of LSKCD34−CD135− cells in the spleen of PtenΔMx and PtenΔScl mice compared with controls (set to 100%). The asterisk indicates statistically significant change (P < 0.05). The cross indicates that the majority of mice do not survive beyond this time point. Each dot represents the mean value obtained from three to four mice. (G) Bar graph showing CD45.2 donor contribution 5, 7, and 9 wk after transplantation of 0.4% of total BM and 1.6% of total splenocytes of control and PtenΔMx mice into CD45.1 hosts. n = 4 each group. (H) Limiting dilution analysis of BM cells (top) and splenocytes (bottom) of ptenΔMx (KO) and control (wt) mice. Values represent reconstituted mice (chimerism > 0.5%) versus total mice transplanted. CRUs were calculated using the method of maximum likelihood. The number of mice per group is indicated. (I) Percentage of CD45.2 donor contribution 12 wk after transplantation of 2500 LSK cells of control and PtenΔMx mice into CD45.1 hosts. (J and K) Multilineage reconstitution after transplantation of 2500 BM (J) or splenic (K) LSK cells from ptenΔMx mice. n = 2 controls, n = 3 mutants. (L) PCR analysis of DNA from FACS-sorted donor (CD45.2) splenocytes 12 wk after transplantation showing the absence of the Ptenflox but presence of the PtenΔ allele. (M–O) Pten, pAktTh308, pAktSer473, and pGSK3βSer9 levels in BM LSKCD135−CD34− (top) or splenic LSK cells (bottom) of PtenΔMx and controls (pI-pC treated). A representative FACS plot (M) and the fold change in the expression levels (N and O) are shown. Three independent experiments, n = 6 for each group. BM: P = 0.01 Pten, P > 0.05 pAktTh308, pAktSer473, and pGSK3βSer9. Spleen: P = 0.04 Pten, P > 0.05 pAktTh308, pAktSer473, and pGSK3βSer9. Unless otherwise indicated, the data presented in this figure refer to at least three independent experiments using at least three mice per group. Data are provided as mean ± SE.CC BY-NC-SA · PubMed Central
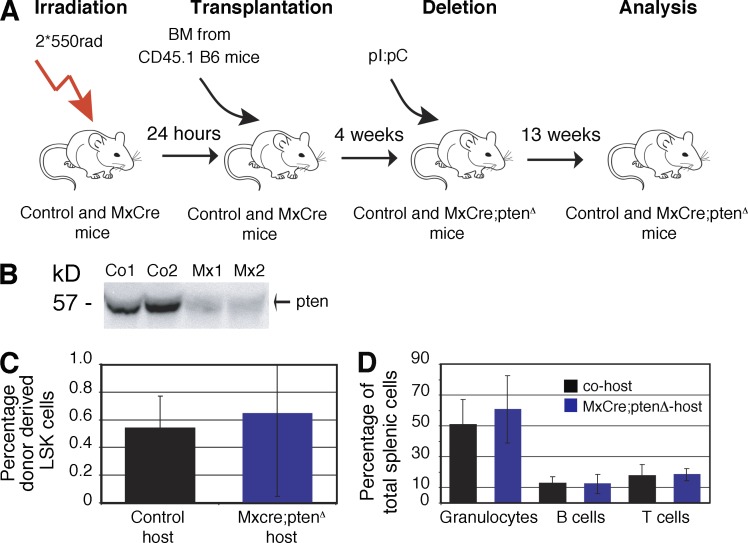
Figure 5. Pten loss mobilizes HSCs in a hematopietic cell–autonomous manner. (A) Experimental setup used to generate reverse chimeras. (B) PTEN expression in BM stromal cells by Western blot. (C) Percentage of donor-derived wild-type LSK cells isolated from control and MxCre;ptenΔ hosts. black, co-host; blue, MxCre;ptenΔ host. P > 0.05. n = 3 MxCre;ptenΔ, n = 3 control mice. (D) Percentages of donor-derived wild-type mature granulocytes, B cells, and CD4 T cells in spleens isolated from control and MxCre;ptenΔ hosts. P > 0.05. n = 3 MxCre;ptenΔ, n = 3 control mice. Data are provided as mean ± SE.
Figure 5. Pten loss mobilizes HSCs in a hematopietic cell–autonomous manner. (A) Experimental setup used to generate reverse chimeras. (B) PTEN expression in BM stromal cells by Western blot. (C) Percentage of donor-derived wild-type LSK cells isolated from control and MxCre;ptenΔ hosts. black, co-host; blue, MxCre;ptenΔ host. P > 0.05. n = 3 MxCre;ptenΔ, n = 3 control mice. (D) Percentages of donor-derived wild-type mature granulocytes, B cells, and CD4 T cells in spleens isolated from control and MxCre;ptenΔ hosts. P > 0.05. n = 3 MxCre;ptenΔ, n = 3 control mice. Data are provided as mean ± SE.CC BY-NC-SA · PubMed Central
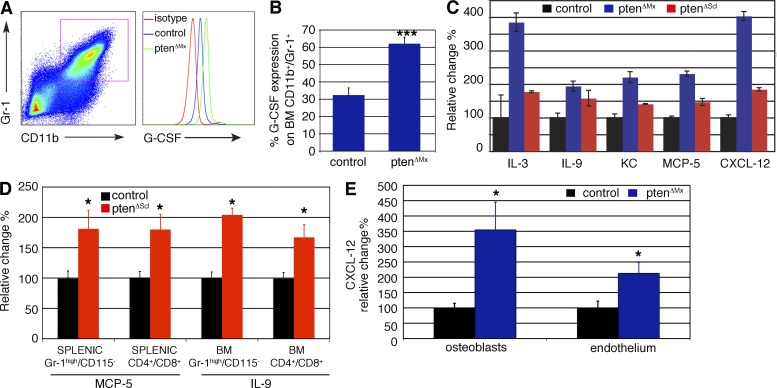
Figure 6. Increased level of mobilizing cytokines in ptenΔMx and ptenΔScl mice. (A and B) FACS plot (A) and histogram showing GCSF expression in BM CD11b+Gr-1+ cells of control and PtenΔMx mice. Two independent experiments were done for controls (n = 7) and mutants (n = 8; *** indicates statistically significant change, P = 0.0008). (C) Cytokine array screen showing serum levels of indicated cytokines 15 d (PtenΔMx) or 28 d (PtenΔScl) after deletion. This screen has been performed once with n = 2 per group. (D) MCP-5 and IL-9 levels in splenic Gr-1high/CD115− and CD4+CD8+ cells or BM CD11b+Gr-1+ and CD4+CD8+ cells of PtenΔScl mice and control counterparts. Data are shown as fold change as compared with control levels. P = 0.01, MCP-5 in Gr-1high/CD115− cells. P = 0.007, MCP-5 in CD4+CD8+ cells. P = 0.03, IL-9 in BM CD4+CD8+ cells. P = 0.04, IL-9 in BM CD11b+Gr-1+ cells. Three independent experiments were performed, n = 11 controls and n = 6 mutants. (E) CXCL-12 levels observed in osteoblasts (CD45−CD31−Ter119−CD51+Sca-1− cells) and endothelial cells (CD45−Ter119−CD31+) of PtenΔMx mice and controls. Data are shown as fold change as compared with control levels. Two independent experiments (5 controls and 10 mutants) were performed. P < 0.01, osteoblasts, P < 0.05 endothelial cells. Data are provided as mean ± SE. Unless otherwise indicated, * indicates statistically significant change with P < 0.05.
Figure 6. Increased level of mobilizing cytokines in ptenΔMx and ptenΔScl mice. (A and B) FACS plot (A) and histogram showing GCSF expression in BM CD11b+Gr-1+ cells of control and PtenΔMx mice. Two independent experiments were done for controls (n = 7) and mutants (n = 8; *** indicates statistically significant change, P = 0.0008). (C) Cytokine array screen showing serum levels of indicated cytokines 15 d (PtenΔMx) or 28 d (PtenΔScl) after deletion. This screen has been performed once with n = 2 per group. (D) MCP-5 and IL-9 levels in splenic Gr-1high/CD115− and CD4+CD8+ cells or BM CD11b+Gr-1+ and CD4+CD8+ cells of PtenΔScl mice and control counterparts. Data are shown as fold change as compared with control levels. P = 0.01, MCP-5 in Gr-1high/CD115− cells. P = 0.007, MCP-5 in CD4+CD8+ cells. P = 0.03, IL-9 in BM CD4+CD8+ cells. P = 0.04, IL-9 in BM CD11b+Gr-1+ cells. Three independent experiments were performed, n = 11 controls and n = 6 mutants. (E) CXCL-12 levels observed in osteoblasts (CD45−CD31−Ter119−CD51+Sca-1− cells) and endothelial cells (CD45−Ter119−CD31+) of PtenΔMx mice and controls. Data are shown as fold change as compared with control levels. Two independent experiments (5 controls and 10 mutants) were performed. P < 0.01, osteoblasts, P < 0.05 endothelial cells. Data are provided as mean ± SE. Unless otherwise indicated, * indicates statistically significant change with P < 0.05.CC BY-NC-SA · PubMed Central
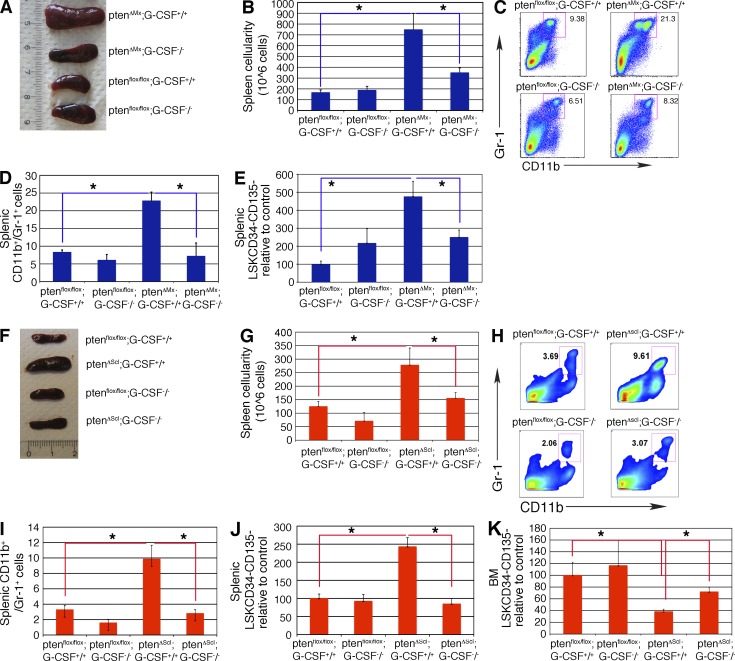
Figure 7. In the absence of G-CSF, the Pten mutant phenotype is rescued. (A) Spleens of Ptenfl/fl, Ptenfl/fl;G-CSF−/−, PtenΔMx;G-CSF−/−, or PtenΔMx;G-CSF+/+ 15 d after deletion. (B) Splenic cellularity of Ptenfl/fl, Ptenfl/fl;G-CSF−/−, PtenΔMx;G-CSF−/−, or PtenΔMx;G-CSF+/+ 15 d after deletion. Ptenfl/fl versus PtenΔMx;G-CSF+/+, P = 0.02. PtenΔMx;G-CSF+/+ versus PtenΔMx;G-CSF−/−, P = 0.04. Ptenfl/fl versus Ptenfl/fl G-CSF−/−, P = 0.36. (B–E) Four independent experiments, n = 7 each group. (C and D) Percentages of CD11b+Gr-1+ cells in the spleens of Ptenfl/fl, Ptenfl/fl;G-CSF−/−, PtenΔMx;G-CSF−/−, or PtenΔMx;G-CSF+/+ 15 d after deletion. Ptenfl/fl versus PtenΔMx;G-CSF+/+, P = 0.01. PtenΔMx;G-CSF+/+ versus PtenΔMx;G-CSF−/−, P = 0.01. Ptenfl/fl versus Ptenfl/fl G-CSF−/−, P = 0.29. (E) Relative changes in splenic LSKCD34−CD135− levels. Ptenfl/fl versus PtenΔMx;G-CSF+/+, P = 0.04. PtenΔMx;G-CSF+/+ versus PtenΔMx;G-CSF−/−, P = 0.04. Ptenfl/fl versus Ptenfl/fl G-CSF−/−, P = 0.07. (F) Spleens of PtenΔMx;G-CSF−/− or PtenΔScl;G-CSF+/+ mice or their control counterpart Ptenfl/fl and or Ptenfl/fl;G-CSF−/− after 28 d of Tx diet. (G) Splenic cellularity of PtenΔMx;G-CSF−/− or PtenΔScl;G-CSF+/+ mice or their control counterpart Ptenfl/fl and or Ptenfl/fl;G-CSF−/− after 28 d of Tx diet. Ptenfl/fl versus PtenΔscl;G-CSF+/+, P = 0.026. PtenΔScl;G-CSF+/+ versus PtenΔScl;G-CSF−/−, P = 0.047. Five independent experiments, n = 10 each group. (H and I) CD11b+Gr-1+ cells in the spleens of PtenΔScl;G-CSF−/−, PtenΔScl;G-CSF+/+, Ptenfl/fl, or Ptenfl/fl;G-CSF−/− mice which were fed with Tx for 28 d. A representative FACS plot and a histogram are shown in E and G, respectively. Ptenfl/fl versus PtenΔscl;G-CSF+/+, P = 0.029. PtenΔScl;G-CSF+/+ versus PtenΔScl;G-CSF−/−, P = 0.002. Three independent experiments are shown, n = 7 each group (H and K). (J) Relative changes in the levels of LSKCD34−CD135− in the BM and spleen of PtenΔScl;G-CSF−/−, PtenΔScl;G-CSF+/+, Ptenfl/fl, or Ptenfl/fl;G-CSF−/− mice. Ptenfl/fl versus PtenΔscl;G-CSF+/+, P = 0.036. PtenΔScl;G-CSF+/+ versus PtenΔScl;G-CSF−/−, P = 0.042. (K) Relative changes in the levels of LSKCD34−CD135− in the BM and spleen of PtenΔScl;G-CSF−/−, PtenΔScl;G-CSF+/+, Ptenfl/fl, or Ptenfl/fl;G-CSF−/− mice. Ptenfl/fl versus PtenΔscl;G-CSF+/+, P = 0.037. PtenΔScl;G-CSF+/+ versus PtenΔScl;G-CSF−/−, P = 0.16. Data are provided as mean ± SE. Unless otherwise indicated, * indicates statistically significant change with P < 0.05.
Figure 7. In the absence of G-CSF, the Pten mutant phenotype is rescued. (A) Spleens of Ptenfl/fl, Ptenfl/fl;G-CSF−/−, PtenΔMx;G-CSF−/−, or PtenΔMx;G-CSF+/+ 15 d after deletion. (B) Splenic cellularity of Ptenfl/fl, Ptenfl/fl;G-CSF−/−, PtenΔMx;G-CSF−/−, or PtenΔMx;G-CSF+/+ 15 d after deletion. Ptenfl/fl versus PtenΔMx;G-CSF+/+, P = 0.02. PtenΔMx;G-CSF+/+ versus PtenΔMx;G-CSF−/−, P = 0.04. Ptenfl/fl versus Ptenfl/fl G-CSF−/−, P = 0.36. (B–E) Four independent experiments, n = 7 each group. (C and D) Percentages of CD11b+Gr-1+ cells in the spleens of Ptenfl/fl, Ptenfl/fl;G-CSF−/−, PtenΔMx;G-CSF−/−, or PtenΔMx;G-CSF+/+ 15 d after deletion. Ptenfl/fl versus PtenΔMx;G-CSF+/+, P = 0.01. PtenΔMx;G-CSF+/+ versus PtenΔMx;G-CSF−/−, P = 0.01. Ptenfl/fl versus Ptenfl/fl G-CSF−/−, P = 0.29. (E) Relative changes in splenic LSKCD34−CD135− levels. Ptenfl/fl versus PtenΔMx;G-CSF+/+, P = 0.04. PtenΔMx;G-CSF+/+ versus PtenΔMx;G-CSF−/−, P = 0.04. Ptenfl/fl versus Ptenfl/fl G-CSF−/−, P = 0.07. (F) Spleens of PtenΔMx;G-CSF−/− or PtenΔScl;G-CSF+/+ mice or their control counterpart Ptenfl/fl and or Ptenfl/fl;G-CSF−/− after 28 d of Tx diet. (G) Splenic cellularity of PtenΔMx;G-CSF−/− or PtenΔScl;G-CSF+/+ mice or their control counterpart Ptenfl/fl and or Ptenfl/fl;G-CSF−/− after 28 d of Tx diet. Ptenfl/fl versus PtenΔscl;G-CSF+/+, P = 0.026. PtenΔScl;G-CSF+/+ versus PtenΔScl;G-CSF−/−, P = 0.047. Five independent experiments, n = 10 each group. (H and I) CD11b+Gr-1+ cells in the spleens of PtenΔScl;G-CSF−/−, PtenΔScl;G-CSF+/+, Ptenfl/fl, or Ptenfl/fl;G-CSF−/− mice which were fed with Tx for 28 d. A representative FACS plot and a histogram are shown in E and G, respectively. Ptenfl/fl versus PtenΔscl;G-CSF+/+, P = 0.029. PtenΔScl;G-CSF+/+ versus PtenΔScl;G-CSF−/−, P = 0.002. Three independent experiments are shown, n = 7 each group (H and K). (J) Relative changes in the levels of LSKCD34−CD135− in the BM and spleen of PtenΔScl;G-CSF−/−, PtenΔScl;G-CSF+/+, Ptenfl/fl, or Ptenfl/fl;G-CSF−/− mice. Ptenfl/fl versus PtenΔscl;G-CSF+/+, P = 0.036. PtenΔScl;G-CSF+/+ versus PtenΔScl;G-CSF−/−, P = 0.042. (K) Relative changes in the levels of LSKCD34−CD135− in the BM and spleen of PtenΔScl;G-CSF−/−, PtenΔScl;G-CSF+/+, Ptenfl/fl, or Ptenfl/fl;G-CSF−/− mice. Ptenfl/fl versus PtenΔscl;G-CSF+/+, P = 0.037. PtenΔScl;G-CSF+/+ versus PtenΔScl;G-CSF−/−, P = 0.16. Data are provided as mean ± SE. Unless otherwise indicated, * indicates statistically significant change with P < 0.05.CC BY-NC-SA · PubMed Central

Verification

Claims the paper makes

The claims and statistics of this paper haven’t been checked yet.

Run the check — free, no account needed. It reads the open-access text and checks the sources it cites.

A few free checks a day · papers already verified open instantly · results are public

Claims other papers make about this one

Each is checked against this paper’s own text: does it say what the citing paper says it does?

Self-check

Percentages, sums and reported differences re-computed from the paper’s own numbers.

The self-check needs the paper’s full text.

Citations

Cites

Show all 11 references

Research works printed but not linked: 53

  1. Arai, 2004, Tie2/angiopoietin-1 signaling regulates hematopoietic stem cell quiescence in the bone marrow niche, Cell., 118, 149, 10.1016/j.cell.2004.07.004 · DOI
  2. Avagyan, 2008, A quantitative trait locus on chromosome 4 affects cycling of hematopoietic stem and progenitor cells through regulation of TGF-beta 2 responsiveness, J. Immunol., 181, 5904, 10.4049/jimmunol.181.9.5904 · DOI
  3. Baccelli, 2012, The evolving concept of cancer and metastasis stem cells, J. Cell Biol., 198, 281, 10.1083/jcb.201202014 · DOI
  4. Basu, 2007, Protein phosphatase 2A plays an important role in stromal cell-derived factor-1/CXC chemokine ligand 12-mediated migration and adhesion of CD34+ cells, J. Immunol., 179, 3075, 10.4049/jimmunol.179.5.3075 · DOI
  5. Bonnet, 2011, Posttranscriptional deregulation of MYC via PTEN constitutes a major alternative pathway of MYC activation in T-cell acute lymphoblastic leukemia, Blood., 117, 6650, 10.1182/blood-2011-02-336842 · DOI
  6. Brognard, 2007, PHLPP and a second isoform, PHLPP2, differentially attenuate the amplitude of Akt signaling by regulating distinct Akt isoforms, Mol. Cell., 25, 917, 10.1016/j.molcel.2007.02.017 · DOI · Paper page
  7. Chen, 2006, The deficiency of Akt1 is sufficient to suppress tumor development in Pten+/- mice, Genes Dev., 20, 1569, 10.1101/gad.1395006 · DOI
  8. Chow, 2011, Bone marrow CD169+ macrophages promote the retention of hematopoietic stem and progenitor cells in the mesenchymal stem cell niche, J. Exp. Med., 208, 261, 10.1084/jem.20101688 · DOI
  9. Christopher, 2011, Expression of the G-CSF receptor in monocytic cells is sufficient to mediate hematopoietic progenitor mobilization by G-CSF in mice, J. Exp. Med., 208, 251, 10.1084/jem.20101700 · DOI
  10. Cross, 1995, Inhibition of glycogen synthase kinase-3 by insulin mediated by protein kinase B, Nature., 378, 785, 10.1038/378785a0 · DOI · Paper page
  11. Ding, 2012, Endothelial and perivascular cells maintain haematopoietic stem cells, Nature., 481, 457, 10.1038/nature10783 · DOI
  12. Doulatov, 2012, Hematopoiesis: a human perspective, Cell Stem Cell., 10, 120, 10.1016/j.stem.2012.01.006 · DOI · Paper page
  13. Ehninger, 2011, The bone marrow stem cell niche grows up: mesenchymal stem cells and macrophages move in, J. Exp. Med., 208, 421, 10.1084/jem.20110132 · DOI
  14. Essers, 2010, Targeting leukemic stem cells by breaking their dormancy, Mol. Oncol., 4, 443, 10.1016/j.molonc.2010.06.001 · DOI
  15. Freeman, 2006, Genetic background controls tumor development in PTEN-deficient mice, Cancer Res., 66, 6492, 10.1158/0008-5472.CAN-05-4143 · DOI
  16. Göthert, 2005, In vivo fate-tracing studies using the Scl stem cell enhancer: embryonic hematopoietic stem cells significantly contribute to adult hematopoiesis, Blood., 105, 2724, 10.1182/blood-2004-08-3037 · DOI · Paper page
  17. Groszer, 2001, Negative regulation of neural stem/progenitor cell proliferation by the Pten tumor suppressor gene in vivo, Science., 294, 2186, 10.1126/science.1065518 · DOI · Paper page
  18. Gu, 2011, CREB is a novel nuclear target of PTEN phosphatase, Cancer Res., 71, 2821, 10.1158/0008-5472.CAN-10-3399 · DOI
  19. Guo, 2008, Multi-genetic events collaboratively contribute to Pten-null leukaemia stem-cell formation, Nature., 453, 529, 10.1038/nature06933 · DOI
  20. Hasegawa, 2000, Progenitor cell mobilization by granulocyte colony-stimulating factor controlled by loci on chromosomes 2 and 11, Blood., 95, 1872, 10.1182/blood.V95.5.1872.005k26_1872_1874 · DOI
  21. Henckaerts, 2002, Genetically determined variation in the number of phenotypically defined hematopoietic progenitor and stem cells and in their response to early-acting cytokines, Blood., 99, 3947, 10.1182/blood.V99.11.3947 · DOI
  22. Henckaerts, 2004, The positive regulatory effect of TGF-beta2 on primitive murine hemopoietic stem and progenitor cells is dependent on age, genetic background, and serum factors, J. Immunol., 173, 2486, 10.4049/jimmunol.173.4.2486 · DOI
  23. Juntilla, 2010, AKT1 and AKT2 maintain hematopoietic stem cell function by regulating reactive oxygen species, Blood., 115, 4030, 10.1182/blood-2009-09-241000 · DOI · Paper page
  24. Kalaitzidis, 2012, mTOR complex 1 plays critical roles in hematopoiesis and Pten-loss-evoked leukemogenesis, Cell Stem Cell., 11, 429, 10.1016/j.stem.2012.06.009 · DOI
  25. Kharas, 2010, Constitutively active AKT depletes hematopoietic stem cells and induces leukemia in mice, Blood., 115, 1406, 10.1182/blood-2009-06-229443 · DOI
  26. Knobbe, 2008, The roles of PTEN in development, physiology and tumorigenesis in mouse models: a tissue-by-tissue survey, Oncogene., 27, 5398, 10.1038/onc.2008.238 · DOI
  27. Krutzik, 2011, Phospho flow cytometry methods for the analysis of kinase signaling in cell lines and primary human blood samples, Methods Mol. Biol., 699, 179, 10.1007/978-1-61737-950-5_9 · DOI
  28. Kühn, 1995, Inducible gene targeting in mice, Science., 269, 1427, 10.1126/science.7660125 · DOI · Paper page
  29. Lander, 2012, What does the concept of the stem cell niche really mean today?, BMC Biol., 10, 19, 10.1186/1741-7007-10-19 · DOI
  30. Lapidot, 2002, Current understanding of stem cell mobilization: the roles of chemokines, proteolytic enzymes, adhesion molecules, cytokines, and stromal cells, Exp. Hematol., 30, 973, 10.1016/S0301-472X(02)00883-4 · DOI
  31. Laterveer, 1995, Interleukin-8 induces rapid mobilization of hematopoietic stem cells with radioprotective capacity and long-term myelolymphoid repopulating ability, Blood., 85, 2269, 10.1182/blood.V85.8.2269.bloodjournal8582269 · DOI
  32. Lee, 2010, mTOR activation induces tumor suppressors that inhibit leukemogenesis and deplete hematopoietic stem cells after Pten deletion, Cell Stem Cell., 7, 593, 10.1016/j.stem.2010.09.015 · DOI
  33. Magee, 2012, Temporal changes in PTEN and mTORC2 regulation of hematopoietic stem cell self-renewal and leukemia suppression, Cell Stem Cell., 11, 415, 10.1016/j.stem.2012.05.026 · DOI
  34. Mei, 2012, Cxcr2 and Cxcl5 regulate the IL-17/G-CSF axis and neutrophil homeostasis in mice, J. Clin. Invest., 122, 974, 10.1172/JCI60588 · DOI
  35. Miletic, 2010, Coordinate suppression of B cell lymphoma by PTEN and SHIP phosphatases, J. Exp. Med., 207, 2407, 10.1084/jem.20091962 · DOI
  36. Nervi, 2006, Cytokines and hematopoietic stem cell mobilization, J. Cell. Biochem., 99, 690, 10.1002/jcb.21043 · DOI
  37. Palomero, 2007, Mutational loss of PTEN induces resistance to NOTCH1 inhibition in T-cell leukemia, Nat. Med., 13, 1203, 10.1038/nm1636 · DOI
  38. Park, 2012, The hematopoietic stem cell niche, Front Biosci (Landmark Ed)., 17, 30, 10.2741/3913 · DOI
  39. Qian, 2007, Critical role of thrombopoietin in maintaining adult quiescent hematopoietic stem cells, Cell Stem Cell., 1, 671, 10.1016/j.stem.2007.10.008 · DOI
  40. Sugiyama, 2006, Maintenance of the hematopoietic stem cell pool by CXCL12-CXCR4 chemokine signaling in bone marrow stromal cell niches, Immunity., 25, 977, 10.1016/j.immuni.2006.10.016 · DOI
  41. Svensson, 2011, Slow disease progression in a C57BL/6 pten-deficient mouse model of prostate cancer, Am. J. Pathol., 179, 502, 10.1016/j.ajpath.2011.03.014 · DOI
  42. Szilvassy, 1990, Quantitative assay for totipotent reconstituting hematopoietic stem cells by a competitive repopulation strategy, Proc. Natl. Acad. Sci. USA., 87, 8736, 10.1073/pnas.87.22.8736 · DOI
  43. Tesio, 2011, Breaking the cell cycle of HSCs by p57 and friends, Cell Stem Cell., 9, 187, 10.1016/j.stem.2011.08.005 · DOI
  44. Tesio, 2011, Enhanced c-Met activity promotes G-CSF-induced mobilization of hematopoietic progenitor cells via ROS signaling, Blood., 117, 419, 10.1182/blood-2009-06-230359 · DOI
  45. Van Zant, 1983, Genetic control of hematopoietic kinetics revealed by analyses of allophenic mice and stem cell suicide, Cell., 35, 639, 10.1016/0092-8674(83)90096-X · DOI
  46. Vivanco, 2007, Identification of the JNK signaling pathway as a functional target of the tumor suppressor PTEN, Cancer Cell., 11, 555, 10.1016/j.ccr.2007.04.021 · DOI
  47. Wilson, 2004, c-Myc controls the balance between hematopoietic stem cell self-renewal and differentiation, Genes Dev., 18, 2747, 10.1101/gad.313104 · DOI · Paper page
  48. Winkler, 2010, Bone marrow macrophages maintain hematopoietic stem cell (HSC) niches and their depletion mobilizes HSCs, Blood., 116, 4815, 10.1182/blood-2009-11-253534 · DOI · Paper page
  49. Xu, 2012, The effect Akt2 deletion on tumor development in Pten(+/-) mice, Oncogene., 31, 518, 10.1038/onc.2011.243 · DOI
  50. Yamazaki, 2011, Nonmyelinating Schwann cells maintain hematopoietic stem cell hibernation in the bone marrow niche, Cell., 147, 1146, 10.1016/j.cell.2011.09.053 · DOI
  51. Yilmaz, 2006, Pten dependence distinguishes haematopoietic stem cells from leukaemia-initiating cells, Nature., 441, 475, 10.1038/nature04703 · DOI · Paper page
  52. Yoshihara, 2007, Thrombopoietin/MPL signaling regulates hematopoietic stem cell quiescence and interaction with the osteoblastic niche, Cell Stem Cell., 1, 685, 10.1016/j.stem.2007.10.020 · DOI
  53. Yu, 2006, Hematopoietic stem cell exhaustion impacted by p18 INK4C and p21 Cip1/Waf1 in opposite manners, Blood., 107, 1200, 10.1182/blood-2005-02-0685 · DOI · Paper page

Cited by

Metadata

Authors
Tesio, M., Oser, G. M., Baccelli, I., Blanco-Bose, W., Wu, H., Göthert, J. R., Kogan, S. C., & Trumpp, A.
Venue
Journal of Experimental Medicine
Published
2013-10-14
Volume
210
Issue
11
Pages
2337-2349
ISSN
  • 1540-9538
  • 0022-1007
Cited by
35
References
11
Language
en

About these checks

Registry, retraction, Cites and statistics results are computed, not judged, with one exception: a printed reference that no index lists is read once by a model before it counts as a citation error. Claims are extracted by a model and kept only when their quote appears verbatim in the text; each cited source is then checked, with a model’s help, for whether it says what the claim relies on. Those verdicts can be wrong — read the claim’s quote and the cited source before relying on one.

Statistics and arithmetic are recomputed, not judged.

Confidence bands are shown only for fields calibrated on our annotated test set. None is calibrated yet, so no band is shown.

What counts as a claim ›How we measure confidence ›How we check this ›

Are you an author, or do you see a problem with this page? Request a review