

The DOI matches its Crossref record; 49 of the 51 references it cites were found in a registry or an index; 26 of the 47 sources its claims cite were checked for support.
Differential roles of microglia and monocytes in the inflamed central nervous system
Open accessAbstract
In the human disorder multiple sclerosis (MS) and in the model experimental autoimmune encephalomyelitis (EAE), macrophages predominate in demyelinated areas and their numbers correlate to tissue damage. Macrophages may be derived from infiltrating monocytes or resident microglia, yet are indistinguishable by light microscopy and surface phenotype. It is axiomatic that T cell–mediated macrophage activation is critical for inflammatory demyelination in EAE, yet the precise details by which tissue injury takes place remain poorly understood. In the present study, we addressed the cellular basis of autoimmune demyelination by discriminating microglial versus monocyte origins of effector macrophages. Using serial block-face scanning electron microscopy (SBF-SEM), we show that monocyte-derived macrophages associate with nodes of Ranvier and initiate demyelination, whereas microglia appear to clear debris. Gene expression profiles confirm that monocyte-derived macrophages are highly phagocytic and inflammatory, whereas those arising from microglia demonstrate an unexpected signature of globally suppressed cellular metabolism at disease onset. Distinguishing tissue-resident macrophages from infiltrating monocytes will point toward new strategies to treat disease and promote repair in diverse inflammatory pathologies in varied organs.
Overview
AI snapshot
Written from the paper’s full text.
TL;DR
Using dual reporter mice and serial block-face scanning electron microscopy, this study shows that monocyte-derived macrophages (MDMs) initiate demyelination at EAE onset, often at nodes of Ranvier, while microglia-derived macrophages (MiDMs) clear debris and show a suppressed metabolic gene signature. Expression profiling further indicates that MDMs and MiDMs have distinct effector programs despite sharing the same inflammatory CNS environment.
Key findings
- At EAE onset, MDMs and MiDMs were present in equal numbers; MiDM expansion began at peak, and at recovery MiDMs returned near preonset numbers while MDM frequency continued to decline.
- Most axoglial units (55/75; 73%) contacted both MDMs and MiDMs, but where only one myeloid type was present (20/75; 27%), nearly all were MDMs (18/20); 2–3 MDMs attached to each of 18/20 (90%) such units.
- MDMs contacted nodes of Ranvier in 7/75 (9%) axoglial units and showed invasive/demyelinating behavior; no MiDMs contacted nodes of Ranvier. In CCR2-deficient mice, demyelination was significantly reduced at EAE onset.
- MDM-enriched genes more often encoded effector functions than MiDM-enriched genes (18/28; 64.3% vs. 18/48; 37.5%), and MiDMs showed down-regulation of metabolic, activation, phagocytosis, and reactive oxygen species–related functions at onset.
Methods
- EAE was induced with MOG35–55 in Ccr2rfp/+::Cx3cr1gfp/+ and Ccr2rfp/rfp::Cx3cr1gfp/+ mice; CNS mononuclear cells were analyzed by flow cytometry and sorted as F4/80+RFP+ MDMs or F4/80+GFP+ MiDMs.
- Confocal 3D morphometry and serial block-face scanning electron microscopy (SBF-SEM) were used to distinguish MDMs from MiDMs and quantify their relationships to axoglial units, nodes of Ranvier, myelin debris, and demyelination.
- nCounter digital multiplexed gene expression of 179 inflammation-related genes was performed on naive microglia/monocytes and sorted MiDMs/MDMs across EAE onset, peak, and recovery, with hierarchical clustering, k-means clustering, and Ingenuity IPA pathway analysis.
Limitations
- The paper states that the study focused on a single pathogenically relevant time point, EAE onset, so it could not decipher the phenotypic fate of infiltrated monocytes.
- The authors state that conclusions should not be generalized beyond the present disease paradigm, noting that other models such as spinal cord contusion include Ly6Clow/CX3CR1gfp monocytes that are highly pathogenic.
- Evident from the text: the ultrastructural criteria used to distinguish MDMs and MiDMs may not be universally present in other pathological circumstances, and the findings are from mouse EAE rather than direct human MS tissue.
Model-written summary. Check it against the paper before relying on it.
Integrity signals
Registry
Cites
Statistics
Figures
Verification
Claims the paper makes
91 Own result · 24 Own interpretation · 14 Partly supported · 14 Own method · 6 No full text of the sources · 4 Supported · 4 No basis given · 3 Supported so far · 3 Not checked yet · 1 Sources not found · accuracy not yet measured
The sources with a verdict support this claim; the rest weren’t checked yet, have no full text we could read, or their verdicts aren’t rated yet.
In the paper
“Microglia and monocytes are ontogenetically distinct: microglia derive from yolk-sac progenitors during embryogenesis (Ginhoux et al., 2010; Schulz et al., 2012)”
§ Differential roles of microglia and monocytes in the inflamed central nervous system > Abstract
What the sources say
- Supportedcites Ginhoux et al., 2010 source
The supplied copy (section labeled Abstract; no page number provided) reports that adult microglia derive from primitive myeloid progenitors arising before embryonic day 8. Its fate-mapping results also suggest that progenitors migrate from the yolk sac into the embryonic brain between E8.5 and E9.5. (LLM, conf=0.94)
- Not checked — no full text of the sourcecites Schulz et al., 2012 source
plaindirect- Asserted: passes — The authors put it forward as true.
- Checkable: passes — It can be checked against evidence.
- Load-bearing: passes — The paper’s conclusions depend on it.
- Based: passes — The paper gives a reason why it holds.
- Supported
The sources with a verdict support this claim; the rest weren’t checked yet, have no full text we could read, or their verdicts aren’t rated yet.
In the paper
“In MS autopsy tissues, prominent macrophage accumulation correlates with active demyelination (Ferguson et al., 1997; Trapp et al., 1998).”
§ Differential roles of microglia and monocytes in the inflamed central nervous system > Abstract
What the sources say
- Not checked — no full text of the sourcecites Ferguson et al., 1997 source
- Supportedcites Trapp et al., 1998 source
The Tissue section describes brain tissue from patients with MS and defines active demyelinating lesions by abundant inflammatory cells and myelin-containing macrophages. The section on axonal transection in relation to demyelinating activity also reports abundant phagocytic macrophages in the center of an active lesion. The paper does not give a statistical correlation, but it supports the stated association. (LLM, conf=0.90)
plaincorrelational- Asserted: passes — The authors put it forward as true.
- Checkable: passes — It can be checked against evidence.
- Load-bearing: passes — The paper’s conclusions depend on it.
- Based: passes — The paper gives a reason why it holds.
The sources with a verdict support this claim; the rest weren’t checked yet, have no full text we could read, or their verdicts aren’t rated yet.
In the paper
“In EAE, which models inflammatory aspects of MS (Williams et al., 1994; Ransohoff, 2012), macrophages dominate the inflammatory infiltrates and their numbers correlate to EAE severity (Huitinga et al., 1990, 1993; Ajami et al., 2011).”
§ Differential roles of microglia and monocytes in the inflamed central nervous system > Abstract
What the sources say
- Not checked — no full text of the sourcecites Williams et al., 1994
- Supportedcites Ransohoff, 2012 source
In “Experimental autoimmune encephalomyelitis: the forerunner,” the paper explicitly describes EAE as a model of the inflammatory aspects of MS. The citation is attached to that clause, not to the separate claim about macrophage numbers. (LLM, conf=0.95)
plaindirect- Asserted: passes — The authors put it forward as true.
- Checkable: passes — It can be checked against evidence.
- Load-bearing: passes — The paper’s conclusions depend on it.
- Based: passes — The paper gives a reason why it holds.
The cited sources support only part of this claim — read each source’s verdict below.
In the paper
“Based on kinetics of cell accumulation and differential marker expression, it’s estimated that 30–50% of activated macrophages in active MS lesions derive from microglia (Brück et al., 1995; Trebst et al., 2001).”
§ Differential roles of microglia and monocytes in the inflamed central nervous system > Abstract
What the sources say
- Not matchedcites Brück et al., 1995
Couldn’t be matched to a paper in Crossref, so it can’t be checked.
- Partly supportedcites Trebst et al., 2001 sourceExperimental — accuracy not yet measured
The section on hematogenous monocytes and resident microglia during early demyelination (page unavailable) supports a microglial contribution, but estimates that 58–75% of CD68-positive phagocytes in early-active zones most plausibly represent resident microglia—not 30–50%. The paper does not give the claimed percentage for activated macrophages across active MS lesions. (LLM, conf=0.86)
hedged- Asserted: passes — The authors put it forward as true.
- Checkable: passes — It can be checked against evidence.
- Load-bearing: passes — The paper’s conclusions depend on it.
- Based: passes — The paper gives a reason why it holds.
- Not matched
The cited sources support only part of this claim — read each source’s verdict below.
In the paper
“CCR2 is essential for monocyte recruitment to CNS tissues during immune-mediated inflammation (Fife et al., 2000; Izikson et al., 2000; Savarin et al., 2010).”
§ Differential roles of microglia and monocytes in the inflamed central nervous system > RESULTS > Nodal pathology without demyelination at EAE onset in Ccr2rfp/rfp::Cx3cr1gfp/+ mice
What the sources say
- Supportedcites Fife et al., 2000 source
In Results and Discussion, the authors report that CCR2-deficient EAE recipients had a dramatic reduction in CNS-infiltrating monocytes. They conclude that CCR2 is critical for the accumulation of host-derived CNS mononuclear cells and propose that, without CCR2, monocytes fail to accumulate in the CNS during this autoimmune inflammatory disease. (LLM, conf=0.90)
- Partly supportedcites Izikson et al., 2000 sourceExperimental — accuracy not yet measured
The Results and Discussion report that CCR2-deficient mice did not develop the CNS infiltrates seen in wild-type mice with experimental autoimmune encephalomyelitis, and suggest that CCR2 signaling is needed to recruit monocytes into the brain and spinal cord. The claim omits that this evidence comes from a mouse model and states the proposed recruitment mechanism as a general requirement during immune-mediated CNS inflammation. (LLM, conf=0.83)
- Partly supportedcites Savarin et al., 2010 sourceExperimental — accuracy not yet measured
The Discussion (page unavailable) reports a drastic reduction in CNS monocytes in CCR2-deficient mice during JHMV infection. That supports a role for CCR2 in monocyte recruitment during viral encephalitis, but does not establish that CCR2 is essential across immune-mediated CNS inflammation generally. (LLM, conf=0.84)
plaindirect- Asserted: passes — The authors put it forward as true.
- Checkable: passes — It can be checked against evidence.
- Load-bearing: passes — The paper’s conclusions depend on it.
- Based: passes — The paper gives a reason why it holds.
- Supported
The cited sources support only part of this claim — read each source’s verdict below.
In the paper
“To address the role of MDMs in demyelination at EAE onset, we investigated clinical characteristics in relation to node pathology and demyelination in Ccr2rfp/rfp::Cx3cr1gfp/+ mice in which MDMs were virtually absent from inflamed EAE tissues and replaced in large part by neutrophils (Saederup et al., 2010).”
§ Differential roles of microglia and monocytes in the inflamed central nervous system > RESULTS > Nodal pathology without demyelination at EAE onset in Ccr2rfp/rfp::Cx3cr1gfp/+ mice
What the sources say
- Partly supportedcites Saederup et al., 2010 sourceExperimental — accuracy not yet measured
The Discussion (page unavailable) says Ly6Chi monocytes were virtually absent from the CNS of these mice and that neutrophils replaced them. The Results section on CD115+ infiltration reports markedly fewer monocytes/macrophages, but also says Ly6Clo cells remained; it does not establish that all monocyte-derived macrophages (MDMs) were virtually absent. (LLM, conf=0.84)
plain- Asserted: passes — The authors put it forward as true.
- Checkable: passes — It can be checked against evidence.
- Load-bearing: passes — The paper’s conclusions depend on it.
- Based: passes — The paper gives a reason why it holds.
- Partly supported
Every source the paper cites for this claim was checked and supports it.
In the paper
“The study described transcription factors and miRNAs characteristic of microglia in healthy brain but not in peripheral monocytes.”
§ Differential roles of microglia and monocytes in the inflamed central nervous system > DISCUSSION
What the sources say
- Supportedcites Butovsky et al., 2014 source
In Results, ‘Identification of a unique microglial signature’ (page unavailable), the paper compares microglia from naïve adult mouse CNS with splenic monocytes, identifies microglia-enriched genes including Sall1, and reports PU.1 as a differentially expressed transcription factor. In Results, ‘Identification of a microglial microRNA signature’ (page unavailable), it identifies miRNAs specifically expressed in microglia compared with other immune cells, including monocytes. (LLM, conf=0.88)
plain- Asserted: passes — The authors put it forward as true.
- Checkable: passes — It can be checked against evidence.
- Load-bearing: passes — The paper’s conclusions depend on it.
- Based: passes — The paper gives a reason why it holds.
- Supported
The cited sources support only part of this claim — read each source’s verdict below.
In the paper
“The detailed profiling after separating cells via CD45dim status showed distinct mRNA, miRNA, and protein expression by microglia as compared with infiltrating monocytes or neuroepithelial brain cells (Butovsky et al., 2014).”
§ Differential roles of microglia and monocytes in the inflamed central nervous system > DISCUSSION
What the sources say
- Partly supportedcites Butovsky et al., 2014 sourceExperimental — accuracy not yet measured
The Results (‘Identification of a unique microglial signature’; page not provided) report distinct gene and protein expression in CD11b+CD45Low microglia versus splenic Ly6C+ monocytes. The paper also compares microglial genes and miRNAs with astrocytes, oligodendrocytes and neurons, but does not report a protein-expression comparison with those CNS cells. The monocytes in the principal profiling comparison were isolated from spleen, not identified as infiltrating cells in the brain. (LLM, conf=0.87)
plaincorrelational- Asserted: passes — The authors put it forward as true.
- Checkable: passes — It can be checked against evidence.
- Load-bearing: passes — The paper’s conclusions depend on it.
- Based: passes — The paper gives a reason why it holds.
- Partly supported
Every source the paper cites for this claim was checked and supports it.
In the paper
“SBF-SEM would exhibit advantages for spatial resolution (Denk and Horstmann, 2004) required for characterizing relationships of myeloid cells to axoglial units during the inflammatory demyelinating process at EAE onset.”
§ Differential roles of microglia and monocytes in the inflamed central nervous system > DISCUSSION
What the sources say
- Supportedcites Denk and Horstmann, 2004 source
The Results (Figure 1) show that SBF-SEM resolves synaptic vesicles and actin filaments, and the Discussion states that it produces 3D datasets at nanoscopic resolution. The citation supports the spatial-resolution point; the proposed application to myeloid cells and EAE is the citing authors’ framing, not a finding attributed to this source. (LLM, conf=0.90)
hedgedconditional- Asserted: passes — The authors put it forward as true.
- Checkable: passes — It can be checked against evidence.
- Load-bearing: passes — The paper’s conclusions depend on it.
- Based: passes — The paper gives a reason why it holds.
- Supported
The cited sources support only part of this claim — read each source’s verdict below.
In the paper
“Brisk microglial proliferation (Ajami et al., 2011) may have accelerated a gradual return toward a homeostatic expression profile, as suggested by MiDM up-regulation of fos, jun, myc, and CSF1 (Wei et al., 2010) at disease onset.”
§ Differential roles of microglia and monocytes in the inflamed central nervous system > DISCUSSION
What the sources say
- Not checked — no full text of the sourcecites Ajami et al., 2011 source
- Partly supportedcites Wei et al., 2010 sourceExperimental — accuracy not yet measured
The Introduction (page not provided) identifies CSF-1 as a regulator of mononuclear-phagocyte proliferation and microglial development, supporting the relevance of CSF1 to the proposed proliferation. It does not report MiDM up-regulation of fos, jun, myc, or CSF1 at disease onset, or a return to a homeostatic expression profile. (LLM, conf=0.85)
hedgedconditional- Asserted: passes — The authors put it forward as true.
- Checkable: passes — It can be checked against evidence.
- Load-bearing: unclear — It is unclear whether the paper’s conclusions depend on it.
- Based: passes — The paper gives a reason why it holds.
- It may state two separate claims as one. 39
- Probably not a substantial claim. 16
The cited sources support only part of this claim — read each source’s verdict below.
In the paper
“When F4/80+ macrophages were isolated from CNS and analyzed by flow cytometry using cells from double-heterozygous Ccr2rfp::Cx3cr1gfp mice with EAE, GFP was expressed by CD45dim/Ly6C− microglia, whereas RFP was restricted to CD45high/Ly6C+ monocytes (Saederup et al., 2010; Mizutani et al., 2012).”
§ Differential roles of microglia and monocytes in the inflamed central nervous system > Abstract
What the sources say
- Partly supportedcites Saederup et al., 2010 sourceExperimental — accuracy not yet measured
The Results section (Infiltration by CD115+ monocytes; page not supplied) reports GFP-high, RFP-negative CD45-low microglia at peak EAE, supporting the microglial part of the claim. But the Discussion reports RFP-low Ly6C-low cells in the diseased CNS, and the Results (Three color imaging with a myeloid marker) identifies RFP-positive cells likely to be Ly6C-low monocytes or T cells. RFP is therefore not restricted to Ly6C-positive monocytes as claimed. (LLM, conf=0.88)
- Partly supportedcites Mizutani et al., 2012 sourceExperimental — accuracy not yet measured
The Results section (Fig. 6A,B; page not provided) reports GFP-positive microglia and RFP in CD45-high infiltrating leukocytes, with no RFP signal in CD45-low microglia, in double-reporter mice with EAE. It does not report isolating F4/80-positive macrophages or directly establish the claimed Ly6C-negative and Ly6C-positive gates; its RFP finding is stated for CD45-high leukocytes rather than exclusively for Ly6C-positive monocytes. (LLM, conf=0.85)
plaincorrelational- Asserted: passes — The authors put it forward as true.
- Checkable: passes — It can be checked against evidence.
- Load-bearing: passes — The paper’s conclusions depend on it.
- Based: passes — The paper gives a reason why it holds.
It may state two separate claims as one.
- Partly supported
The cited sources support only part of this claim — read each source’s verdict below.
In the paper
“These genes included a large spectrum of intracellular signaling components from the MAP-kinase pathways, as well as TGFβ and receptor, both of which are implicated in the naïve microglial phenotype (Butovsky et al., 2014).”
§ Differential roles of microglia and monocytes in the inflamed central nervous system > RESULTS > Differential expression of macrophage effector functions by MiDMs and MDMs
What the sources say
- Partly supportedcites Butovsky et al., 2014 sourceExperimental — accuracy not yet measured
The Results section identifies Tgfbr1 as a microglia-specific gene and reports that TGF-β is important for microglial development and maintenance. The passages do not establish that a broad spectrum of MAP-kinase signaling components is implicated in the naïve microglial phenotype; searches for MAP-kinase and MAPK did not find that point. Page numbers were unavailable in our copy. (LLM, conf=0.84)
plaincorrelational- Asserted: passes — The authors put it forward as true.
- Checkable: passes — It can be checked against evidence.
- Load-bearing: unclear — It is unclear whether the paper’s conclusions depend on it.
- Based: passes — The paper gives a reason why it holds.
It may state two separate claims as one.
- Partly supported
The cited sources support only part of this claim — read each source’s verdict below.
In the paper
“At EAE onset when SBF-SEM analyses were performed, MiDMs predominantly suppressed the distinctive gene expression pattern which correlates to their unique phenotype (Chiu et al., 2013), reflected by the observation that MiDMs down-regulated far more genes than were up-regulated (Table S1).”
§ Differential roles of microglia and monocytes in the inflamed central nervous system > RESULTS > Expression patterns at EAE onset in relation to MiDM and MDM function
What the sources say
- Partly supportedcites Chiu et al., 2013 sourceExperimental — accuracy not yet measured
The Results section on microglia-specific marker genes identifies a distinctive expression pattern that separates microglia from peripheral macrophages and monocytes. Chiu et al. studied an ALS mouse model, however, and do not establish that MiDMs suppress that pattern at EAE onset; the citing sentence attributes the up- versus down-regulated gene count to its own Table S1. (LLM, conf=0.83)
plaindirect- Asserted: passes — The authors put it forward as true.
- Checkable: passes — It can be checked against evidence.
- Load-bearing: passes — The paper’s conclusions depend on it.
- Based: passes — The paper gives a reason why it holds.
It may state two separate claims as one.
- Partly supported
The cited sources support only part of this claim — read each source’s verdict below.
In the paper
“GAPDH is found in complexes that limit the translation of inflammatory gene transcripts in activated mouse macrophages (Mukhopadhyay et al., 2009; Arif et al., 2012).”
§ Differential roles of microglia and monocytes in the inflamed central nervous system > DISCUSSION
What the sources say
- Partly supportedcites Mukhopadhyay et al., 2009 sourceExperimental — accuracy not yet measured
The “Elucidation of the heterotetrameric GAIT complex” section identifies GAPDH as part of the functional GAIT complex, and the Abstract says that complex suppresses translation of inflammatory mRNAs in myeloid cells. The copy describes IFN-γ-treated human monocytes and monocytic cells, but does not establish this finding specifically in activated mouse macrophages. (LLM, conf=0.87)
- Supportedcites Arif et al., 2012 source
The Abstract identifies GAPDH as part of the functional murine GAIT complex and says that complex inhibits translation of GAIT target mRNAs in IFN-γ-activated mouse macrophages. The Discussion likewise describes GAPDH joining the complex that binds target mRNAs and represses translation. Page numbers were not provided in our copy. (LLM, conf=0.94)
plaindirect- Asserted: passes — The authors put it forward as true.
- Checkable: passes — It can be checked against evidence.
- Load-bearing: fails — The paper’s conclusions may not depend on it.
- Based: passes — The paper gives a reason why it holds.
Probably not a substantial claim. The paper’s conclusions may not depend on it.
- Partly supported
Every source the paper cites for this claim was checked and supports it.
In the paper
“our conclusions should not be generalized beyond the present disease paradigm: in other models, such as spinal cord contusion, the inflammatory infiltrate includes Ly6Clow/CX3CR1gfp monocytes, which are highly pathogenic (Donnelly et al., 2011).”
§ Differential roles of microglia and monocytes in the inflamed central nervous system > DISCUSSION
What the sources say
- Supportedcites Donnelly et al., 2011 source
The Discussion (page not specified in our copy) says that Ly6Clo/iNOS+ monocytes accumulate after spinal cord injury in wild-type mice and are responsible for impaired recovery. The Results report that this population is scarce in CX3CR1-deficient mice, supporting the cited point that the infiltrating subset is pathogenic in this injury model. (LLM, conf=0.90)
plain- Asserted: passes — The authors put it forward as true.
- Checkable: passes — It can be checked against evidence.
- Load-bearing: passes — The paper’s conclusions depend on it.
- Based: passes — The paper gives a reason why it holds.
It may state two separate claims as one.
- Supported
The cited sources support only part of this claim — read each source’s verdict below.
In the paper
“Activated myeloid cells are the proximate effectors of a bewildering array of acute and chronic disorders (Wynn et al., 2013).”
§ Differential roles of microglia and monocytes in the inflamed central nervous system > DISCUSSION
What the sources say
- Partly supportedcites Wynn et al., 2013 sourceExperimental — accuracy not yet measured
The ‘Macrophages in disease’ section describes inflammatory macrophages causing tissue damage after injury and contributing to chronic inflammatory and autoimmune disease. ‘Macrophages in inflammatory disease’ also identifies roles in several chronic conditions. The paper does not establish the broader claim that activated myeloid cells generally are the proximate effectors of a wide array of both acute and chronic disorders; it also describes protective macrophage roles. Page numbers were not available in our copy. (LLM, conf=0.82)
plaindirect- Asserted: passes — The authors put it forward as true.
- Checkable: passes — It can be checked against evidence.
- Load-bearing: fails — The paper’s conclusions may not depend on it.
- Based: passes — The paper gives a reason why it holds.
Probably not a substantial claim. The paper’s conclusions may not depend on it.
- Partly supported
A result the paper reports from its own data — it cites no other source for it, so there is none to check. The quote shows it is in the paper.
In the paper
“Total mitochondrial numbers and volumes were equal in MDMs and MiDMs (unpublished data).”
§ Differential roles of microglia and monocytes in the inflamed central nervous system > RESULTS > MDMs and MiDMs exhibit differentiating ultrastructural characteristics at EAE onset
plain- Asserted: passes — The authors put it forward as true.
- Checkable: passes — It can be checked against evidence.
- Load-bearing: fails — The paper’s conclusions may not depend on it.
- Based: passes — The paper gives a reason why it holds.
Probably not a substantial claim. The paper’s conclusions may not depend on it.
A result the paper reports from its own data — it cites no other source for it, so there is none to check. The quote shows it is in the paper.
In the paper
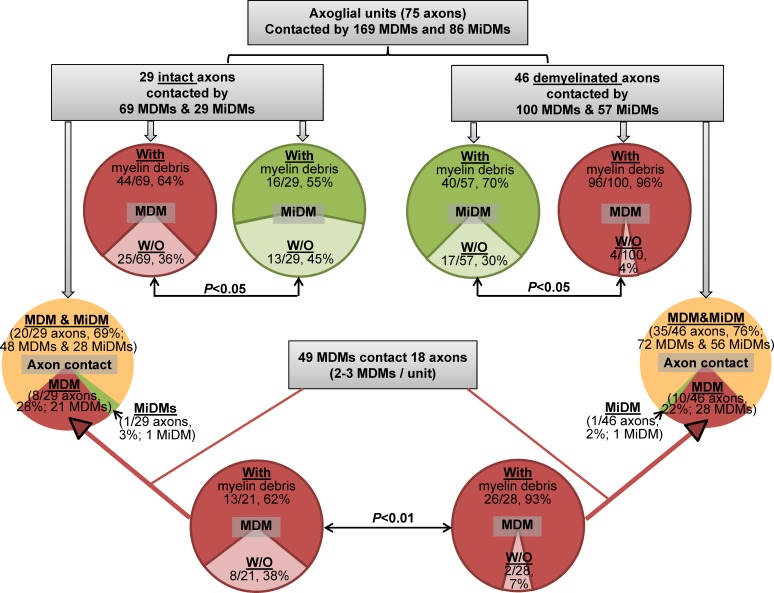
“In all, 49 MDMs interacting with axoglial units in absence of nearby MiDMs, 2-3 MDMs were attached to each (n = 18) axoglial unit.”
§ Differential roles of microglia and monocytes in the inflamed central nervous system > RESULTS > In the CNS of mice of EAE, MDMs and MiDMs exhibit different accumulation kinetics
plaincorrelationaln = 18- Asserted: passes — The authors put it forward as true.
- Checkable: passes — It can be checked against evidence.
- Load-bearing: unclear — It is unclear whether the paper’s conclusions depend on it.
- Based: passes — The paper gives a reason why it holds.
It may state two separate claims as one.
A result the paper reports from its own data — it cites no other source for it, so there is none to check. The quote shows it is in the paper.
In the paper
“MDMs had bilobulated or irregular nuclei, whereas MiDMs had round nuclei (unpublished data).”
§ Differential roles of microglia and monocytes in the inflamed central nervous system > RESULTS > MDMs and MiDMs exhibit differentiating ultrastructural characteristics at EAE onset
plaincorrelational- Asserted: passes — The authors put it forward as true.
- Checkable: passes — It can be checked against evidence.
- Load-bearing: unclear — It is unclear whether the paper’s conclusions depend on it.
- Based: passes — The paper gives a reason why it holds.
It may state two separate claims as one.
A result the paper reports from its own data — it cites no other source for it, so there is none to check. The quote shows it is in the paper.
In the paper
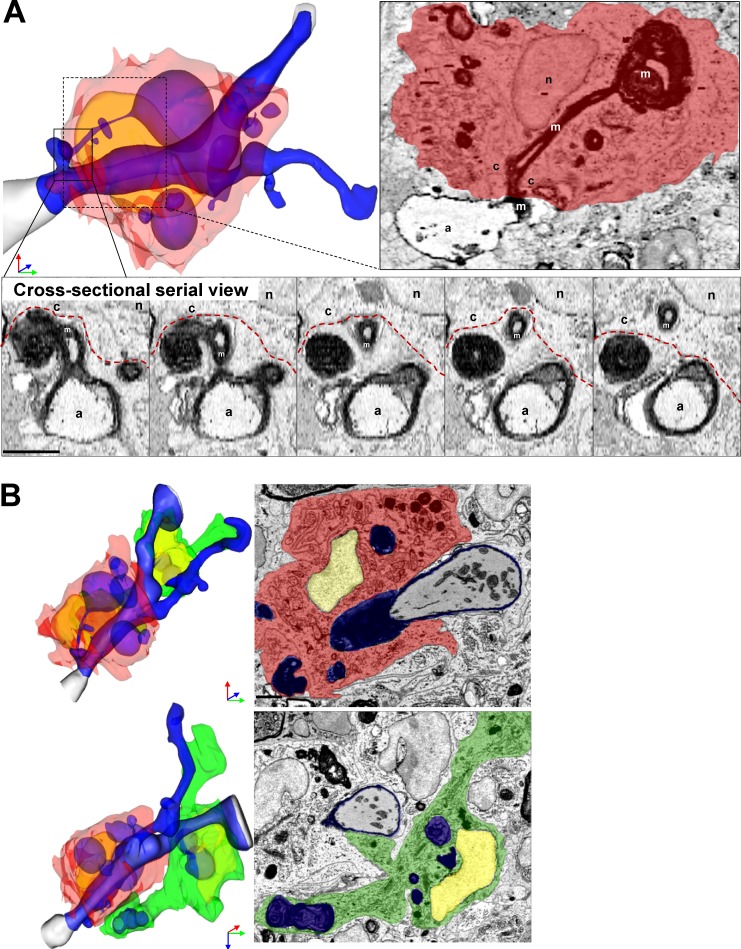
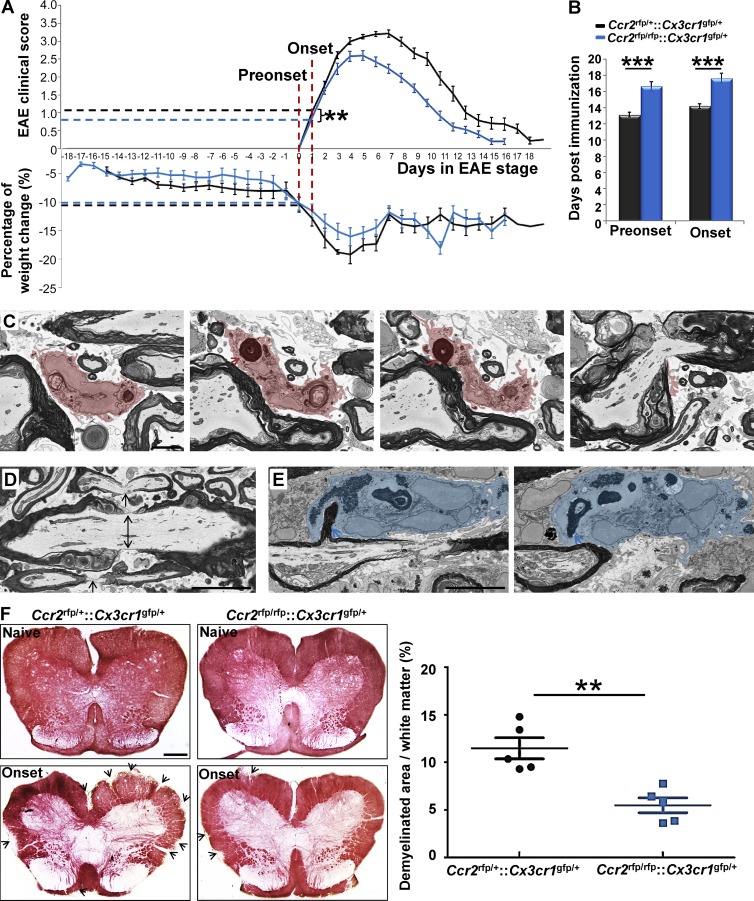
“3D reconstructions showed four representative MDMs at axoglial units: show one carrying out active demyelination, three at nodes of Ranvier.”
§ Differential roles of microglia and monocytes in the inflamed central nervous system > RESULTS > In the CNS of mice of EAE, MDMs and MiDMs exhibit different accumulation kinetics
plaincorrelational- Asserted: passes — The authors put it forward as true.
- Checkable: passes — It can be checked against evidence.
- Load-bearing: unclear — It is unclear whether the paper’s conclusions depend on it.
- Based: passes — The paper gives a reason why it holds.
It may state two separate claims as one.
A result the paper reports from its own data — it cites no other source for it, so there is none to check. The quote shows it is in the paper.
In the paper
“In contrast, a nearby MiDM encompassed a large fragment of myelin debris (Fig. 3 B) and contacted the nearby MDMs (Fig. 3 B), but made minimal connection to the axoglial unit (Fig. 3 B).”
§ Differential roles of microglia and monocytes in the inflamed central nervous system > RESULTS > MDMs initiated demyelination at EAE onset
plainSingle case- Asserted: passes — The authors put it forward as true.
- Checkable: passes — It can be checked against evidence.
- Load-bearing: passes — The paper’s conclusions depend on it.
- Based: passes — The paper gives a reason why it holds.
It may state two separate claims as one.
In the paper
“At recovery, MiDMs were found near preonset numbers as MDM frequency continued to decline, which is compatible with previous studies (Ajami et al., 2011).”
§ Differential roles of microglia and monocytes in the inflamed central nervous system > RESULTS > In the CNS of mice of EAE, MDMs and MiDMs exhibit different accumulation kinetics
What the sources say
- Not checked — no full text of the sourcecites Ajami et al., 2011 source
plaincorrelational- Asserted: passes — The authors put it forward as true.
- Checkable: passes — It can be checked against evidence.
- Load-bearing: passes — The paper’s conclusions depend on it.
- Based: passes — The paper gives a reason why it holds.
It may state two separate claims as one.
A result the paper reports from its own data — it cites no other source for it, so there is none to check. The quote shows it is in the paper.
In the paper
“There was a moderate delay in disease onset (Fig. 5 B) and slight reduction in EAE onset severity (Fig. 5 A) in Ccr2rfp/rfp::Cx3cr1gfp/+ mice.”
§ Differential roles of microglia and monocytes in the inflamed central nervous system > RESULTS > Nodal pathology without demyelination at EAE onset in Ccr2rfp/rfp::Cx3cr1gfp/+ mice
plaindirect- Asserted: passes — The authors put it forward as true.
- Checkable: passes — It can be checked against evidence.
- Load-bearing: passes — The paper’s conclusions depend on it.
- Based: passes — The paper gives a reason why it holds.
It may state two separate claims as one.
The paper states this without a source or data behind it here, so there is nothing to check it against. The quote shows it is in the paper.
In the paper
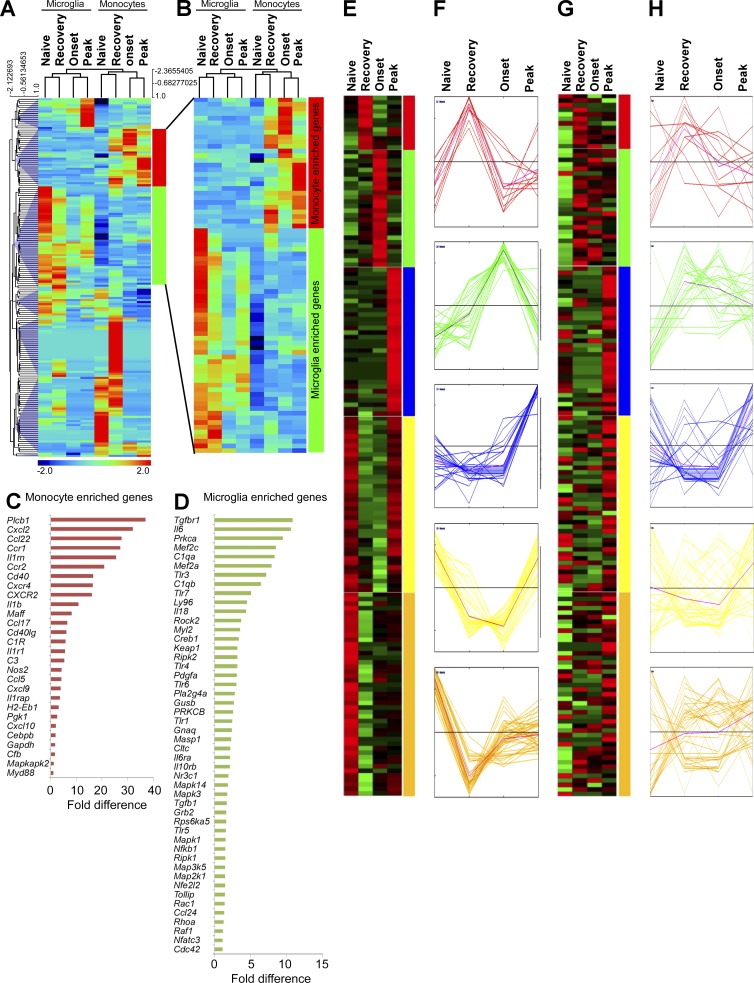
“Red group genes involved several surface molecules.”
§ Differential roles of microglia and monocytes in the inflamed central nervous system > RESULTS > Differential expression of macrophage effector functions by MiDMs and MDMs
plaincorrelational- Asserted: passes — The authors put it forward as true.
- Checkable: passes — It can be checked against evidence.
- Load-bearing: fails — The paper’s conclusions may not depend on it.
- Based: passes — The paper gives a reason why it holds.
Probably not a substantial claim. The paper’s conclusions may not depend on it.
A result the paper reports from its own data — it cites no other source for it, so there is none to check. The quote shows it is in the paper.
In the paper
“In particular, 8/29 intact and 10/46 demyelinated axoglial units were contacted solely by MDMs.”
§ Differential roles of microglia and monocytes in the inflamed central nervous system > RESULTS > MDMs initiated demyelination at EAE onset
plainn = 75- Asserted: passes — The authors put it forward as true.
- Checkable: passes — It can be checked against evidence.
- Load-bearing: passes — The paper’s conclusions depend on it.
- Based: passes — The paper gives a reason why it holds.
It may state two separate claims as one.
A result the paper reports from its own data — it cites no other source for it, so there is none to check. The quote shows it is in the paper.
In the paper
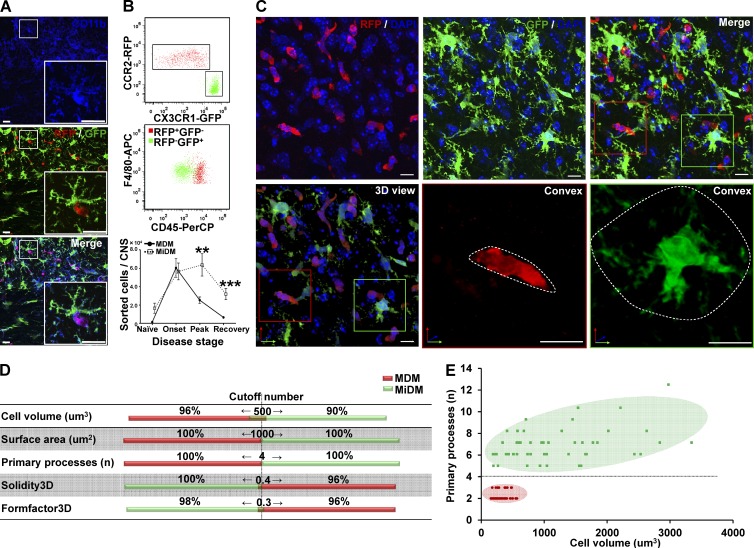
“We observed scant overlap of several values between MDMs and MiDMs (Fig. 1 D), and entirely nonoverlapping distributions for cell volume and primary processes (Fig. 1 E).”
§ Differential roles of microglia and monocytes in the inflamed central nervous system > RESULTS > Morphological features distinguish MDMs and MiDMs at EAE onset
plain- Asserted: passes — The authors put it forward as true.
- Checkable: passes — It can be checked against evidence.
- Load-bearing: passes — The paper’s conclusions depend on it.
- Based: passes — The paper gives a reason why it holds.
It may state two separate claims as one.
A result the paper reports from its own data — it cites no other source for it, so there is none to check. The quote shows it is in the paper.
In the paper
“Both yellow group and golden group genes were strongly expressed in naive microglia, reduced drastically at onset, and either returned to preEAE levels during recovery (yellow) or failed to do so (golden).”
§ Differential roles of microglia and monocytes in the inflamed central nervous system > RESULTS > Differential expression of macrophage effector functions by MiDMs and MDMs
boosteddirect- Asserted: passes — The authors put it forward as true.
- Checkable: passes — It can be checked against evidence.
- Load-bearing: passes — The paper’s conclusions depend on it.
- Based: passes — The paper gives a reason why it holds.
It may state two separate claims as one.
A result the paper reports from its own data — it cites no other source for it, so there is none to check. The quote shows it is in the paper.
In the paper
“Quantification in 3D reconstructions from 0.2-µm confocal z-stack images showed that MiDMs exhibited much larger size than MDMs along with multiple primary processes, which were sparse in MDMs (Fig. 1 D).”
§ Differential roles of microglia and monocytes in the inflamed central nervous system > RESULTS > Morphological features distinguish MDMs and MiDMs at EAE onset
plaincorrelational- Asserted: passes — The authors put it forward as true.
- Checkable: passes — It can be checked against evidence.
- Load-bearing: passes — The paper’s conclusions depend on it.
- Based: passes — The paper gives a reason why it holds.
It may state two separate claims as one.
A result the paper reports from its own data — it cites no other source for it, so there is none to check. The quote shows it is in the paper.
In the paper
“Microglia and MiDMs clustered together during unsupervised hierarchical clustering, as did monocytes and MDMs (Fig. 6, A and B).”
§ Differential roles of microglia and monocytes in the inflamed central nervous system > RESULTS > Expression profiling demonstrates differential MiDMs and MDMs gene expression across the time course of an EAE attack
plaincorrelational- Asserted: passes — The authors put it forward as true.
- Checkable: passes — It can be checked against evidence.
- Load-bearing: passes — The paper’s conclusions depend on it.
- Based: passes — The paper gives a reason why it holds.
It may state two separate claims as one.
A result the paper reports from its own data — it cites no other source for it, so there is none to check. The quote shows it is in the paper.
In the paper
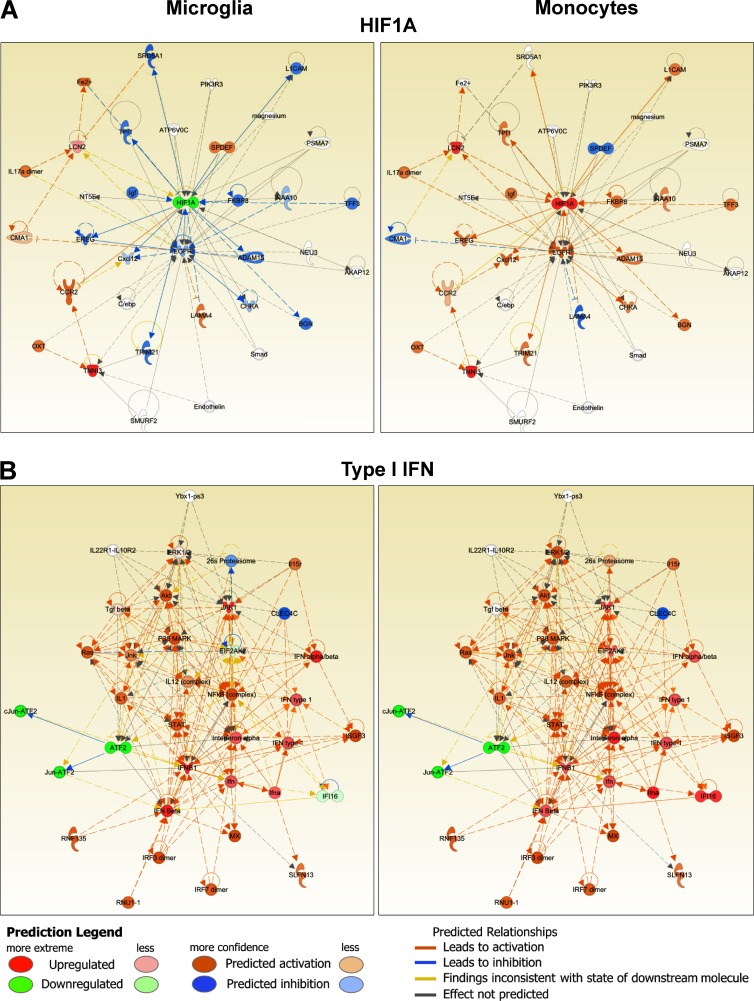
“The red, blue and green groups increased in MiDMs at onset, peak, and recovery, respectively.”
§ Differential roles of microglia and monocytes in the inflamed central nervous system > RESULTS > Differential expression of macrophage effector functions by MiDMs and MDMs
plaindirect- Asserted: passes — The authors put it forward as true.
- Checkable: passes — It can be checked against evidence.
- Load-bearing: unclear — It is unclear whether the paper’s conclusions depend on it.
- Based: passes — The paper gives a reason why it holds.
It may state two separate claims as one.
A result the paper reports from its own data — it cites no other source for it, so there is none to check. The quote shows it is in the paper.
In the paper
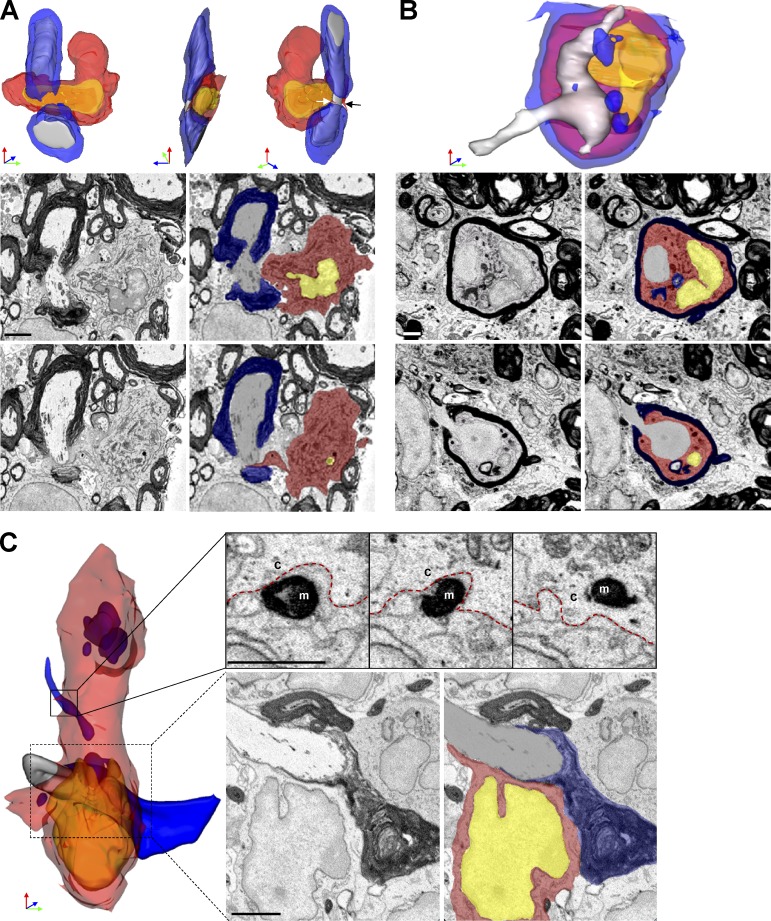
“At this node, paranode loops were disrupted and surrounded by MDM cytosol (Fig. 4 C), indicating likely involvement in damaging myelin near the node.”
§ Differential roles of microglia and monocytes in the inflamed central nervous system > RESULTS > MDMs surrounded apposed and invaded nodes of Ranvier at EAE onset
hedgedconditionalSingle case- Asserted: passes — The authors put it forward as true.
- Checkable: passes — It can be checked against evidence.
- Load-bearing: passes — The paper’s conclusions depend on it.
- Based: passes — The paper gives a reason why it holds.
It may state two separate claims as one.
A result the paper reports from its own data — it cites no other source for it, so there is none to check. The quote shows it is in the paper.
In the paper
“One representative MDM from Ccr2rfp/+::Cx3cr1gfp/+ tissue having concave nucleus (Fig. 5 C, left) had multiple intracellular myelin inclusions, one of which (Fig. 5 C, left middle) was physically connected to a myelin sheath (Fig. 5 C, right middle) at a paranode (Fig. 5 C, right), indicating active ongoing demyelination at a node of Ranvier.”
§ Differential roles of microglia and monocytes in the inflamed central nervous system > RESULTS > Nodal pathology without demyelination at EAE onset in Ccr2rfp/rfp::Cx3cr1gfp/+ mice
hedgeddirectSingle case- Asserted: passes — The authors put it forward as true.
- Checkable: passes — It can be checked against evidence.
- Load-bearing: passes — The paper’s conclusions depend on it.
- Based: passes — The paper gives a reason why it holds.
It may state two separate claims as one.
A result the paper reports from its own data — it cites no other source for it, so there is none to check. The quote shows it is in the paper.
In the paper
“In contrast, MiDM-enriched genes were strongly expressed in naive cells, almost uniformly silenced at onset, and began a return toward naive levels at peak and recovery (Fig. 6 B).”
§ Differential roles of microglia and monocytes in the inflamed central nervous system > RESULTS > Expression profiling demonstrates differential MiDMs and MDMs gene expression across the time course of an EAE attack
boostedcorrelational- Asserted: passes — The authors put it forward as true.
- Checkable: passes — It can be checked against evidence.
- Load-bearing: passes — The paper’s conclusions depend on it.
- Based: passes — The paper gives a reason why it holds.
It may state two separate claims as one.
A result the paper reports from its own data — it cites no other source for it, so there is none to check. The quote shows it is in the paper.
In the paper
“The axoglial unit appeared otherwise healthy and no myelin debris was found in the MDM cytosol.”
§ Differential roles of microglia and monocytes in the inflamed central nervous system > RESULTS > MDMs surrounded apposed and invaded nodes of Ranvier at EAE onset
hedgedSingle case- Asserted: passes — The authors put it forward as true.
- Checkable: passes — It can be checked against evidence.
- Load-bearing: unclear — It is unclear whether the paper’s conclusions depend on it.
- Based: passes — The paper gives a reason why it holds.
It may state two separate claims as one.
A result the paper reports from its own data — it cites no other source for it, so there is none to check. The quote shows it is in the paper.
In the paper
“Immunofluorescence staining for RFP and GFP in spinal cord at EAE onset showed that red MDMs exhibited elongated or spindle shape, whereas green MiDMs showed a process-bearing morphology (Fig. 1 C).”
§ Differential roles of microglia and monocytes in the inflamed central nervous system > RESULTS > Morphological features distinguish MDMs and MiDMs at EAE onset
plaincorrelational- Asserted: passes — The authors put it forward as true.
- Checkable: passes — It can be checked against evidence.
- Load-bearing: passes — The paper’s conclusions depend on it.
- Based: passes — The paper gives a reason why it holds.
It may state two separate claims as one.
A result the paper reports from its own data — it cites no other source for it, so there is none to check. The quote shows it is in the paper.
In the paper
“MDMs were the overwhelmingly dominant cells found in isolation attached to axoglial units and demonstrated destructive interactions with myelinated axons in 3D reconstructions”
§ Differential roles of microglia and monocytes in the inflamed central nervous system > DISCUSSION
boosteddirect- Asserted: passes — The authors put it forward as true.
- Checkable: passes — It can be checked against evidence.
- Load-bearing: passes — The paper’s conclusions depend on it.
- Based: passes — The paper gives a reason why it holds.
It may state two separate claims as one.
A result the paper reports from its own data — it cites no other source for it, so there is none to check. The quote shows it is in the paper.
In the paper
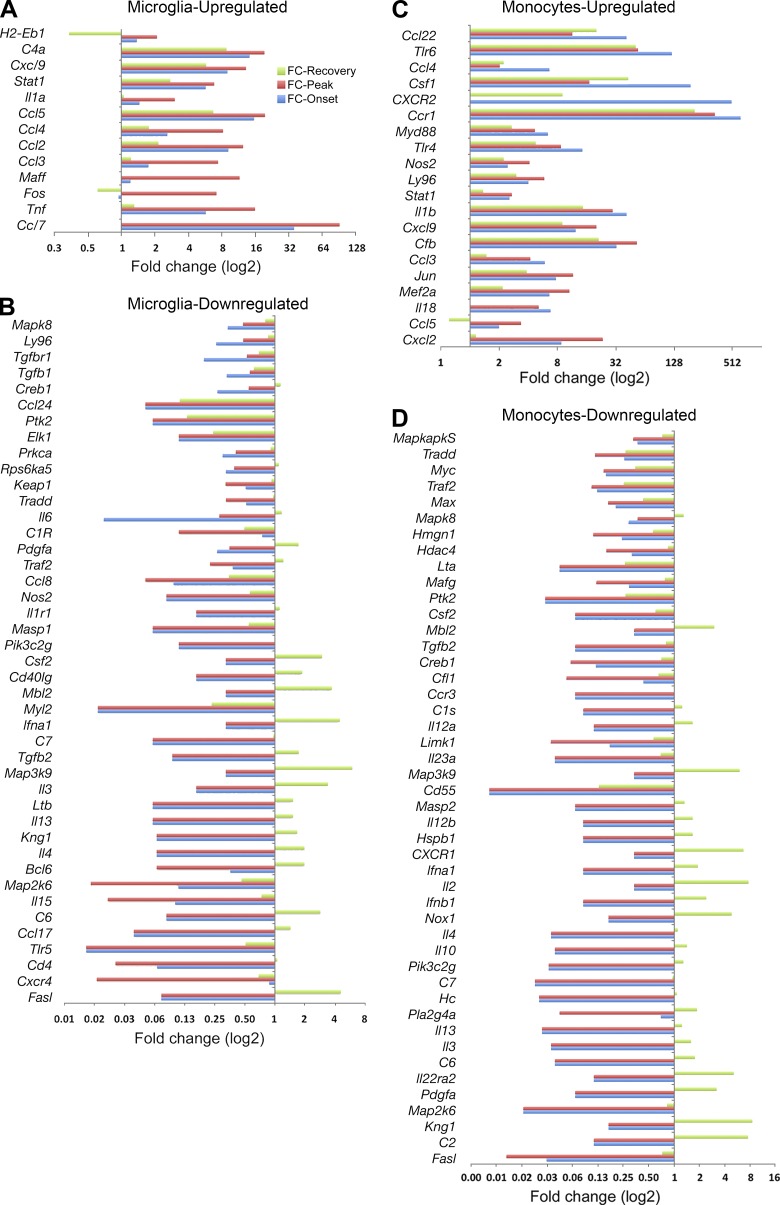
“In virtually every case (Fig. 8, A–D), these dissonant compensatory changes took place during recovery and almost always showed an increase in a gene that had been down-regulated during onset and peak.”
§ Differential roles of microglia and monocytes in the inflamed central nervous system > RESULTS > MiDM and MDM gene expression kinetics reflected return toward homeostasis in recovery stage
plaincorrelational- Asserted: passes — The authors put it forward as true.
- Checkable: passes — It can be checked against evidence.
- Load-bearing: passes — The paper’s conclusions depend on it.
- Based: passes — The paper gives a reason why it holds.
It may state two separate claims as one.
A result the paper reports from its own data — it cites no other source for it, so there is none to check. The quote shows it is in the paper.
In the paper
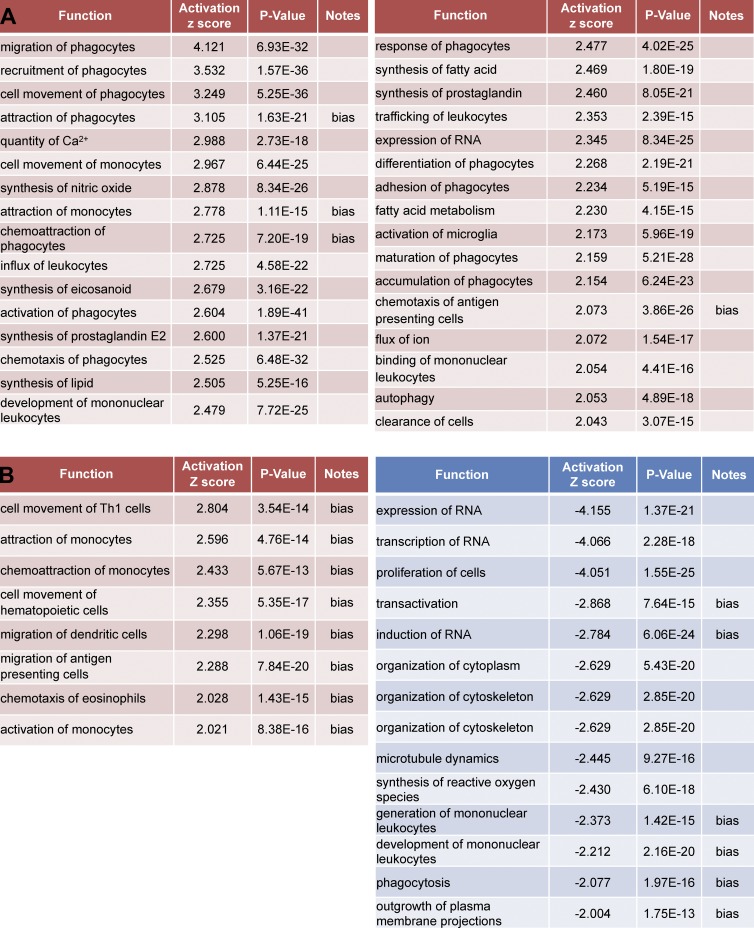
“In contrast, MDMs up-regulated far more genes than did MiDMs and up-regulated more transcripts than were down-regulated.”
§ Differential roles of microglia and monocytes in the inflamed central nervous system > RESULTS > Expression patterns at EAE onset in relation to MiDM and MDM function
plaincorrelational- Asserted: passes — The authors put it forward as true.
- Checkable: passes — It can be checked against evidence.
- Load-bearing: passes — The paper’s conclusions depend on it.
- Based: passes — The paper gives a reason why it holds.
It may state two separate claims as one.
In the paper
“Core elements such as RhoA (Xu et al., 2009) were regulated divergently and associated signaling components were predicted to be enhanced in MDMs but depressed in MiDMs, consistent with our phenotypic characterization using SBF-SEM.”
§ Differential roles of microglia and monocytes in the inflamed central nervous system > RESULTS > Convergent and divergent responses to upstream regulatory signaling by MiDMs and MDMs
What the sources say
- Not matchedcites Xu et al., 2009
Couldn’t be matched to a paper in Crossref, so it can’t be checked.
plaincorrelational- Asserted: passes — The authors put it forward as true.
- Checkable: passes — It can be checked against evidence.
- Load-bearing: passes — The paper’s conclusions depend on it.
- Based: passes — The paper gives a reason why it holds.
It may state two separate claims as one.
- Not matched
A result the paper reports from its own data — it cites no other source for it, so there is none to check. The quote shows it is in the paper.
In the paper
“Red group genes (increased at onset) comprised the smallest number and involved several surface molecules: CCR1, CCR7, CXCR2, and CD40.”
§ Differential roles of microglia and monocytes in the inflamed central nervous system > DISCUSSION
plaincorrelational- Asserted: passes — The authors put it forward as true.
- Checkable: passes — It can be checked against evidence.
- Load-bearing: unclear — It is unclear whether the paper’s conclusions depend on it.
- Based: passes — The paper gives a reason why it holds.
It may state two separate claims as one.
In the paper
“Microglial precursors are Myb independent, and microglia self-renew independently of bone marrow HSCs (Gomez Perdiguero et al., 2013).”
§ Differential roles of microglia and monocytes in the inflamed central nervous system > Abstract
What the sources say
- Not checked — no full text of the sourcecites Gomez Perdiguero et al., 2013 source
plain- Asserted: passes — The authors put it forward as true.
- Checkable: passes — It can be checked against evidence.
- Load-bearing: passes — The paper’s conclusions depend on it.
- Based: passes — The paper gives a reason why it holds.
It may state two separate claims as one.
A conclusion the paper draws from its own results — it cites no other source for it, so there is none to check. The quote shows it is in the paper.
In the paper
“Distinct developmental origin and renewal mechanisms imply that monocyte-derived macrophages (MDMs) and microglia-derived macrophages (MiDMs) might exert different functions in pathological processes.”
§ Differential roles of microglia and monocytes in the inflamed central nervous system > Abstract
hedgedconditional- Asserted: passes — The authors put it forward as true.
- Checkable: passes — It can be checked against evidence.
- Load-bearing: passes — The paper’s conclusions depend on it.
- Based: passes — The paper gives a reason why it holds.
Probably not a substantial claim.
- Rests on an assumption: Monocytes continuously differentiate throughout postnatal life from bone marrow hematopoietic stem cells, which require the transcription factor Myb.
None of the sources cited for this claim have been checked yet.
In the paper
“In EAE, which models inflammatory aspects of MS (Williams et al., 1994; Ransohoff, 2012), macrophages dominate the inflammatory infiltrates and their numbers correlate to EAE severity (Huitinga et al., 1990, 1993; Ajami et al., 2011).”
§ Differential roles of microglia and monocytes in the inflamed central nervous system > Abstract
What the sources say
- Not matchedcites Huitinga et al., 1990, 1993
Couldn’t be matched to a paper in Crossref, so it can’t be checked.
- Not checked — no full text of the sourcecites Ajami et al., 2011 source
plaincorrelational- Asserted: passes — The authors put it forward as true.
- Checkable: passes — It can be checked against evidence.
- Load-bearing: passes — The paper’s conclusions depend on it.
- Based: passes — The paper gives a reason why it holds.
It may state two separate claims as one.
- Not matched
A conclusion the paper draws from its own results — it cites no other source for it, so there is none to check. The quote shows it is in the paper.
In the paper
“We interpreted our ultrastructural findings to indicate that MDMs recognized altered nodal structure and initiated demyelination at EAE onset.”
§ Differential roles of microglia and monocytes in the inflamed central nervous system > RESULTS > Nodal pathology without demyelination at EAE onset in Ccr2rfp/rfp::Cx3cr1gfp/+ mice
hedgeddirect- Asserted: passes — The authors put it forward as true.
- Checkable: passes — It can be checked against evidence.
- Load-bearing: passes — The paper’s conclusions depend on it.
- Based: passes — The paper gives a reason why it holds.
It may state two separate claims as one.
A conclusion the paper draws from its own results — it cites no other source for it, so there is none to check. The quote shows it is in the paper.
In the paper
“In both MiDMs and MDMs, naive and recovery-stage expression profiles were more alike than were onset and peak-stage profiles (Fig. 6, A and B) suggesting a return to homeostasis at EAE recovery.”
§ Differential roles of microglia and monocytes in the inflamed central nervous system > RESULTS > Expression profiling demonstrates differential MiDMs and MDMs gene expression across the time course of an EAE attack
hedgedcorrelational- Asserted: passes — The authors put it forward as true.
- Checkable: passes — It can be checked against evidence.
- Load-bearing: passes — The paper’s conclusions depend on it.
- Based: passes — The paper gives a reason why it holds.
It may state two separate claims as one.
A conclusion the paper draws from its own results — it cites no other source for it, so there is none to check. The quote shows it is in the paper.
In the paper
“These characteristics of MDMs and MiDMs may not be universally present in other pathological circumstances but demonstrate an approach to ultrastructural distinction of myeloid cell populations in tissue sections.”
§ Differential roles of microglia and monocytes in the inflamed central nervous system > DISCUSSION
hedged- Asserted: passes — The authors put it forward as true.
- Checkable: passes — It can be checked against evidence.
- Load-bearing: passes — The paper’s conclusions depend on it.
- Based: passes — The paper gives a reason why it holds.
Probably not a substantial claim. It may state two separate claims as one.
A conclusion the paper draws from its own results — it cites no other source for it, so there is none to check. The quote shows it is in the paper.
In the paper
“Additionally, these data indicated that the separate ontogeny of microglia and monocytes will lead, probably by epigenetic influences, to divergent responses to some but not all environmental stimuli, with phenotypic consequences according to the CNS microenvironment.”
§ Differential roles of microglia and monocytes in the inflamed central nervous system > RESULTS > Convergent and divergent responses to upstream regulatory signaling by MiDMs and MDMs
hedgedconditional- Asserted: passes — The authors put it forward as true.
- Checkable: passes — It can be checked against evidence.
- Load-bearing: passes — The paper’s conclusions depend on it.
- Based: passes — The paper gives a reason why it holds.
It may state two separate claims as one.
What the paper did — it cites no source for this, so there is none to check. The quote shows it is in the paper.
In the paper
“The strength of the study is that the dual reporter system is sufficient to accurately distinguish monocyte versus microglial cells and thus to address the general concept that monocytes and microglia can exert differential functions in a CNS disease process.”
§ Differential roles of microglia and monocytes in the inflamed central nervous system > DISCUSSION
boosteddirect- Asserted: passes — The authors put it forward as true.
- Checkable: passes — It can be checked against evidence.
- Load-bearing: passes — The paper’s conclusions depend on it.
- Based: passes — The paper gives a reason why it holds.
It may state two separate claims as one.
A conclusion the paper draws from its own results — it cites no other source for it, so there is none to check. The quote shows it is in the paper.
In the paper
“The present observations extend this concept and provide a cellular basis for nodal pathology at the earliest stages of demyelination.”
§ Differential roles of microglia and monocytes in the inflamed central nervous system > DISCUSSION
plaincorrelational- Asserted: passes — The authors put it forward as true.
- Checkable: passes — It can be checked against evidence.
- Load-bearing: passes — The paper’s conclusions depend on it.
- Based: passes — The paper gives a reason why it holds.
It may state two separate claims as one.
What the paper did — it cites no source for this, so there is none to check. The quote shows it is in the paper.
In the paper
“we developed methods based on cell volume and process number (Fig. 1 E), to distinguish MDMs from MiDMs in 0.2-µm confocal optical sections, and translated this approach directly to SBF-SEM image sets at 0.2-µm intervals.”
§ Differential roles of microglia and monocytes in the inflamed central nervous system > DISCUSSION
plain- Asserted: passes — The authors put it forward as true.
- Checkable: passes — It can be checked against evidence.
- Load-bearing: passes — The paper’s conclusions depend on it.
- Based: passes — The paper gives a reason why it holds.
It may state two separate claims as one.
A claim is checked only against the cited paper’s full text, never its abstract, and none is available for its sources.
In the paper
“CCR7 and CD40 have been reported on activated microglia, including those observed in MS tissue sections (Kivisäkk et al., 2004; Serafini et al., 2006).”
§ Differential roles of microglia and monocytes in the inflamed central nervous system > DISCUSSION
What the sources say
plaincorrelational- Asserted: passes — The authors put it forward as true.
- Checkable: passes — It can be checked against evidence.
- Load-bearing: fails — The paper’s conclusions may not depend on it.
- Based: passes — The paper gives a reason why it holds.
Probably not a substantial claim. The paper’s conclusions may not depend on it.
The paper states this without a source or data behind it here, so there is nothing to check it against. The quote shows it is in the paper.
In the paper
“their preEAE states were extremely distinct, with monocytes being generated from a bone marrow progenitor within weeks of entry into CNS, whereas microglia originated during early embryogenesis and had inhabited a serum-free unique environment from midgestation.”
§ Differential roles of microglia and monocytes in the inflamed central nervous system > DISCUSSION
plain- Asserted: passes — The authors put it forward as true.
- Checkable: passes — It can be checked against evidence.
- Load-bearing: passes — The paper’s conclusions depend on it.
- Based: passes — The paper gives a reason why it holds.
It may state two separate claims as one.
What the paper did — it cites no source for this, so there is none to check. The quote shows it is in the paper.
In the paper
“Blinded observers (n = 3) scoring the nuclear morphology from SBF-SEM images included a research student, a research fellow and a neuroscientist.”
§ Differential roles of microglia and monocytes in the inflamed central nervous system > MATERIALS AND METHODS
plainn = 3- Asserted: passes — The authors put it forward as true.
- Checkable: passes — It can be checked against evidence.
- Load-bearing: fails — The paper’s conclusions may not depend on it.
- Based: passes — The paper gives a reason why it holds.
Probably not a substantial claim. The paper’s conclusions may not depend on it.
A conclusion the paper draws from its own results — it cites no other source for it, so there is none to check. The quote shows it is in the paper.
In the paper
“The technical and conceptual approach taken in this study may be applicable to other tissues and disease processes.”
§ Differential roles of microglia and monocytes in the inflamed central nervous system > DISCUSSION
hedgedconditional- Asserted: passes — The authors put it forward as true.
- Checkable: fails — It may be too vague to check against evidence.
- Load-bearing: fails — The paper’s conclusions may not depend on it.
- Based: passes — The paper gives a reason why it holds.
Probably not a substantial claim. It may be too vague to check against evidence. The paper’s conclusions may not depend on it.
What the paper did — it cites no source for this, so there is none to check. The quote shows it is in the paper.
In the paper
“Each experiment incorporated samples from at least three separate immunizations.”
§ Differential roles of microglia and monocytes in the inflamed central nervous system > MATERIALS AND METHODS
plain- Asserted: passes — The authors put it forward as true.
- Checkable: passes — It can be checked against evidence.
- Load-bearing: fails — The paper’s conclusions may not depend on it.
- Based: passes — The paper gives a reason why it holds.
Probably not a substantial claim. The paper’s conclusions may not depend on it.
A conclusion the paper draws from its own results — it cites no other source for it, so there is none to check. The quote shows it is in the paper.
In the paper
“The therapeutic strategy will differ conclusively based on the specific effector properties of each cell type and the stage of disease.”
§ Differential roles of microglia and monocytes in the inflamed central nervous system > DISCUSSION
boosteddirect- Asserted: passes — The authors put it forward as true.
- Checkable: fails — It may be too vague to check against evidence.
- Load-bearing: passes — The paper’s conclusions depend on it.
- Based: passes — The paper gives a reason why it holds.
Probably not a substantial claim. It may be too vague to check against evidence.
What the paper did — it cites no source for this, so there is none to check. The quote shows it is in the paper.
In the paper
“Kappa test showed good pairwise agreement rates among observers (>0.8) and the data from the neuroscientist are used.”
§ Differential roles of microglia and monocytes in the inflamed central nervous system > MATERIALS AND METHODS
plainn = 3- Asserted: passes — The authors put it forward as true.
- Checkable: passes — It can be checked against evidence.
- Load-bearing: fails — The paper’s conclusions may not depend on it.
- Based: passes — The paper gives a reason why it holds.
Probably not a substantial claim. The paper’s conclusions may not depend on it. It may state two separate claims as one.
What the paper did — it cites no source for this, so there is none to check. The quote shows it is in the paper.
In the paper
“Animal experiments were performed according to the protocols approved by the Institutional Animal Care and Use Committee at the Cleveland Clinic following the National Institutes of Health guidelines for animal care.”
§ Differential roles of microglia and monocytes in the inflamed central nervous system > MATERIALS AND METHODS
plain- Asserted: passes — The authors put it forward as true.
- Checkable: passes — It can be checked against evidence.
- Load-bearing: fails — The paper’s conclusions may not depend on it.
- Based: passes — The paper gives a reason why it holds.
Probably not a substantial claim. The paper’s conclusions may not depend on it. It may state two separate claims as one.
What the paper did — it cites no source for this, so there is none to check. The quote shows it is in the paper.
In the paper
“it was beyond the scope of our study to decipher the phenotypic fate of infiltrated monocytes.”
§ Differential roles of microglia and monocytes in the inflamed central nervous system > DISCUSSION
plain- Asserted: passes — The authors put it forward as true.
- Checkable: passes — It can be checked against evidence.
- Load-bearing: passes — The paper’s conclusions depend on it.
- Based: passes — The paper gives a reason why it holds.
Probably not a substantial claim.
What the paper did — it cites no source for this, so there is none to check. The quote shows it is in the paper.
In the paper
“to address how monocytes and microglia respond to a shared microenvironment, we focused on a single, pathogenically relevant time point: onset of EAE.”
§ Differential roles of microglia and monocytes in the inflamed central nervous system > DISCUSSION
plain- Asserted: passes — The authors put it forward as true.
- Checkable: passes — It can be checked against evidence.
- Load-bearing: passes — The paper’s conclusions depend on it.
- Based: passes — The paper gives a reason why it holds.
Probably not a substantial claim.
What the paper did — it cites no source for this, so there is none to check. The quote shows it is in the paper.
In the paper
“In all, we performed 12 EAE immunizations in Ccr2rfp/+::Cx3cr1gfp/+ mice and 19 immunizations in Ccr2rfp/rfp::Cx3cr1gfp/+ mice for this project, with 8–10 mice in each immunization.”
§ Differential roles of microglia and monocytes in the inflamed central nervous system > MATERIALS AND METHODS
plain- Asserted: passes — The authors put it forward as true.
- Checkable: passes — It can be checked against evidence.
- Load-bearing: fails — The paper’s conclusions may not depend on it.
- Based: passes — The paper gives a reason why it holds.
Probably not a substantial claim. The paper’s conclusions may not depend on it. It may state two separate claims as one.
The paper relies on this without support.
Monocytes continuously differentiate throughout postnatal life from bone marrow hematopoietic stem cells, which require the transcription factor Myb.
“whereas monocytes continuously differentiate throughout postnatal life from bone marrow hematopoietic stem cells (HSCs), which require the transcription factor Myb.”
The paper relies on this without support.
Macrophages derived from microglia and monocytes are indistinguishable at the light microscopic level both morphologically and by surface markers.
“In tissue sections, macrophages derived from these two distinct precursors are indistinguishable at the light microscopic level both morphologically and by surface markers.”
The paper relies on this without support.
There is virtually no background trafficking of monocytes in the CNS parenchyma of healthy animals.
“as there is virtually no background trafficking of monocytes in the CNS parenchyma of healthy animals.”
The authors state this as an assumption.
The cellular mechanisms by which macrophages promote disease progression are uncertain.
“However the cellular mechanisms by which macrophages promote disease progression are uncertain.”
The paper relies on this without support.
Microglia represent one instance of tissue-resident macrophages, which reside in all organs.
“Microglia represent one instance of tissue-resident macrophages, which reside in all organs.”
The authors state this as an assumption.
Exposure of monocytes and microglia to the same intensely inflammatory environment increases the likelihood that they adopt a convergent inflammatory phenotype.
“to increase the likelihood that ambient conditions could activate these two myeloid cell types toward a convergent inflammatory phenotype”
The paper relies on this without support.
The EAE disease model exposes both recruited monocytes and resident microglia to the same intensely inflammatory environment.
“Selection of the EAE disease model ensured that both recruited monocytes and resident microglia were exposed to the same intensely inflammatory environment”
Claims other papers make about this one
Each is checked against this paper’s own text: does it say what the citing paper says it does?
The source backs part of the claim, not all of it — or backs it for a different population, condition or comparison.
In the citing paper
“Using this method, resident microglia appeared to be more involved in phagocytosing myelin debris and tissue repair, whereas MDMs in the immediate vicinity of axons at the nodes of Ranvier expressed a pro-inflammatory gene signature [355], suggesting that these cells actively participate in inflammatory myelin damage.”
From Microglia and monocytes in inflammatory CNS disease: integrating phenotype and function (2022) · cites this paper as [355]
Experimental — accuracy not yet measuredThe source backs part of the claim, not all of it — or backs it for a different population, condition or comparison.
In the citing paper
“In one EAE study, macrophages were associated with demyelination, while microglia were anti-inflammatory and required for debris removal (53).”
From Microglia depletion exacerbates demyelination and impairs remyelination in a neurotropic coronavirus infection (2020) · cites this paper as [53]
Experimental — accuracy not yet measuredThe cited source says what the claim attributes to it.
In the citing paper
“These results are consistent with others describing distinct functions for microglia and hematogenously derived macrophages in CNS pathologies (53–55).”
From Microglia depletion exacerbates demyelination and impairs remyelination in a neurotropic coronavirus infection (2020) · cites this paper as [53]
The cited source says what the claim attributes to it.
In the citing paper
“Given the distinct genetic and transcriptomic profile of microglia and macrophages identified via high throughput sequencing technology (69–71), the two cell types likely maintain different roles in the injured central nervous system (CNS) (72–74).”
From The Inflammatory Continuum of Traumatic Brain Injury and Alzheimer’s Disease (2018) · cites this paper as [72]
In the citing paper
“However, at disease onset, microglia promote axonal regeneration, remyelination, clearance of inhibitory myelin debris, and the release of neurotrophic factors, suggesting a beneficial role67.”
From Microglia in neurodegeneration (2018) · cites this paper as [67]
Self-check
Percentages, sums and reported differences re-computed from the paper’s own numbers.
Each contradiction between two passages listed here was confirmed by an independent check.
Rated major: it would touch a result — a value a result rests on, reported and recomputed p-values on opposite sides of the significance level, two passages that conflict with no sign which is right, or a cited work retracted before this paper was published.
In the paper
§ Differential roles of microglia and monocytes in the inflamed central nervous system > MATERIALS AND METHODS
“RNA was isolated from FACS-sorted cells mixed from three mice from six EAE inductions per data point in TRIzol Reagent (Ambion) according to manufacturer’s protocol.”
§ Differential roles of microglia and monocytes in the inflamed central nervous system > RESULTS > Expression profiling demonstrates differential MiDMs and MDMs gene expression across the time course of an EAE attack
“Each row of the heat map represents an individual gene and each column an individual group from pool of 5 mice at each time point.”
Rated minor: it would not touch a result — a value no result rests on, a p-value that stays on the same side of the significance level, or a conflict that is clerical, resolved elsewhere in the paper, or outside its own findings.
In the paper
§ Differential roles of microglia and monocytes in the inflamed central nervous system > RESULTS > Nodal pathology without demyelination at EAE onset in Ccr2rfp/rfp::Cx3cr1gfp/+ mice
“quantification of demyelinated area of Ccr2rfp/+::Cx3cr1gfp/+ mice and Ccr2rfp/+::Cx3cr1gfp/+ mice.”
§ Differential roles of microglia and monocytes in the inflamed central nervous system > RESULTS > Nodal pathology without demyelination at EAE onset in Ccr2rfp/rfp::Cx3cr1gfp/+ mice
“We studied 5 naive Ccr2rfp/+::Cx3cr1gfp/+ mice, 5 naive Ccr2rfp/rfp::Cx3cr1gfp/+ mice, 5 onset Ccr2rfp/+::Cx3cr1gfp/+ mice, and 5 onset Ccr2rfp/rfp::Cx3cr1gfp/+ mice”
Rated minor: it would not touch a result — a value no result rests on, a p-value that stays on the same side of the significance level, or a conflict that is clerical, resolved elsewhere in the paper, or outside its own findings.
In the paper
§ Differential roles of microglia and monocytes in the inflamed central nervous system > RESULTS > Expression patterns at EAE onset in relation to MiDM and MDM function
“MDMs showed up-regulation of functions associated to macrophages, including phagocytosis, calcium signaling, production of prostanoids, adhesion, autophagy, and cell clearance (Fig. 7 B).”
§ Differential roles of microglia and monocytes in the inflamed central nervous system > RESULTS > Expression patterns at EAE onset in relation to MiDM and MDM function
“(A) MDMs up-regulated functions, sorted by activation z-score. (B) MiDMs up-regulated (left) and down-regulated (right) functions, sorted by activation z score.”
Citations
Cites
Fate Mapping Analysis Reveals That Adult Microglia Derive from Primitive Macrophages
Ginhoux, F., Greter, M., Leboeuf, M., Nandi, S., See, P., Gokhan, S., Mehler, M. F., Conway, S. J., Ng, L. G., Stanley, E. R., et al. (2010) · Science · doi:10.1126/science.1194637 · Cited by 5,175
Macrophage biology in development, homeostasis and disease
Wynn, T. A., Chawla, A., & Pollard, J. W. (2013) · Nature · doi:10.1038/nature12034 · Cited by 4,684
Axonal transection in the lesions of multiple sclerosis
Trapp, B. D., Peterson, J., Ransohoff, R. M., Rudick, R., Mörk, S., & Bö, L. (1998) · New England Journal of Medicine · doi:10.1056/nejm199801293380502 · Cited by 4,029
Self-citationJung, S., Aliberti, J., Graemmel, P., Sunshine, M. J., Kreutzberg, G. W., Sher, A., & Littman, D. R. (2000) · Molecular and Cellular Biology · doi:10.1128/mcb.20.11.4106-4114.2000 · Cited by 2,632
A Lineage of Myeloid Cells Independent of Myb and Hematopoietic Stem Cells
Schulz, C., Perdiguero, E. G., Chorro, L., Szabo-Rogers, H., Cagnard, N., Kierdorf, K., Prinz, M., Wu, B., Jacobsen, S. E. W., Pollard, J. W., et al. (2012) · Science · doi:10.1126/science.1219179 · Cited by 2,578
Identification of a unique TGF-β–dependent molecular and functional signature in microglia
Butovsky, O., Jedrychowski, M. P., Moore, C. S., Cialic, R., Lanser, A. J., Gabriely, G., Koeglsperger, T., Dake, B., Wu, P. M., Doykan, C. E., et al. (2014) · Nature Neuroscience · doi:10.1038/nn.3599 · Cited by 2,543
Self-citationthe Immunological Genome Consortium, Gautier, E. L., Shay, T., Miller, J., Greter, M., Jakubzick, C., Ivanov, S., Helft, J., Chow, A., Elpek, K. G., et al. (2012) · Nature Immunology · doi:10.1038/ni.2419 · Cited by 1,972 · cited 1×
“…analysis (Kulkarni, 2011) was performed using directly ex vivo naive microglia and splenic F4/80 + macrophages (here termed monocytes and considered similar to microglia by expression profiling; Gautier et al., 2012), as well as flow-sorted MiDMs or MDMs across the time course of an EAE attack.”
MethodSerial Block-Face Scanning Electron Microscopy to Reconstruct Three-Dimensional Tissue Nanostructure
Denk, W., & Horstmann, H. (2004) · PLoS Biology · doi:10.1371/journal.pbio.0020329 · Cited by 1,644
Local self-renewal can sustain CNS microglia maintenance and function throughout adult life
Ajami, B., Bennett, J. L., Krieger, C., Tetzlaff, W., & Rossi, F. M. V. (2007) · Nature Neuroscience · doi:10.1038/nn2014 · Cited by 1,643
Axonal damage in acute multiple sclerosis lesions
Ferguson, B. (1997) · Brain · doi:10.1093/brain/120.3.393 · Cited by 1,532
Cited by
Sorted by citations
Items 301–400 of 832
Blon, D. L., Guglielmetti, C., Hoornaert, C., Quarta, A., Daans, J., Dooley, D., Lemmens, E., Praet, J., Vocht, N. D., Reekmans, K., et al. (2016) · Journal of Neuroinflammation · doi:10.1186/s12974-016-0756-7 · Cited by 56
Comparative Review of Microglia and Monocytes in CNS Phagocytosis
Andoh, M., & Koyama, R. (2021) · Cells · doi:10.3390/cells10102555 · Cited by 55
Myeloid derived suppressor cells in inflammatory conditions of the central nervous system
Melero‐Jerez, C., Ortega, M. C., Moliné-Velázquez, V., & Clemente, D. (2015) · Biochimica et Biophysica Acta (BBA) - Molecular Basis of Disease · doi:10.1016/j.bbadis.2015.10.015 · Cited by 50
Fischer, H. J., Finck, T. L. K., Pellkofer, H., Reichardt, H. M., & Lühder, F. (2019) · Frontiers in Immunology · doi:10.3389/fimmu.2019.01200 · Cited by 51
Bone marrow-derived cells in the population of spinal microglia after peripheral nerve injury
Tashima, R., Mikuriya, S., Tomiyama, D., Shiratori‐Hayashi, M., Yamashita, T., Kohro, Y., Tozaki‐Saitoh, H., Inoue, K., & Tsuda, M. (2016) · Scientific Reports · doi:10.1038/srep23701 · Cited by 50
Neutrophil perversion in demyelinating autoimmune diseases: Mechanisms to medicine
Casserly, C. S., Nantes, J. C., Hawkins, R. W., & Vallières, L. (2017) · Autoimmunity Reviews · doi:10.1016/j.autrev.2017.01.013 · Cited by 52
Peripheral myeloid cells contribute to brain injury in male neonatal mice
Smith, P. L. P., Mottahedin, A., Svedin, P., Mohn, C.-J., Hagberg, H., Ek, C. J., & Mallard, C. E. (2018) · Journal of Neuroinflammation · doi:10.1186/s12974-018-1344-9 · Cited by 51
Microglia exit the CNS in spinal root avulsion
Green, L. A., Nebiolo, J. C., & Smith, C. J. (2019) · PLoS Biology · doi:10.1371/journal.pbio.3000159 · Cited by 52
Neuroimmune interaction in seizures and epilepsy: focusing on monocyte infiltration
Bosco, D. B., Tian, D., & Wu, L. (2020) · FEBS Journal · doi:10.1111/febs.15428 · Cited by 49
Sun, Y., Cheng, L., Zeng, X., Zhang, X., Liu, Y., Wu, Z., & Weng, P. (2020) · International Journal of Biological Macromolecules · doi:10.1016/j.ijbiomac.2020.12.164 · Cited by 51
Bogie, J. F. J., Mailleux, J., Wouters, E., Jorissen, W., Grajchen, E., Vanmol, J., Wouters, K., Hellings, N., van Horssen, J., Vanmierlo, T., et al. (2017) · Scientific Reports · doi:10.1038/srep44794 · Cited by 48
Dynamic Responses of Microglia in Animal Models of Multiple Sclerosis
Plastini, M. J., Desu, H. L., & Brambilla, R. (2020) · Frontiers in Cellular Neuroscience · doi:10.3389/fncel.2020.00269 · Cited by 48
Interferon β-Mediated Protective Functions of Microglia in Central Nervous System Autoimmunity
Scheu, S., Ali, S., Mann‐Nüttel, R., Richter, L., Arolt, V., Dannlowski, U., Kuhlmann, T., Klotz, L., & Alferink, J. (2019) · International Journal of Molecular Sciences · doi:10.3390/ijms20010190 · Cited by 49
Modeling Psychiatric Disorder Biology with Stem Cells
Das, D., Feuer, K. L., Wahbeh, M. H., & Avramopoulos, D. (2020) · Current Psychiatry Reports · doi:10.1007/s11920-020-01148-1 · Cited by 49
Li, Y., Zhou, H., He, X., Jin, L., Zhu, Y., Hu, L., Feng, M.-J., Zhu, J., Wang, L., Zheng, Y., et al. (2024) · Journal of Advanced Research · doi:10.1016/j.jare.2024.08.016 · Cited by 52
Zhao, Y., Xin, Y., He, Z., & Hu, W. (2018) · Neural Plasticity · doi:10.1155/2018/6323901 · Cited by 49
Self-citationDendritic cells in central nervous system autoimmunity
Sie, C., & Korn, T. (2016) · Seminars in Immunopathology · doi:10.1007/s00281-016-0608-7 · Cited by 47
Th1 cells downregulate connexin 43 gap junctions in astrocytes via microglial activation
Watanabe, M., Masaki, K., Yamasaki, R., Kawanokuchi, J., Takeuchi, H., Matsushita, T., Suzumura, A., & Kira, J. (2016) · Scientific Reports · doi:10.1038/srep38387 · Cited by 47
Self-citationItaliani, P., & Boraschi, D. (2017) · Results and problems in cell differentiation · doi:10.1007/978-3-319-54090-0_2 · Cited by 53
Purinergic receptors in multiple sclerosis pathogenesis
Domercq, M., Zabala, A., & Matute, C. (2018) · Brain Research Bulletin · doi:10.1016/j.brainresbull.2018.11.018 · Cited by 46
Evonuk, K. S., Doyle, R. E., Moseley, C. E., Thornell, I. M., Adler, K., Bingaman, A. M., Bevensee, M. O., Weaver, C. T., Min, B., & DeSilva, T. M. (2020) · Science Advances · doi:10.1126/sciadv.aax5936 · Cited by 49
Fujita, Y., Nakanishi, T., Ueno, M., Itohara, S., & Yamashita, T. (2020) · Cell Reports · doi:10.1016/j.celrep.2020.107580 · Cited by 48
Gao, S., Jiang, Y., Chen, Z., Zhao, X.-Q., Gu, J., Wu, H., Liao, Y., Sun, H., Wang, J., & Chen, W. (2022) · Current Neuropharmacology · doi:10.2174/1570159x21666221216162606 · Cited by 51
Self-citationBozoyan, L., Dumas, A., Patenaude, A., & Vallières, L. (2015) · Journal of Neuroinflammation · doi:10.1186/s12974-015-0392-7 · Cited by 46
Drug repurposing for immune modulation in acute ischemic stroke
Amantea, D., & Bagetta, G. (2015) · Current Opinion in Pharmacology · doi:10.1016/j.coph.2015.11.006 · Cited by 46
Microglia: A Unique Versatile Cell in the Central Nervous System
Masuda, T., & Prinz, M. (2016) · ACS Chemical Neuroscience · doi:10.1021/acschemneuro.5b00317 · Cited by 46
The olfactory epithelium as a port of entry in neonatal neurolisteriosis
Pägelow, D., Chhatbar, C., Beineke, A., Liu, X., Nerlich, A. G., van Vorst, K., Rohde, M., Kalinke, U., Förster, R., Halle, S., et al. (2018) · Nature Communications · doi:10.1038/s41467-018-06668-2 · Cited by 48
Azam, S., Haque, M. E., Kim, I., & Choi, D. (2021) · Cells · doi:10.3390/cells10010150 · Cited by 46
Role of the β Common (βc) Family of Cytokines in Health and DiseasePreprint
Hercus, T. R., Kan, W. L., Broughton, S. E., Tvorogov, D., Ramshaw, H. S., Sandow, J. J., Nero, T. L., Dhagat, U., Thompson, E. J., Shing, K. S. C. T., et al. (2017) · Cold Spring Harbor Perspectives in Biology · doi:10.1101/cshperspect.a028514 · Cited by 51
Oral Microbiome and Alzheimer’s Disease
Wan, J., & Fan, H. (2023) · Microorganisms · doi:10.3390/microorganisms11102550 · Cited by 49
CCRL2 regulates M1/M2 polarization during EAE recovery phase
Mazzon, C., Zanotti, L., Wang, L., Prete, A. D., Fontana, E., Salvi, V., Poliani, P. L., & Sozzani, S. (2016) · Journal of Leukocyte Biology · doi:10.1189/jlb.3ma0915-444rr · Cited by 43
Melero‐Jerez, C., Alonso-Gómez, A., Moñivas, E., Lebrón‐Galán, R., Machín-Díaz, I., de Castro, F., & Clemente, D. (2020) · Neurobiology of Disease · doi:10.1016/j.nbd.2020.104869 · Cited by 44
Chronic oligodendrocyte injury in central nervous system pathologies
Molina-González, I., Miron, V. E., & Antel, J. P. (2022) · Communications Biology · doi:10.1038/s42003-022-04248-1 · Cited by 48
Central Nervous System Macrophages in Health and Disease
Hove, H. V., Feo, D. D., Greter, M., & Becher, B. (2025) · Annual Review of Immunology · doi:10.1146/annurev-immunol-082423-041334 · Cited by 53
Elucidation of monocyte/macrophage dynamics and function by intravital imaging
Rua, R., & McGavern, D. B. (2015) · Journal of Leukocyte Biology · doi:10.1189/jlb.4ri0115-006rr · Cited by 46
Verheijden, S., Beckers, L., Casazza, A., Butovsky, O., Mazzone, M., & Baes, M. (2015) · Glia · doi:10.1002/glia.22831 · Cited by 40
Self-citationMyeloid cell‐specific topoisomerase 1 inhibition using DNA origami mitigates neuroinflammation
Zhu, K., Wang, Y., Sarlus, H., Geng, K., Nutma, E., Sun, J., Kung, S., Bay, C., Han, J., Min, J., et al. (2022) · EMBO Reports · doi:10.15252/embr.202154499 · Cited by 43
Three-dimensional volume imaging with electron microscopy toward connectome
Ohno, N., Katoh, M., Saitoh, Y., Saitoh, S., & Ohno, S. (2014) · Microscopy · doi:10.1093/jmicro/dfu112 · Cited by 43
Self-citationMonaghan, K. L., Zheng, W., Hu, G., & Wan, E. C. K. (2019) · Frontiers in Immunology · doi:10.3389/fimmu.2019.02779 · Cited by 44
The pro‐inflammatory microRNA miR‐155 influences fibrillar β‐Amyloid1‐42 catabolism by microglia
Aloi, M. S., Prater, K. E., Sopher, B., Davidson, S., Jayadev, S., & Garden, G. A. (2021) · Glia · doi:10.1002/glia.23988 · Cited by 43
Foster, V. S., Rash, L. D., King, G. F., & Rank, M. M. (2021) · Frontiers in Cellular Neuroscience · doi:10.3389/fncel.2021.738043 · Cited by 44
A new perspective on depression and neuroinflammation: Non-coding RNA
Zhou, S., Chen, R., She, Y., Liu, X., Zhao, H., Li, C., & Jia, Y. (2022) · Journal of Psychiatric Research · doi:10.1016/j.jpsychires.2022.02.007 · Cited by 42
The therapeutic potential of bone marrow‐derived macrophages in neurological diseases
Zhou, K., Han, J., Wang, Y., Xu, Y., Zhang, Y., & Zhu, C. (2022) · CNS Neuroscience & Therapeutics · doi:10.1111/cns.13964 · Cited by 44
Reducing neuroinflammation by delivery of IL‐10 encoding lentivirus from multiple‐channel bridges
Margul, D. J., Park, J., Boehler, R. M., Smith, D. R., Johnson, M. A., McCreedy, D. A., He, T., Ataliwala, A., Kukushliev, T. V., Liang, J., et al. (2016) · Bioengineering & Translational Medicine · doi:10.1002/btm2.10018 · Cited by 42
de Jong, C. G. H. M., Gabius, H., & Baron, W. (2019) · Cellular and Molecular Life Sciences · doi:10.1007/s00018-019-03327-7 · Cited by 44
Autophagy drives plasticity and functional polarization of tumor‐associated macrophages
Kuo, W., Chang, J., Chen, C., Tsao, N., & Chang, C. (2021) · IUBMB Life · doi:10.1002/iub.2543 · Cited by 47
Xue, S., Lozinski, B. M., Ghorbani, S., Ta, K., D’Mello, C., Yong, V. W., & Dong, Y. (2023) · Journal of Neuroscience · doi:10.1523/jneurosci.2312-22.2023 · Cited by 44
Metabolic Reprograming of Mononuclear Phagocytes in Progressive Multiple Sclerosis
Tannahill, G. M., Iraci, N., Gaude, E., Frezza, C., & Pluchino, S. (2015) · Frontiers in Immunology · doi:10.3389/fimmu.2015.00106 · Cited by 43
Neuroinflammation — using big data to inform clinical practice
Dendrou, C. A., McVean, G., & Fugger, L. H. (2016) · Nature Reviews Neurology · doi:10.1038/nrneurol.2016.171 · Cited by 43
Regenerating CNS myelin: Emerging roles of regulatory T cells and CCN proteins
Gallardo, N. D. L. V., Dittmer, M., Dombrowski, Y., & Fitzgerald, D. C. (2018) · Neurochemistry International · doi:10.1016/j.neuint.2018.11.024 · Cited by 42
Microglia: The Missing Link to Decipher and Therapeutically Control MS Progression?
Geladaris, A., Häusler, D., & Weber, M. S. (2021) · International Journal of Molecular Sciences · doi:10.3390/ijms22073461 · Cited by 44
Divergent Functions of Tissue-Resident and Blood-Derived Macrophages in the Hemorrhagic Brain
Chang, C.-F., Goods, B. A., Askenase, M. H., Beatty, H. E., Osherov, A., DeLong, J. H., Hammond, M. D., Massey, J., Landreneau, M. J., Love, J. C., et al. (2021) · Stroke · doi:10.1161/strokeaha.120.032196 · Cited by 44
Radandish, M., Khalilian, P., & Esmaeil, N. (2021) · Frontiers in Immunology · doi:10.3389/fimmu.2021.667705 · Cited by 41
Autoimmune neuroinflammation triggers mitochondrial oxidation in oligodendrocytes
Steudler, J., Ecott, T., Ivan, D. C., Bouillet, E., Walthert, S., Berve, K., Dick, T. P., Engelhardt, B., & Locatelli, G. (2022) · Glia · doi:10.1002/glia.24235 · Cited by 39
Borràs, C., Mercer, A., Sirisi, S., Alcolea, D., Escolà-Gil, J. C., Blanco-Vaca, F., & Tondo, M. (2022) · International Journal of Molecular Sciences · doi:10.3390/ijms23169356 · Cited by 39
Pioglitazone regulates myelin phagocytosis and multiple sclerosis monocytes
Natrajan, M. S., Komori, M., Kosa, P. F., Johnson, K. R., Wu, T., Franklin, R. J. M., & Bielekova, B. (2015) · Annals of Clinical and Translational Neurology · doi:10.1002/acn3.260 · Cited by 40
Katsumoto, A., de Miranda, A. S., Butovsky, O., Teixeira, A. L., Ransohoff, R. M., & Lamb, B. T. (2018) · Journal of Neuroinflammation · doi:10.1186/s12974-018-1075-y · Cited by 39
Self-citationJiang, Y., Wang, Y., Ma, P., An, D., Zhao, J., Liang, S.-Q., Ye, Y., Lu, Y., Zhang, P., Liu, X., et al. (2018) · Protein & Cell · doi:10.1007/s13238-018-0527-6 · Cited by 41
Axonal and neuronal degeneration in myelin diseases
Ohno, N., & Ikenaka, K. (2018) · Neuroscience Research · doi:10.1016/j.neures.2018.08.013 · Cited by 42
Self-citationInvestigating Microglia in Health and Disease: Challenges and Opportunities
Miron, V. E., & Priller, J. (2020) · Trends in Immunology · doi:10.1016/j.it.2020.07.002 · Cited by 43
The Emerging Role of Microglia in Neuromyelitis Optica
Chen, T., Bosco, D. B., Ying, Y., Tian, D., & Wu, L. (2021) · Frontiers in Immunology · doi:10.3389/fimmu.2021.616301 · Cited by 43
Mishra, M. K., Rawji, K. S., Keough, M. B., Kappen, J., Dowlatabadi, R., Vogel, H. J., Chopra, S., Distéfano‐Gagné, F., Dufour, A., Gosselin, D., et al. (2021) · Journal of Neuroscience · doi:10.1523/jneurosci.1948-20.2021 · Cited by 44
Wang, Y., Sun, J., Zhu, K., Wang, D., Zhao, X., Zhang, H., Wu, S., Wang, J., & Wang, J. (2023) · Journal of Neuroinflammation · doi:10.1186/s12974-023-02764-3 · Cited by 41
Unique primed status of microglia under the systemic autoimmune condition of lupus-prone mice
Nomura, A., Noto, D., Murayama, G., Chiba, A., & Miyake, S. (2019) · Arthritis Research & Therapy · doi:10.1186/s13075-019-2067-8 · Cited by 38
Multifaceted Involvement of Microglia in Gray Matter Pathology in Multiple Sclerosis
Tsouki, F., & Williams, A. (2021) · Stem Cells · doi:10.1002/stem.3374 · Cited by 39
Karin, N. (2021) · Cancers · doi:10.3390/cancers13246317 · Cited by 41
Macrophages in neuroinflammation: role of the renin-angiotensin-system
Hammer, A., Stegbauer, J., & Linker, R. A. (2017) · Pflügers Archiv - European Journal of Physiology · doi:10.1007/s00424-017-1942-x · Cited by 40
Redundancy between Cysteine Cathepsins in Murine Experimental Autoimmune Encephalomyelitis
Allan, E. R. O., & Yates, R. M. (2015) · PLoS ONE · doi:10.1371/journal.pone.0128945 · Cited by 38
Mangalam, A. K., Luo, N., Luckey, D. H., Papke, L. M., Hubbard, A., Wussow, A., Smart, M. K., Giri, S., Rodriguez, M., & David, C. S. (2014) · The Journal of Immunology · doi:10.4049/jimmunol.1302008 · Cited by 39
Denizet, M., Cotter, L., Lledo, P., & Lazarini, F. (2016) · Brain Behavior and Immunity · doi:10.1016/j.bbi.2016.09.015 · Cited by 36
Multiple sclerosis: Immunopathological heterogeneity and its implications
Engelhardt, B., Comabella, M., & Chan, A. (2022) · European Journal of Immunology · doi:10.1002/eji.202149757 · Cited by 42
Severa, M., Rizzo, F., Giacomini, E., Salvetti, M., & Coccia, E. M. (2014) · Cytokine & Growth Factor Reviews · doi:10.1016/j.cytogfr.2014.11.005 · Cited by 38
Kajiwara, Y., McKenzie, A. T., Dorr, N. P., Sosa, M. A. G., Elder, G. A., Schmeidler, J., Dickstein, D. L., Bozdagi, O., Zhang, B., & Buxbaum, J. D. (2016) · Human Molecular Genetics · doi:10.1093/hmg/ddw265 · Cited by 39
Wang, X., Wang, J., Yu, Y., Ma, T., Chen, P., Zhou, B., & Tao, R. N. (2017) · Oncotarget · doi:10.18632/oncotarget.18063 · Cited by 37
Li, G., Yamasaki, R., Fang, M., Masaki, K., Ochi, H., Matsushita, T., & Kira, J. (2018) · Scientific Reports · doi:10.1038/s41598-018-20390-5 · Cited by 40
Self-citationChen, Y., Zhang, Z.-X., Zheng, L., Wang, L., Liu, Y.-F., Yin, W.-Y., Chen, Y., Wang, X., Hou, S., Chen, J., et al. (2019) · Neurochemistry International · doi:10.1016/j.neuint.2019.104490 · Cited by 37
Emerging Roles for G-protein Coupled Receptors in Development and Activation of Macrophages
Wang, X., Iyer, A., Lyons, A. B., Körner, H., & Wei, W. (2019) · Frontiers in Immunology · doi:10.3389/fimmu.2019.02031 · Cited by 39
Infiltration of Blood-Derived Macrophages Contributes to the Development of Diabetic Neuropathy
Sun, J., Tang, L., Zhao, X.-P., Xu, J., Xiao, Y., & Li, H. (2019) · Journal of Immunology Research · doi:10.1155/2019/7597382 · Cited by 38
Adams, R. C., Carter‐Cusack, D., Shaikh, S., Llanes, G. T., Johnston, R. L., Quaife-Ryan, G. A., Boyle, G. M., Koufariotis, L. T., Möller, A., Blazar, B. R., et al. (2021) · Blood · doi:10.1182/blood.2021011671 · Cited by 38
Mifflin, K. A., Frieser, E. C., Benson, C. A., Baker, G. B., & Kerr, B. J. (2017) · Journal of Neuroimmunology · doi:10.1016/j.jneuroim.2017.02.005 · Cited by 37
Zhou, H., Li, J., Hu, L., Yu, J., Fu, X., Liang, F., Yan, F., & Chen, G. (2022) · Journal of Advanced Research · doi:10.1016/j.jare.2022.03.011 · Cited by 36
Ongoing Oxidative Stress Causes Subclinical Neuronal Dysfunction in the Recovery Phase of EAE
Radbruch, H., Bremer, D., Guenther, R., Cseresnyés, Z., Lindquist, R. L., Hauser, A. E., & Niesner, R. A. (2016) · Frontiers in Immunology · doi:10.3389/fimmu.2016.00092 · Cited by 36
Central Nervous System: (Immunological) Ivory Tower or Not?
Marin, I. A., & Kipnis, J. (2016) · Neuropsychopharmacology · doi:10.1038/npp.2016.122 · Cited by 36
Terrazas, C. A., Ruiz‐Rosado, J. D. D., Amici, S. A., Jablonski, K., Martínez‐Saucedo, D., Webb, L., Cortado, H. H., Robledo-Avila, F. H., Oghumu, S., Satoskar, A. R., et al. (2017) · Scientific Reports · doi:10.1038/srep40814 · Cited by 37
Microglia in Alzheimer's Disease: A Role for Ion Channels
Thei, L., Imm, J. L., Kaisis, E., Dallas, M. L., & Kerrigan, T. L. (2018) · Frontiers in Neuroscience · doi:10.3389/fnins.2018.00676 · Cited by 37
Hatton, C. F., & Duncan, C. J. A. (2019) · Frontiers in Immunology · doi:10.3389/fimmu.2019.02656 · Cited by 37
Endogenous neural stem cells modulate microglia and protect against demyelination
Brousse, B., Mercier, O., Magalon, K., Daian, F., Durbec, P., & Cayre, M. (2021) · Stem Cell Reports · doi:10.1016/j.stemcr.2021.05.002 · Cited by 38
The dual function of microglial polarization and its treatment targets in ischemic stroke
Mo, Y., Xu, W., Fu, K., Chen, H., Wen, J., Huang, Q., Guo, F., Mo, L., & Yan, J. (2022) · Frontiers in Neurology · doi:10.3389/fneur.2022.921705 · Cited by 39
Specialized functions of resident macrophages in brain and heart
Nicolás-Ávila, J. Á., Hidalgo, A., & Ballesteros, I. (2018) · Journal of Leukocyte Biology · doi:10.1002/jlb.6mr0118-041r · Cited by 36
Микроглия в гомеостазе центральной нервной системы и нейровоспалении
Gogoleva, V. S., Друцкая, М. С., & Атретханы, К.-С. Н. (2019) · Molecular Biology · doi:10.1134/s0026898419050057 · Cited by 36
Gao, W., Wang, Y., Zheng, Y., et al. (2024) · Accounts of Materials Research · doi:10.1021/accountsmr.3c00260 · Cited by 34
Zhao, X., Zhao, Z., Yang, D., Cao, L., Zhang, L., Ji, J., Gu, J., Huang, J.-Y., & Sun, X. (2017) · Brain Research Bulletin · doi:10.1016/j.brainresbull.2017.01.026 · Cited by 34
Self-citationRajasundaram, S. (2018) · Frontiers in Immunology · doi:10.3389/fimmu.2018.00402 · Cited by 37
Defining murine monocyte differentiation into colonic and ileal macrophages
Gross-Vered, M., Trzebanski, S., Shemer, A., Bernshtein, B., Curato, C., Stelzer, G., Salame, T., David, E., Boura‐Halfon, S., Chappell‐Maor, L., et al. (2020) · eLife · doi:10.7554/elife.49998 · Cited by 32
Qu, Z., Zheng, N., Wei, Y., Chen, Y., Zhang, Y., Zhang, M., Chang, H., Liu, J., Hou-xi, A., Geng, X., et al. (2019) · Journal of Neuroimmunology · doi:10.1016/j.jneuroim.2019.01.014 · Cited by 33
Yang, F., Feng, W., Wang, H., Wang, L., Liu, X., Wang, R., Chen, C., Yang, X. Q., Zhang, D., Ren, Q., et al. (2020) · Cancer Research · doi:10.1158/0008-5472.can-20-0034 · Cited by 34
Molecular Mechanisms in the Genesis of Seizures and Epilepsy Associated With Viral Infection
Löscher, W., & Howe, C. L. (2022) · Frontiers in Molecular Neuroscience · doi:10.3389/fnmol.2022.870868 · Cited by 35
Frey, L., Bandaru, P., Zhang, Y. S., O'Kelly, K., Khademhosseini, A., & Shin, S. R. (2017) · Advanced Functional Materials · doi:10.1002/adfm.201702009 · Cited by 33
Kim, J.-S., Trzebanski, S., Shin, S.-H., Schori, L., Frumer Friedman, G. R., Ilani, N. C., Kadam, A., Vicario, R., Aust, O., Bugaeva, P., et al. (2025) · Cell Reports · doi:10.1016/j.celrep.2025.115609 · Cited by 33
Double Roles of Macrophages in Human Neuroimmune Diseases and Their Animal Models
Fan, X., Zhang, H., Cheng, Y., Jiang, X., Zhu, J., & Jin, T. (2016) · Mediators of Inflammation · doi:10.1155/2016/8489251 · Cited by 34
Metadata
- Authors
- Yamasaki, R., Lu, H., Butovsky, O., Ohno, N., Rietsch, A. M., Cialic, R., Wu, P. M., Doykan, C. E., Lin, J., Cotleur, A. C., Kidd, G., Zorlu, M. M., Sun, N., Hu, W., Liu, L., Lee, J.-C., Taylor, S. E., Uehlein, L., Dixon, D., Gu, J., Floruta, C. M., Zhu, M., Charo, I. F., Weiner, H. L., & Ransohoff, R. M.
- Affiliations
- Cleveland Clinic (US)
- Brigham and Women's Hospital (US)
- Vanderbilt University (US)
- Case Western Reserve University (US)
- University of California, San Francisco (US)
- Corresponding author
- Ransohoff, Richard M.
- ORCID
- Venue
- Journal of Experimental Medicine
- Publisher
- Rockefeller University Press
- Published
- 2014-07-07
- Volume
- 211
- Issue
- 8
- Pages
- 1533-1549
- ISSN
- 0022-1007 (ISSN-L)
- 1540-9538
- PMC
- PMC4113947
- OpenAlex
- W2159443316
- Cited by
- 856
- References
- 51
- Citations by year
- 2026: 26 · 2025: 49 · 2024: 54 · 2023: 42 · 2022: 58 · 2021: 103 · 2020: 78 · 2019: 76 · 2018: 87 · 2017: 92 · 2016: 96 · 2015: 77 · 2014: 15
- FWCI
- 59.13
- Type
- journal article
- Language
- en
- Open access
- bronze
- doi.org
- Locations
- The Journal of Experimental Medicine (publishedVersion)
- Europe PMC (PubMed Central) (publishedVersion, cc-by-nc-sa)
- PubMed Central (publishedVersion, cc-by-nc-sa)
- PubMed (publishedVersion)
- Digital Access to Scholarship at Harvard (DASH) (Harvard University) (submittedVersion, cc-by)
- eScholarship (California Digital Library) (submittedVersion)
- Hacettepe University Institutional Repository (hacettepe.edu.tr) (submittedVersion, other-oa)
- Funders
- Japan Society for the Promotion of Science (26860129)
- National Institute of General Medical Sciences (T32GM007250)
- National Institute of Neurological Disorders and Stroke (R01NS088137)
- Topics
- Health Sciences › Medicine › Clinical Neurology › Multiple Sclerosis Research Studies
- Life Sciences › Neuroscience › Neurology › Neuroinflammation and Neurodegeneration Mechanisms
- Life Sciences › Immunology and Microbiology › Immunology › T-cell and B-cell Immunology
- Keywords
- microglia, monocytes, macrophages, multiple sclerosis, experimental autoimmune encephalomyelitis, demyelination, monocyte-derived macrophages, nodes of Ranvier, phagocytosis, cellular metabolism, tissue damage, neuroinflammation, serial block-face scanning electron microscopy
- MeSH terms
- CX3C Chemokine Receptor 1, Animals, Central Nervous System, Encephalomyelitis, Autoimmune, Experimental, Gene Expression Regulation, Homeostasis, Humans, Inflammation, Kinetics, Macrophages, Mice, Inbred C57BL, Monocytes, Ranvier's Nodes, Time Factors, Signal Transduction, Microglia, Receptors, Chemokine, Gene Expression Profiling, Cell Shape, Mice, Gene Regulatory Networks, Receptors, CCR2
About these checks
Registry, retraction, Cites and statistics results are computed, not judged, with one exception: a printed reference that no index lists is read once by a model before it counts as a citation error. Claims are extracted by a model and kept only when their quote appears verbatim in the text; each cited source is then checked, with a model’s help, for whether it says what the claim relies on. Those verdicts can be wrong — read the claim’s quote and the cited source before relying on one.
A language model drew the claims from the paper on 2026-10-16, under version 3 of the claim definition (model deepseek-v4.1-flash, prompt extract-v3).
A second model labelled each claim on 2026-10-16 (model jev-1.13-20260917, definition revision gold-guideline-v0.2).
Cited sources are checked with a language model’s help (gpt-6-sol).
Statistics and arithmetic are recomputed, not judged.
Confidence bands are shown only for fields calibrated on our annotated test set. None is calibrated yet, so no band is shown.
What counts as a claim ›How we measure confidence ›How we check this ›
Are you an author, or do you see a problem with this page? Request a review
