Cited by 134Prion Diseases and Protein MisfoldingNeuroinflammation and Neurodegeneration MechanismsAlzheimer's disease research and treatments

The DOI matches its Crossref record; 44 of the 44 references it cites were found in a registry or an index.

A neuroprotective role for microglia in prion diseases

Open access

Abstract

Microglial activation is a hallmark of most neurodegenerative disorders, and is particularly conspicuous in prion diseases. However, the role of microglia, which function as both primary immune effector cells and professional phagocytes in the central nervous system, remains contentious in the context of neurodegeneration. Here, we evaluated the effect of microglial depletion/deficiency on prion pathogenesis. We found that ganciclovir-mediated microglial ablation on tga20/CD11b-thymidine kinase of Herpes simplex virus (HSVTK) cerebellar organotypic cultured slices markedly aggravated prion-induced neurotoxicity. A similar deterioration of disease was recapitulated in in vivo microglial depletion in prion-infected tga20/CD11b-HSVTK mice. Additionally, deficiency of microglia in interleukin 34 knockout (IL34−/−) mice again resulted in significantly augmented proteinase K–resistant prion protein deposition and accelerated prion disease progression. These results provide unambiguous evidence for a general protective role of microglia in prion pathogenesis.

Overview

The claims and statistics of this paper haven’t been checked yet.

Run the check — free, no account needed. It reads the open-access text and checks the sources it cites.

A few free checks a day · papers already verified open instantly · results are public

Integrity signals

Registry

Crossref · 10.1084/jem.20151000

Cites

44 of 44 references verified0 citation errors · 0 not checkable

Statistics

Figures

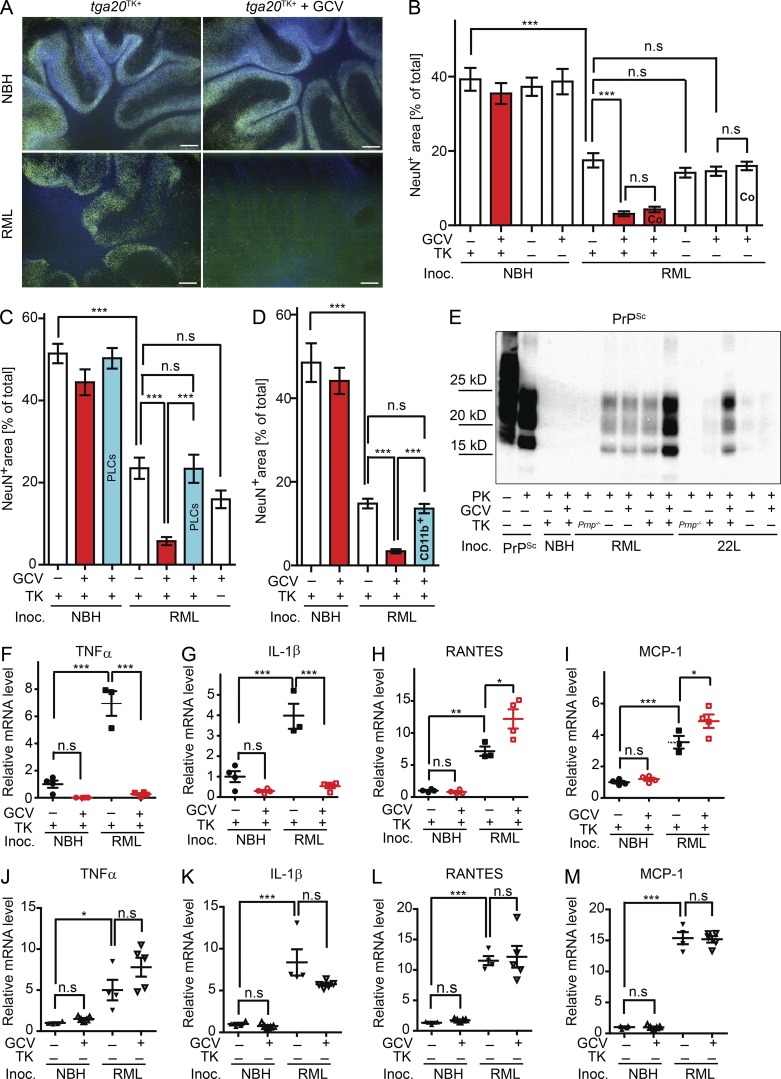
Figure 1. Microglia ablation on CD11b-HSVTK COCS enhanced prion-induced neurotoxicity. (A and B) Tga20TK+ or tga20TK− slices were treated with NBH or RML6 and cultured in the optional presence of GCV for 49 dpi. Representative COCS stained for NeuN (green) and DAPI (blue; A) and analyzed by NeuN morphometry (B). Bars, 200 µm. n = 10–11. ***, P < 0.001; n.s, P > 0.05. Bars labeled Co denote co-culture of slices divided by a grease barrier. Red bars indicate microglia depletion. (C) NeuN morphometry of RML6 infected tga20TK+ COCS optionally treated with GCV and reconstituted with PLCs prepared from tga20 mice (∼70,000 cells per COCS). Red: microglia-depleted, Blue: microglia-depleted and PLC reconstituted. n = 10; ***, P < 0.001; n.s, P > 0.05. (D) NeuN morphometry of RML6 infected tga20TK+ COCS optionally treated with GCV and reconstituted with 70 × 103 CD19−CD11b+ cells per slice. Red: microglia-depleted, Blue: microglia-depleted and CD19−CD11b+ cells reconstituted. n = 10. ***, P < 0.001. (E) PrPSc Western blot of cultures prepared from Prnp−/−, tga20TK+, or tga20TK− mice exposed to NBH, RML6, or 22L and cultured until 35 dpi in the optional presence of GCV. Samples were digested with PK as indicated and detected with POM1. (F–I) qRT-PCR of cytokines and chemokines in tga20TK+ slices treated with NBH or RML6 at 42 dpi ± GCV. (J–M) qRT-PCR of cytokines and chemokines in tga20TK− slices treated with NBH or RML6 at 42 dpi ± GCV. (F and J) TNF mRNA, (G and K) IL-1β mRNA, (H and L) RANTES mRNA, and (I and M) MCP-1 mRNA. n = 3–5. *, P < 0.05; **, P < 0.01; ***, P < 0.001; n.s, P > 0.05. Relative expression normalized to GAPDH expression and represented as fold change compared with noninfected, non-GCV samples ± SEM. Statistical significance in B–D and F–M was determined using one-way ANOVA with Tukey’s post-test for multicolumn comparison. Histology, Western blot, and qRT-PCR results represent at least three independent experiments.
Figure 1. Microglia ablation on CD11b-HSVTK COCS enhanced prion-induced neurotoxicity. (A and B) Tga20TK+ or tga20TK− slices were treated with NBH or RML6 and cultured in the optional presence of GCV for 49 dpi. Representative COCS stained for NeuN (green) and DAPI (blue; A) and analyzed by NeuN morphometry (B). Bars, 200 µm. n = 10–11. ***, P < 0.001; n.s, P > 0.05. Bars labeled Co denote co-culture of slices divided by a grease barrier. Red bars indicate microglia depletion. (C) NeuN morphometry of RML6 infected tga20TK+ COCS optionally treated with GCV and reconstituted with PLCs prepared from tga20 mice (∼70,000 cells per COCS). Red: microglia-depleted, Blue: microglia-depleted and PLC reconstituted. n = 10; ***, P < 0.001; n.s, P > 0.05. (D) NeuN morphometry of RML6 infected tga20TK+ COCS optionally treated with GCV and reconstituted with 70 × 103 CD19−CD11b+ cells per slice. Red: microglia-depleted, Blue: microglia-depleted and CD19−CD11b+ cells reconstituted. n = 10. ***, P < 0.001. (E) PrPSc Western blot of cultures prepared from Prnp−/−, tga20TK+, or tga20TK− mice exposed to NBH, RML6, or 22L and cultured until 35 dpi in the optional presence of GCV. Samples were digested with PK as indicated and detected with POM1. (F–I) qRT-PCR of cytokines and chemokines in tga20TK+ slices treated with NBH or RML6 at 42 dpi ± GCV. (J–M) qRT-PCR of cytokines and chemokines in tga20TK− slices treated with NBH or RML6 at 42 dpi ± GCV. (F and J) TNF mRNA, (G and K) IL-1β mRNA, (H and L) RANTES mRNA, and (I and M) MCP-1 mRNA. n = 3–5. *, P < 0.05; **, P < 0.01; ***, P < 0.001; n.s, P > 0.05. Relative expression normalized to GAPDH expression and represented as fold change compared with noninfected, non-GCV samples ± SEM. Statistical significance in B–D and F–M was determined using one-way ANOVA with Tukey’s post-test for multicolumn comparison. Histology, Western blot, and qRT-PCR results represent at least three independent experiments.CC BY-NC-SA · PubMed Central
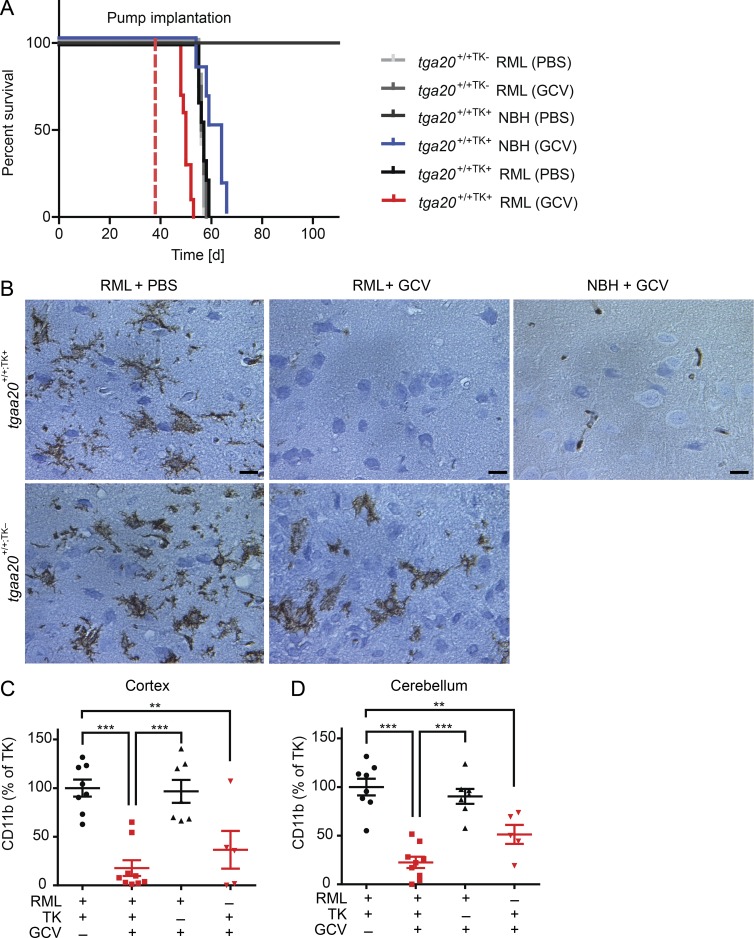
Figure 2. Microglia ablation on in vivo CD11b-HSVTK system deteriorated prion disease. (A) Survival curves of RML6- or NBH-inoculated tga20+/+;TK+ or tga20+/+;TK− mice implanted with GCV or PBS containing intraventricular osmotic minipumps (tga20+/+;TK− RML(PBS), n = 5, median survival = 56 dpi; tga20+/+;TK− RML(GCV), n = 4, median survival = 56.5 dpi; tga20+/+;TK+ NBH(PBS), n = 6, remained asymptomatic up to 138 dpi; tga20+/+;TK+ NBH(GCV), n = 6, median survival = 61.5 dpi; tga20+/+;TK+ RML(PBS), n = 9, median survival = 57 dpi; tga20+/+;TK+ RML(GCV), n = 10, median survival = 50 dpi; ****, P < 0.0001). Dashed line represents time of pump implantation. Microglia-depleted mice showed an accelerated prion progression as compared with all other groups. (B) Iba1 immunohistochemistry of cortical brain tissue from all experimental groups showing dramatic reduction in the microglial colonization of GCV-treated, RML6-infected tga20+/+;TK+ mice. Bars, 10 µm. (C and D) Quantification of microglia depletion in (C) cortical (tga20+/+;TK+ RML(PBS), n = 8; tga20+/+;TK+ RML(GCV), n = 9; tga20+/+;TK− RML(GCV), n = 7; tga20+/+;TK+ NBH(GCV), n = 5; **, P < 0.01; ***, P < 0.001) or (D) cerebellar tissue (tga20+/+;TK+ RML(PBS), n = 8; tga20+/+;TK+ RML(GCV), n = 9; tga20+/+;TK− RML(GCV), n = 8; tga20+/+;TK+ NBH(GCV), n = 5; ***, P < 0.001; **, P < 0.01). Red, microglia depleted. Error bars represent SEM. Statistical significance in A was determined using Log-rank (Mantel-Cox) test. Statistical significance in C and D was determined using one-way ANOVA with Tukey’s post-test for multicolumn comparison. Histology results represent at least five independent experiments.
Figure 2. Microglia ablation on in vivo CD11b-HSVTK system deteriorated prion disease. (A) Survival curves of RML6- or NBH-inoculated tga20+/+;TK+ or tga20+/+;TK− mice implanted with GCV or PBS containing intraventricular osmotic minipumps (tga20+/+;TK− RML(PBS), n = 5, median survival = 56 dpi; tga20+/+;TK− RML(GCV), n = 4, median survival = 56.5 dpi; tga20+/+;TK+ NBH(PBS), n = 6, remained asymptomatic up to 138 dpi; tga20+/+;TK+ NBH(GCV), n = 6, median survival = 61.5 dpi; tga20+/+;TK+ RML(PBS), n = 9, median survival = 57 dpi; tga20+/+;TK+ RML(GCV), n = 10, median survival = 50 dpi; ****, P < 0.0001). Dashed line represents time of pump implantation. Microglia-depleted mice showed an accelerated prion progression as compared with all other groups. (B) Iba1 immunohistochemistry of cortical brain tissue from all experimental groups showing dramatic reduction in the microglial colonization of GCV-treated, RML6-infected tga20+/+;TK+ mice. Bars, 10 µm. (C and D) Quantification of microglia depletion in (C) cortical (tga20+/+;TK+ RML(PBS), n = 8; tga20+/+;TK+ RML(GCV), n = 9; tga20+/+;TK− RML(GCV), n = 7; tga20+/+;TK+ NBH(GCV), n = 5; **, P < 0.01; ***, P < 0.001) or (D) cerebellar tissue (tga20+/+;TK+ RML(PBS), n = 8; tga20+/+;TK+ RML(GCV), n = 9; tga20+/+;TK− RML(GCV), n = 8; tga20+/+;TK+ NBH(GCV), n = 5; ***, P < 0.001; **, P < 0.01). Red, microglia depleted. Error bars represent SEM. Statistical significance in A was determined using Log-rank (Mantel-Cox) test. Statistical significance in C and D was determined using one-way ANOVA with Tukey’s post-test for multicolumn comparison. Histology results represent at least five independent experiments.CC BY-NC-SA · PubMed Central
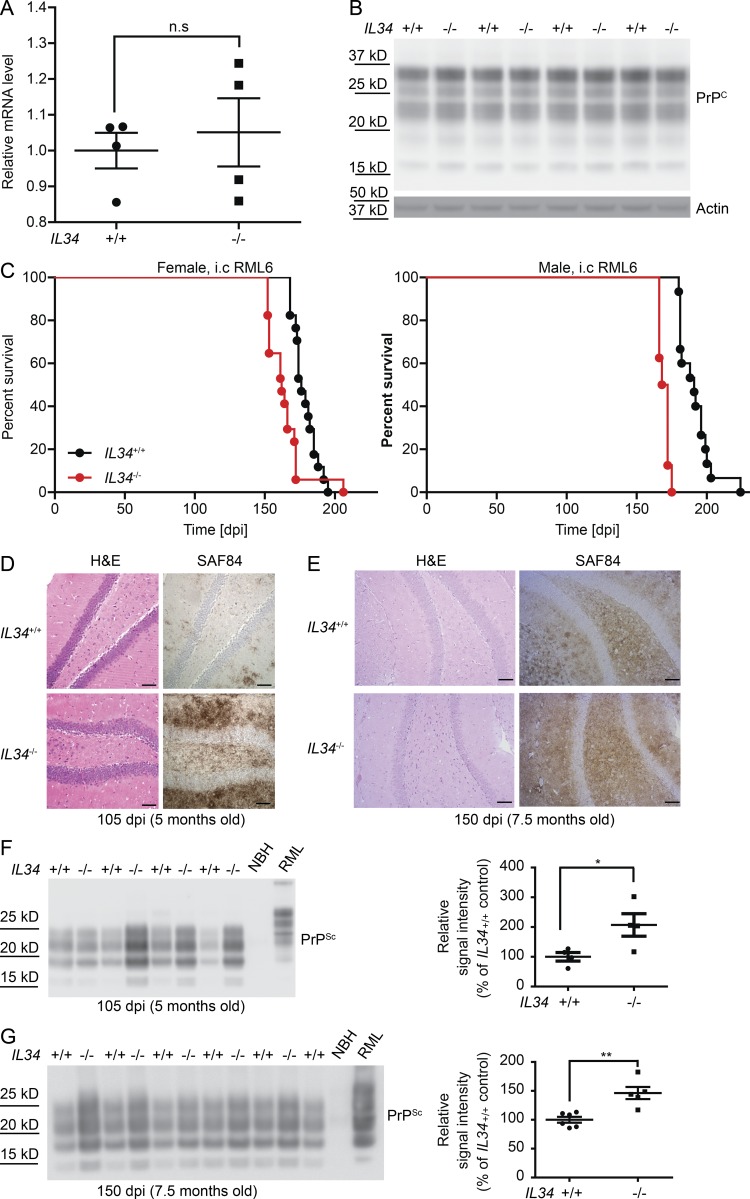
Figure 3. Microglia-deficient IL34−/− mice demonstrated accelerated prion pathogenesis. (A) qRT-PCR for Prnp mRNA in one hemisphere of IL34−/− and IL34+/+ brains. n = 4. n.s, P > 0.05. (B) PrPC Western blot for one hemisphere from IL34−/− and IL34+/+ brains. n = 4. (C) Survival curves of RML6 infected IL34−/− and IL34+/+ (WT) mice. Median survival of IL34−/− females 162 dpi (n = 17) versus IL34+/+ (WT) females 176 dpi (n = 17). **, P < 0.01; median survival of IL34−/− males 170 dpi (n = 8) versus IL34+/+ (WT) males 191 dpi (n = 15). ****, P < 0.0001. (D and E) Hematoxylin and eosin and SAF84 staining on RML6-infected IL34−/− and IL34+/+ (WT) brains at 105 dpi (D) and 150 dpi (E). Bars, 50 µm. (F and G, left) PrPSc Western blot of homogenates prepared from one brain hemisphere of RML6-infected IL34−/− and IL34+/+ (WT) mice at 105 dpi (F) and 150 dpi (G). Samples were digested with PK as indicated and detected with POM1. (right) Densitometric quantification of the PrPSc Western blot. n = 4 (105 dpi) or 5 (150 dpi) for IL34−/−; n = 4 (105 dpi) or 6 (150 dpi) for IL34+/+. **, P < 0.01; *, P < 0.05. Error bars represent SEM. Survival curves summarize two independent i.c inoculation experiments. Statistical significance in A, F, and G was determined using unpaired Student’s t test. Statistical significance in C and D was determined using Log-rank (Mantel-Cox) test. qRT-PCR, histology, and Western blot results represent at least four independent experiments.
Figure 3. Microglia-deficient IL34−/− mice demonstrated accelerated prion pathogenesis. (A) qRT-PCR for Prnp mRNA in one hemisphere of IL34−/− and IL34+/+ brains. n = 4. n.s, P > 0.05. (B) PrPC Western blot for one hemisphere from IL34−/− and IL34+/+ brains. n = 4. (C) Survival curves of RML6 infected IL34−/− and IL34+/+ (WT) mice. Median survival of IL34−/− females 162 dpi (n = 17) versus IL34+/+ (WT) females 176 dpi (n = 17). **, P < 0.01; median survival of IL34−/− males 170 dpi (n = 8) versus IL34+/+ (WT) males 191 dpi (n = 15). ****, P < 0.0001. (D and E) Hematoxylin and eosin and SAF84 staining on RML6-infected IL34−/− and IL34+/+ (WT) brains at 105 dpi (D) and 150 dpi (E). Bars, 50 µm. (F and G, left) PrPSc Western blot of homogenates prepared from one brain hemisphere of RML6-infected IL34−/− and IL34+/+ (WT) mice at 105 dpi (F) and 150 dpi (G). Samples were digested with PK as indicated and detected with POM1. (right) Densitometric quantification of the PrPSc Western blot. n = 4 (105 dpi) or 5 (150 dpi) for IL34−/−; n = 4 (105 dpi) or 6 (150 dpi) for IL34+/+. **, P < 0.01; *, P < 0.05. Error bars represent SEM. Survival curves summarize two independent i.c inoculation experiments. Statistical significance in A, F, and G was determined using unpaired Student’s t test. Statistical significance in C and D was determined using Log-rank (Mantel-Cox) test. qRT-PCR, histology, and Western blot results represent at least four independent experiments.CC BY-NC-SA · PubMed Central
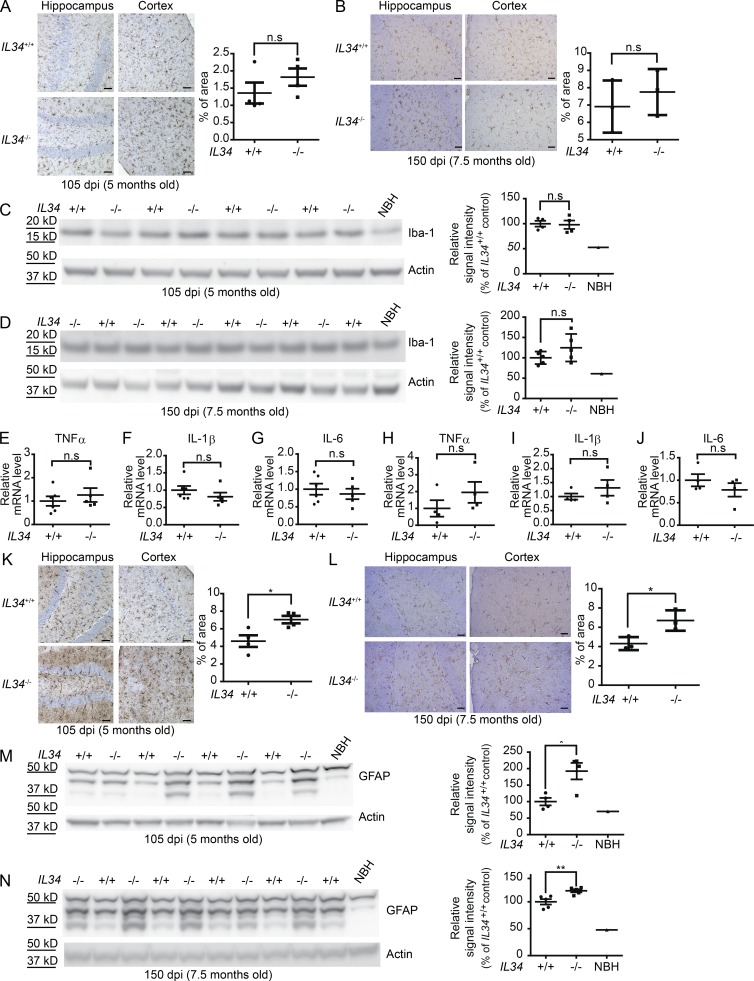
Figure 4. Microglia-deficient IL34−/− mice displayed similar microglial activation, but augmented astrogliosis. (A, left) Iba1 immunohistochemistry of brain tissues from RML6-infected IL34−/− and IL34+/+ (WT) mice at 105 dpi. (right) Quantification of the Iba1 immunostaining. n = 4; n.s, P > 0.05. Bars, 20 µm. (B, left) Iba1 immunohistochemistry of brain tissues from RML6-infected IL34−/− and IL34+/+ (WT) mice at 150 dpi. (right) Quantification of the Iba1 immunostaining. n = 3; n.s, P > 0.05. Bars, 20 µm. (C, left) Iba1 Western blot of one hemisphere from RML6-infected IL34−/− and IL34+/+ (WT) mice at 105 dpi. (right) Densitometric quantification of the Iba1 Western blot. n = 4; n.s, P > 0.05. (D, left) Iba1 Western blot of one hemisphere from RML6-infected IL34−/− and IL34+/+ (WT) mice at 150 dpi. (right) Densitometric quantification of the Iba1 Western blot. n = 5; n.s, P > 0.05. (E–J) qRT-PCR of cytokines from one hemisphere of RML6-infected IL34−/− and IL34+/+ (WT) mice at 105 dpi (E–G) and 150 dpi (H–J). (E and H) TNF mRNA, (F and I) IL-1β mRNA, and (G and J) IL-6 mRNA. Relative expression normalized to GAPDH expression and represented as fold change compared with WT mice ± SEM. n = 4 (105 dpi) or 5 (150 dpi) for IL34−/−; n = 4 (105 dpi) or 6 (150 dpi) for IL34+/+, n.s, P > 0.05. (K, left) GFAP immunohistochemistry of brain tissues from RML6-infected IL34−/− and IL34+/+ (WT) mice at 105 dpi. (right) Quantification of the GFAP immunostaining, n = 4, *, P < 0.05. Bars, 20 µm. (L, left) GFAP immunohistochemistry of brain tissues from RML6-infected IL34−/− and IL34+/+ (WT) mice at 150 dpi. (right) Quantification of the GFAP immunostaining. n = 3; *, P < 0.05. Bars, 20 µm. (M, left) GFAP Western blot of one hemisphere from RML6-infected IL34−/− and IL34+/+ (WT) mice at 105 dpi. (right) Densitometric quantification of the GFAP Western blot. n = 4 for IL34−/−; n = 4 for IL34+/+, *, P < 0.05. (N, left) GFAP Western blot of one hemisphere from RML6-infected IL34−/− and IL34+/+ (WT) mice at 150 dpi. (right) Densitometric quantification of the GFAP Western blot. n = 5, **, P < 0.01. Error bars represent SEM. Statistical significance in A–N was determined using unpaired Student’s t test. Histology and Western blot results represent at least three independent experiments.
Figure 4. Microglia-deficient IL34−/− mice displayed similar microglial activation, but augmented astrogliosis. (A, left) Iba1 immunohistochemistry of brain tissues from RML6-infected IL34−/− and IL34+/+ (WT) mice at 105 dpi. (right) Quantification of the Iba1 immunostaining. n = 4; n.s, P > 0.05. Bars, 20 µm. (B, left) Iba1 immunohistochemistry of brain tissues from RML6-infected IL34−/− and IL34+/+ (WT) mice at 150 dpi. (right) Quantification of the Iba1 immunostaining. n = 3; n.s, P > 0.05. Bars, 20 µm. (C, left) Iba1 Western blot of one hemisphere from RML6-infected IL34−/− and IL34+/+ (WT) mice at 105 dpi. (right) Densitometric quantification of the Iba1 Western blot. n = 4; n.s, P > 0.05. (D, left) Iba1 Western blot of one hemisphere from RML6-infected IL34−/− and IL34+/+ (WT) mice at 150 dpi. (right) Densitometric quantification of the Iba1 Western blot. n = 5; n.s, P > 0.05. (E–J) qRT-PCR of cytokines from one hemisphere of RML6-infected IL34−/− and IL34+/+ (WT) mice at 105 dpi (E–G) and 150 dpi (H–J). (E and H) TNF mRNA, (F and I) IL-1β mRNA, and (G and J) IL-6 mRNA. Relative expression normalized to GAPDH expression and represented as fold change compared with WT mice ± SEM. n = 4 (105 dpi) or 5 (150 dpi) for IL34−/−; n = 4 (105 dpi) or 6 (150 dpi) for IL34+/+, n.s, P > 0.05. (K, left) GFAP immunohistochemistry of brain tissues from RML6-infected IL34−/− and IL34+/+ (WT) mice at 105 dpi. (right) Quantification of the GFAP immunostaining, n = 4, *, P < 0.05. Bars, 20 µm. (L, left) GFAP immunohistochemistry of brain tissues from RML6-infected IL34−/− and IL34+/+ (WT) mice at 150 dpi. (right) Quantification of the GFAP immunostaining. n = 3; *, P < 0.05. Bars, 20 µm. (M, left) GFAP Western blot of one hemisphere from RML6-infected IL34−/− and IL34+/+ (WT) mice at 105 dpi. (right) Densitometric quantification of the GFAP Western blot. n = 4 for IL34−/−; n = 4 for IL34+/+, *, P < 0.05. (N, left) GFAP Western blot of one hemisphere from RML6-infected IL34−/− and IL34+/+ (WT) mice at 150 dpi. (right) Densitometric quantification of the GFAP Western blot. n = 5, **, P < 0.01. Error bars represent SEM. Statistical significance in A–N was determined using unpaired Student’s t test. Histology and Western blot results represent at least three independent experiments.CC BY-NC-SA · PubMed Central
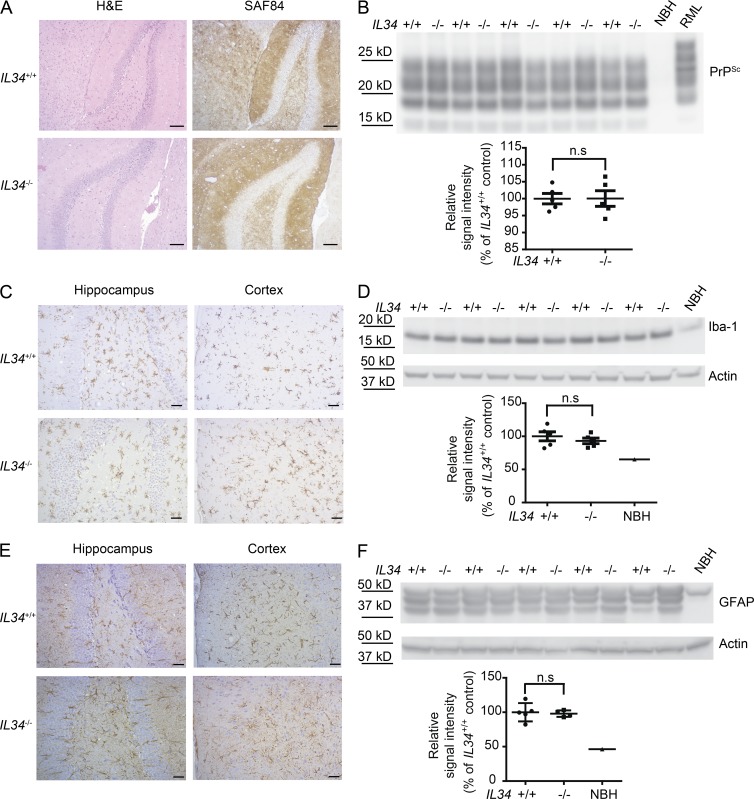
Figure 5. Similar PrPSc deposition, microglial activation, and astrogliosis in terminally sick IL34−/− and IL34+/+ mice. (A) H&E and SAF84 immunohistochemistry of the hippocampi of terminally sick RML6-infected IL34−/− and IL34+/+ (WT) mice. Bars, 50 µm. (B, top) PrPSc Western blot of hemispheric brain homogenates prepared from terminally sick RML6-infected IL34−/− and IL34+/+ (WT) mice. (bottom) Densitometric quantification of the PrPSc Western blot. n = 5. (C) Iba1 immunohistochemistry of hippocampi and cortex from terminally sick RML6-infected IL34−/− and IL34+/+ (WT) mice. Bars, 20 µm. (D, top) Iba1 Western blot of hemispheric brain homogenates prepared from terminally sick RML6-infected IL34−/− and IL34+/+ (WT) mice. (bottom) Densitometric quantification of the Iba1 Western blot. n = 5. (E) GFAP immunohistochemistry of hippocampi and cortex from terminally sick RML6-infected IL34−/− and IL34+/+ (WT) mice. Bars, 20 µm. (F, top) GFAP Western blot of hemispheric brain homogenates prepared from terminally sick RML6-infected IL34−/− and IL34+/+ (WT) mice. (bottom) Densitometric quantification of the GFAP Western blot. n = 5. Error bars represent SEM. Statistical significance in B, D, and F was determined using unpaired Student’s t test. Histology and Western blot results represent at least five independent experiments.
Figure 5. Similar PrPSc deposition, microglial activation, and astrogliosis in terminally sick IL34−/− and IL34+/+ mice. (A) H&E and SAF84 immunohistochemistry of the hippocampi of terminally sick RML6-infected IL34−/− and IL34+/+ (WT) mice. Bars, 50 µm. (B, top) PrPSc Western blot of hemispheric brain homogenates prepared from terminally sick RML6-infected IL34−/− and IL34+/+ (WT) mice. (bottom) Densitometric quantification of the PrPSc Western blot. n = 5. (C) Iba1 immunohistochemistry of hippocampi and cortex from terminally sick RML6-infected IL34−/− and IL34+/+ (WT) mice. Bars, 20 µm. (D, top) Iba1 Western blot of hemispheric brain homogenates prepared from terminally sick RML6-infected IL34−/− and IL34+/+ (WT) mice. (bottom) Densitometric quantification of the Iba1 Western blot. n = 5. (E) GFAP immunohistochemistry of hippocampi and cortex from terminally sick RML6-infected IL34−/− and IL34+/+ (WT) mice. Bars, 20 µm. (F, top) GFAP Western blot of hemispheric brain homogenates prepared from terminally sick RML6-infected IL34−/− and IL34+/+ (WT) mice. (bottom) Densitometric quantification of the GFAP Western blot. n = 5. Error bars represent SEM. Statistical significance in B, D, and F was determined using unpaired Student’s t test. Histology and Western blot results represent at least five independent experiments.CC BY-NC-SA · PubMed Central

Verification

Claims the paper makes

The claims and statistics of this paper haven’t been checked yet.

Run the check — free, no account needed. It reads the open-access text and checks the sources it cites.

A few free checks a day · papers already verified open instantly · results are public

Claims other papers make about this one

Each is checked against this paper’s own text: does it say what the citing paper says it does?

Self-check

Percentages, sums and reported differences re-computed from the paper’s own numbers.

The self-check needs the paper’s full text.

Citations

Cites

Show all 44 references

Cited by

Sorted by citations

See all 134

Metadata

Authors
Zhu, C., Herrmann, U. S., Falsig, J., Abakumova, I., Nuvolone, M., Schwarz, P., Frauenknecht, K., Rushing, E. J., & Aguzzi, A.
Affiliations
University Hospital Zurich (CH)
Corresponding author
  • Zhu, Caihong
  • Aguzzi, Adriano
Venue
Journal of Experimental Medicine
Published
2016-05-16
Volume
213
Issue
6
Pages
1047-1059
ISSN
  • 0022-1007 (ISSN-L)
  • 1540-9538
OpenAlex
W2406691442
Cited by
134
References
44
Citations by year
2026: 4 · 2025: 10 · 2024: 9 · 2023: 7 · 2022: 17 · 2021: 11 · 2020: 12 · 2019: 17 · 2018: 17 · 2017: 25 · 2016: 5
FWCI
11.08
Type
journal article
Language
en
Open access
Locations
  • The Journal of Experimental Medicine (publishedVersion)
  • Europe PMC (PubMed Central) (publishedVersion, cc-by-nc-sa)
  • PubMed Central (publishedVersion, cc-by-nc-sa)
  • PubMed (publishedVersion)
  • Zurich Open Repository and Archive (University of Zurich) (acceptedVersion, cc-by-nc)
  • Zurich Open Repository and Archive (University of Zurich) (submittedVersion, cc-by-nc)
  • Zurich Open Repository and Archive (University of Zurich)
Funders
  • European Research Council (250356)
  • Swiss National Foundation
  • Novartis Research Foundation
  • Stavros Niarchos Foundation
Topics
  • Life Sciences › Biochemistry, Genetics and Molecular Biology › Molecular Biology › Prion Diseases and Protein Misfolding
  • Life Sciences › Neuroscience › Neurology › Neuroinflammation and Neurodegeneration Mechanisms
  • Life Sciences › Neuroscience › Cellular and Molecular Neuroscience › Alzheimer's disease research and treatments
Keywords
microglia, prion disease, neuroprotection, microglial depletion, ganciclovir, IL-34, prion protein deposition, neurodegeneration
MeSH terms
Animals, Interleukins, Prions, Prion Diseases, Microglia, Mice, Knockout, Mice

About these checks

Registry, retraction, Cites and statistics results are computed, not judged, with one exception: a printed reference that no index lists is read once by a model before it counts as a citation error. Claims are extracted by a model and kept only when their quote appears verbatim in the text; each cited source is then checked, with a model’s help, for whether it says what the claim relies on. Those verdicts can be wrong — read the claim’s quote and the cited source before relying on one.

Statistics and arithmetic are recomputed, not judged.

Confidence bands are shown only for fields calibrated on our annotated test set. None is calibrated yet, so no band is shown.

What counts as a claim ›How we measure confidence ›How we check this ›

Are you an author, or do you see a problem with this page? Request a review