

The DOI matches its Crossref record; 64 of the 64 references it cites were found in a registry or an index.
The fate and lifespan of human monocyte subsets in steady state and systemic inflammation
Open accessAbstract
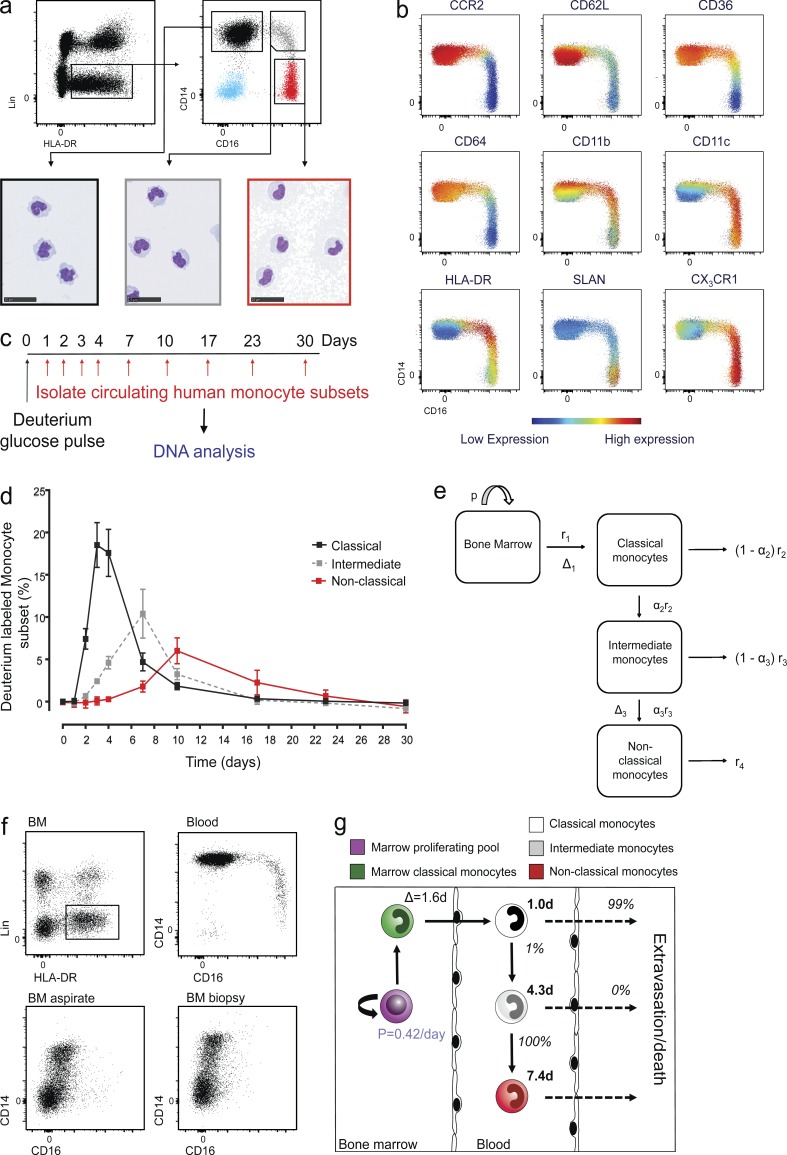
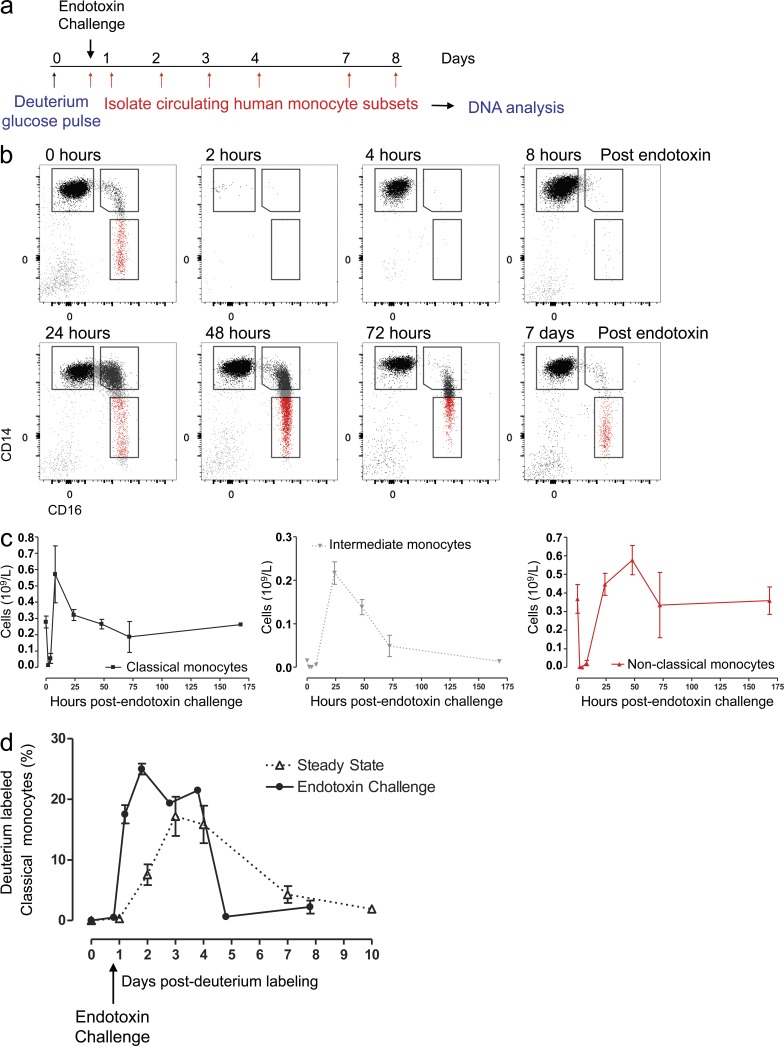
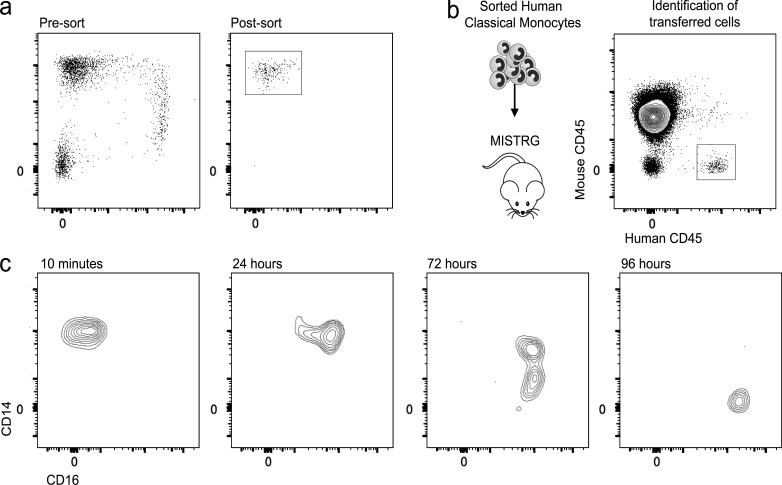
In humans, the monocyte pool comprises three subsets (classical, intermediate, and nonclassical) that circulate in dynamic equilibrium. The kinetics underlying their generation, differentiation, and disappearance are critical to understanding both steady-state homeostasis and inflammatory responses. Here, using human in vivo deuterium labeling, we demonstrate that classical monocytes emerge first from marrow, after a postmitotic interval of 1.6 d, and circulate for a day. Subsequent labeling of intermediate and nonclassical monocytes is consistent with a model of sequential transition. Intermediate and nonclassical monocytes have longer circulating lifespans (∼4 and ∼7 d, respectively). In a human experimental endotoxemia model, a transient but profound monocytopenia was observed; restoration of circulating monocytes was achieved by the early release of classical monocytes from bone marrow. The sequence of repopulation recapitulated the order of maturation in healthy homeostasis. This developmental relationship between monocyte subsets was verified by fate mapping grafted human classical monocytes into humanized mice, which were able to differentiate sequentially into intermediate and nonclassical cells.
Overview
The claims and statistics of this paper haven’t been checked yet.
Run the check — free, no account needed. It reads the open-access text and checks the sources it cites.
Integrity signals
Registry
Cites
Statistics
Figures
Verification
Claims the paper makes
The claims and statistics of this paper haven’t been checked yet.
Run the check — free, no account needed. It reads the open-access text and checks the sources it cites.
Claims other papers make about this one
Each is checked against this paper’s own text: does it say what the citing paper says it does?
In the citing paper
“Similarly, in humans, the nonclassical CD14+CD16+ monocytes normally remain in the blood circulation, where they patrol the endothelium to scan the integrity of endothelial cells147.”
From Inflammation and its resolution in atherosclerosis: mediators and therapeutic opportunities (2019) · cites this paper as [147]
Self-check
Percentages, sums and reported differences re-computed from the paper’s own numbers.
The self-check needs the paper’s full text.
Citations
Cites
Fate Mapping Analysis Reveals That Adult Microglia Derive from Primitive Macrophages
Ginhoux, F., Greter, M., Leboeuf, M., Nandi, S., See, P., Gokhan, S., Mehler, M. F., Conway, S. J., Ng, L. G., Stanley, E. R., et al. (2010) · Science · doi:10.1126/science.1194637 · Cited by 5,175
Macrophage biology in development, homeostasis and disease
Wynn, T. A., Chawla, A., & Pollard, J. W. (2013) · Nature · doi:10.1038/nature12034 · Cited by 4,684 · cited 1×
“Collectively, the cells of the mononuclear phagocyte system play key functions in maintaining tissue homeostasis during steady state as well as orchestrating the genesis and resolution of the immune response (Davies et al., 2013; Wynn et al., 2013; Ginhoux and Jung, 2014).”
BackgroundBlood Monocytes Consist of Two Principal Subsets with Distinct Migratory Properties
Geissmann, F., Jung, S., & Littman, D. R. (2003) · Immunity · doi:10.1016/s1074-7613(03)00174-2 · Cited by 3,504
Fate Mapping Reveals Origins and Dynamics of Monocytes and Tissue Macrophages under Homeostasis
Yona, S., Kim, K.-W., Wolf, Y., Mildner, A., Varol, D., Breker, M., Strauss-Ayali, D., Viukov, S., Guilliams, M., Misharin, A., et al. (2013) · Immunity · doi:10.1016/j.immuni.2012.12.001 · Cited by 3,245
Self-citationMonocyte recruitment during infection and inflammation
Shi, C., & Pamer, E. G. (2011) · Nature Reviews Immunology · doi:10.1038/nri3070 · Cited by 3,015
A Lineage of Myeloid Cells Independent of Myb and Hematopoietic Stem Cells
Schulz, C., Perdiguero, E. G., Chorro, L., Szabo-Rogers, H., Cagnard, N., Kierdorf, K., Prinz, M., Wu, B., Jacobsen, S. E. W., Pollard, J. W., et al. (2012) · Science · doi:10.1126/science.1219179 · Cited by 2,578
Nomenclature of monocytes and dendritic cells in blood
Ziegler‐Heitbrock, L., Ancuța, P., Crowe, S. M., Dalod, M., Grau, V., Hart, D. N. J., Leenen, P. J. M., Liu, Y.-J., MacPherson, G. G., Randolph, G. J., et al. (2010) · Blood · doi:10.1182/blood-2010-02-258558 · Cited by 2,436
Hashimoto, D., Chow, A., Noizat, C., Teo, P., Beasley, M. B., Leboeuf, M., Becker, C. D., See, P., Price, J., Lucas, D., et al. (2013) · Immunity · doi:10.1016/j.immuni.2013.04.004 · Cited by 2,311
Nahrendorf, M., Swirski, F. K., Aikawa, E., Stangenberg, L., Wurdinger, T., Figueiredo, J.-L., Libby, P., Weissleder, R., & Pittet, M. J. (2007) · The Journal of Experimental Medicine · doi:10.1084/jem.20070885 · Cited by 2,300
Davies, L. C., Jenkins, S. J., Allen, J. E., & Taylor, P. R. (2013) · Nature Immunology · doi:10.1038/ni.2705 · Cited by 2,096
Research works printed but not linked: 1
- van Furth, 1972, [Mononuclear phagocytic system: new classification of macrophages, monocytes and of their cell line], Bull. World Health Organ., 47, 651
Cited by
Sorted by citations
Defining trained immunity and its role in health and disease
Netea, M. G., Domínguez-Andrés, J., Barreiro, L. B., Chavakis, T., Divangahi, M., Fuchs, E., Joosten, L. A. B., van der Meer, J. W. M., Mhlanga, M. M., Mulder, W. J. M., et al. (2020) · Nature Reviews Immunology · doi:10.1038/s41577-020-0285-6 · Cited by 2,690
Norelli, M., Camisa, B., Barbiera, G., Falcone, L., Purevdorj, A., Genua, M., Sanvito, F., Ponzoni, M., Doglioni, C., Cristofori, P., et al. (2018) · Nature Medicine · doi:10.1038/s41591-018-0036-4 · Cited by 1,406
Inflammation and its resolution in atherosclerosis: mediators and therapeutic opportunities
Bäck, M., Yurdagul, A., Tabas, I., Öörni, K., & Kovanen, P. T. (2019) · Nature Reviews Cardiology · doi:10.1038/s41569-019-0169-2 · Cited by 1,341
Human dendritic cell subsets: an update
Collin, M., & Bigley, V. (2018) · Immunology · doi:10.1111/imm.12888 · Cited by 1,301
Self-citationDevelopmental and Functional Heterogeneity of Monocytes
Guilliams, M., Mildner, A., & Yona, S. (2018) · Immunity · doi:10.1016/j.immuni.2018.10.005 · Cited by 973
Self-citationHuman Monocyte Subsets and Phenotypes in Major Chronic Inflammatory Diseases
Kapellos, T. S., Bonaguro, L., Gemünd, I. D., Reusch, N., Saglam, A., Hinkley, E. R., & Schultze, J. L. (2019) · Frontiers in Immunology · doi:10.3389/fimmu.2019.02035 · Cited by 942
Skin Acute Wound Healing: A Comprehensive Review
Cañedo‐Dorantes, L., & Cañedo-Ayala, M. (2019) · International Journal of Inflammation · doi:10.1155/2019/3706315 · Cited by 742
Cell Type-Specific Roles of NF-κB Linking Inflammation and Thrombosis
Mussbacher, M., Salzmann, M., Brostjan, C., Hoesel, B., Schoergenhofer, C., Datler, H., Hohensinner, P., Basílio, J., Petzelbauer, P., Assinger, A., et al. (2019) · Frontiers in Immunology · doi:10.3389/fimmu.2019.00085 · Cited by 596
Monocyte heterogeneity and functions in cancer
Olingy, C. E., Dinh, H. Q., & Hedrick, C. C. (2019) · Journal of Leukocyte Biology · doi:10.1002/jlb.4ri0818-311r · Cited by 598
Xiao, L., & Harrison, D. G. (2020) · Canadian Journal of Cardiology · doi:10.1016/j.cjca.2020.01.013 · Cited by 557
Guidelines for the use of flow cytometry and cell sorting in immunological studies (third edition)
Cossarizza, A., Chang, H., Radbruch, A., Abrignani, S., Addo, R., Akdis, M., Andrä, I., Andreata, F., Annunziato, F., Arranz, E., et al. (2021) · European Journal of Immunology · doi:10.1002/eji.202170126 · Cited by 531
Nonclassical Monocytes in Health and Disease
Narasimhan, P. B., Marcovecchio, P., Hamers, A. A. J., & Hedrick, C. C. (2019) · Annual Review of Immunology · doi:10.1146/annurev-immunol-042617-053119 · Cited by 493
L-selectin: A Major Regulator of Leukocyte Adhesion, Migration and Signaling
Ívetic, A., Green, H. L. H., & Hart, S. J. (2019) · Frontiers in Immunology · doi:10.3389/fimmu.2019.01068 · Cited by 493
Single-nucleus cross-tissue molecular reference maps toward understanding disease gene function
Eraslan, G., Drokhlyansky, E., Anand, S. K., Fiškin, E., Subramanian, A., Slyper, M., Wang, J., Wittenberghe, N. V., Rouhana, J. M., Waldman, J., et al. (2022) · Science · doi:10.1126/science.abl4290 · Cited by 406
Aryl hydrocarbon receptor Controls Monocyte Differentiation into dendritic Cells versus Macrophages
Goudot, C., Coillard, A., Villani, A.-C., Gueguen, P., Cros, A., Sarkizova, S., Tang-Huau, T.-L., Bohec, M., Baulande, S., Hacohen, N., et al. (2017) · Immunity · doi:10.1016/j.immuni.2017.08.016 · Cited by 382
The Role of Macrophages in Staphylococcus aureus Infection
Pidwill, G. R., Gibson, J. F., Cole, J., Renshaw, S. A., & Foster, S. J. (2021) · Frontiers in Immunology · doi:10.3389/fimmu.2020.620339 · Cited by 360
NF-κB in monocytes and macrophages – an inflammatory master regulator in multitalented immune cells
Mußbacher, M., Derler, M., Basílio, J., & Schmid, J. A. (2023) · Frontiers in Immunology · doi:10.3389/fimmu.2023.1134661 · Cited by 336
Epigenetic memory of coronavirus infection in innate immune cells and their progenitors
Cheong, J.-G., Ravishankar, A., Sharma, S., Parkhurst, C. N., Grassmann, S. A., Wingert, C. K., Laurent, P., Ma, S., Paddock, L., Miranda, I. C., et al. (2023) · Cell · doi:10.1016/j.cell.2023.07.019 · Cited by 309
Myocardial and Systemic Inflammation in Acute Stress-Induced (Takotsubo) Cardiomyopathy
Scally, C., Abbas, H., Ahearn, T. S., Srinivasan, J., Mezincescu, A. M., Rudd, A. E., Spath, N., Yucel-Finn, A., Yuecel, R., Oldroyd, K. G., et al. (2019) · Circulation · doi:10.1161/circulationaha.118.037975 · Cited by 295
Recent advances in molecular mechanisms of skin wound healing and its treatments
Mamun, A. A., Shao, C., Geng, P., Wang, S., & Xiao, J. (2024) · Frontiers in Immunology · doi:10.3389/fimmu.2024.1395479 · Cited by 338
How chemokines organize the tumour microenvironment
Mempel, T. R., Lill, J. K., & Altenburger, L. M. (2023) · Nature reviews. Cancer · doi:10.1038/s41568-023-00635-w · Cited by 317
The impact of ageing on monocytes and macrophages
De Maeyer, R. P. H., & Chambers, E. S. (2021) · Immunology Letters · doi:10.1016/j.imlet.2020.12.003 · Cited by 275
Patterson, B. K., Francisco, E. B., Yogendra, R., Long, E., Pise, A., Rodrigues, H., Hall, E., Herrera, M., Parikh, P., Guevara-Coto, J. A., et al. (2022) · Frontiers in Immunology · doi:10.3389/fimmu.2021.746021 · Cited by 272
The single-cell epigenomic and transcriptional landscape of immunity to influenza vaccination
Wimmers, F., Donato, M., Kuo, A. J., Ashuach, T., Gupta, S., Li, C., Dvorak, M., Foecke, M. H., Chang, S. E., Hagan, T., et al. (2021) · Cell · doi:10.1016/j.cell.2021.05.039 · Cited by 275
Periphery and brain, innate and adaptive immunity in Parkinson’s disease
Harms, A. S., Ferreira, S. A., & Romero‐Ramos, M. (2021) · Acta Neuropathologica · doi:10.1007/s00401-021-02268-5 · Cited by 291
The Mononuclear Phagocyte System: The Relationship between Monocytes and Macrophages
Hume, D. A., Irvine, K. M., & Pridans, C. (2018) · Trends in Immunology · doi:10.1016/j.it.2018.11.007 · Cited by 270
Myeloid cell contributions to cardiovascular health and disease
Nahrendorf, M. (2018) · Nature Medicine · doi:10.1038/s41591-018-0064-0 · Cited by 267
Beyond Hemostasis: Platelet Innate Immune Interactions and Thromboinflammation
Mandel, J., Casari, M., Stepanyan, M. G., Martyanov, A. A., & Deppermann, C. (2022) · International Journal of Molecular Sciences · doi:10.3390/ijms23073868 · Cited by 288
Priming Microglia for Innate Immune Memory in the Brain
Neher, J. J., & Cunningham, C. M. (2019) · Trends in Immunology · doi:10.1016/j.it.2019.02.001 · Cited by 263
Ong, S.-M., Hadadi, E., Dang, T.-M., Yeap, W.-H., Tan, C. T.-Y., Ng, T.-P., Larbi, A., & Wong, S.-C. (2018) · Cell Death & Disease · doi:10.1038/s41419-018-0327-1 · Cited by 233
Macrophage functional diversity in NAFLD — more than inflammation
Barreby, E., Chen, P., & Aouadi, M. (2022) · Nature Reviews Endocrinology · doi:10.1038/s41574-022-00675-6 · Cited by 251
Pattern of human monocyte subpopulations in health and disease
Ożańska, A., Szymczak, D., & Rybka, J. (2020) · Scandinavian Journal of Immunology · doi:10.1111/sji.12883 · Cited by 261
The Macrophage in Cardiac Homeostasis and Disease
Lavine, K. J., Pinto, A. R., Epelman, S., Kopecky, B. J., Clemente-Casares, X., Godwin, J., Rosenthal, N., & Kovacic, J. C. (2018) · Journal of the American College of Cardiology · doi:10.1016/j.jacc.2018.08.2149 · Cited by 234
Dendritic cells in the regulation of immunity and inflammation
Qian, C., & Cao, X. (2017) · Seminars in Immunology · doi:10.1016/j.smim.2017.12.002 · Cited by 234
Cassetta, L., Bækkevold, E. S., Brandau, S., Bujko, A., Cassatella, M. A., Dorhoi, A., Krieg, C., Lin, A., Loré, K., Marini, O., et al. (2019) · Cancer Immunology Immunotherapy · doi:10.1007/s00262-019-02302-2 · Cited by 235
The HIV Reservoir in Monocytes and Macrophages
Wong, M. E., Jaworowski, A., & Hearps, A. C. (2019) · Frontiers in Immunology · doi:10.3389/fimmu.2019.01435 · Cited by 249
Targeting the CCL2/CCR2 Axis in Cancer Immunotherapy: One Stone, Three Birds?
Fei, L., Ren, X., Yu, H., & Zhan, Y. (2021) · Frontiers in Immunology · doi:10.3389/fimmu.2021.771210 · Cited by 230
In vivo Differentiation of Human Monocytes
Coillard, A., & Segura, É. (2019) · Frontiers in Immunology · doi:10.3389/fimmu.2019.01907 · Cited by 218
Immune Function and Diversity of Osteoclasts in Normal and Pathological Conditions
Madel, M., Ibáñez, L., Wakkach, A., de Vries, T. J., Teti, A. M., Apparailly, F., & Blin‐Wakkach, C. (2019) · Frontiers in Immunology · doi:10.3389/fimmu.2019.01408 · Cited by 212
Innate immune cells in cirrhosis
Bernsmeier, C., der Merwe, V., & Périanin, A. (2020) · Journal of Hepatology · doi:10.1016/j.jhep.2020.03.027 · Cited by 211
Macrophage Clearance of Apoptotic Cells: A Critical Assessment
Gordon, S., & Plüddemann, A. (2018) · Frontiers in Immunology · doi:10.3389/fimmu.2018.00127 · Cited by 201
The Ontogeny of Monocyte Subsets
Wolf, A. A., Yáñez, A., Barman, P. K., & Goodridge, H. S. (2019) · Frontiers in Immunology · doi:10.3389/fimmu.2019.01642 · Cited by 223
Patel, A. A., Ginhoux, F., & Yona, S. (2021) · Immunology · doi:10.1111/imm.13320 · Cited by 228
Self-citationCarsetti, R., Zaffina, S., Mortari, E. P., Terreri, S., Corrente, F., Capponi, C., Palomba, P., Mirabella, M., Cascioli, S., Palange, P., et al. (2020) · Frontiers in Immunology · doi:10.3389/fimmu.2020.610300 · Cited by 201
The Role of Macrophages in HIV-1 Persistence and Pathogenesis
Kruize, Z., & Kootstra, N. A. (2019) · Frontiers in Microbiology · doi:10.3389/fmicb.2019.02828 · Cited by 205
Boumaza, A. F., Gay, L., Mezouar, S., Bestion, E., Diallo, A. B., Michel, M., Desnues, B., Raoult, D., Scola, B. L., Halfon, P., et al. (2021) · The Journal of Infectious Diseases · doi:10.1093/infdis/jiab044 · Cited by 200
Loperena, R., Beusecum, J. P. V., Itani, H. A., Engel, N., Laroumanie, F., Xiao, L., Elijovich, F., Laffer, C. L., Gnecco, J. S., Noonan, J. E., et al. (2018) · Cardiovascular Research · doi:10.1093/cvr/cvy112 · Cited by 188
Distinct developmental pathways from blood monocytes generate human lung macrophage diversity
Evren, E., Ringqvist, E. E., Tripathi, K. P., Sleiers, N., Rives, I. C., Alisjahbana, A., Gao, Y., Sarhan, D., Halle, T., Sorini, C., et al. (2020) · Immunity · doi:10.1016/j.immuni.2020.12.003 · Cited by 194
Long-term reprogramming of the innate immune system
Domínguez‐Andrés, J., & Netea, M. G. (2018) · Journal of Leukocyte Biology · doi:10.1002/jlb.mr0318-104r · Cited by 182
Microglia versus Monocytes: Distinct Roles in Degenerative Diseases of the Retina
Chen, Y., Roubeix, C., Sennlaub, F., & Saban, D. R. (2020) · Trends in Neurosciences · doi:10.1016/j.tins.2020.03.012 · Cited by 169
The effects of monocytes on tumor cell extravasation in a 3D vascularized microfluidic model
Boussommier-Calleja, A., Atiyas, Y., Haase, K., Headley, M., Lewis, C., & Kamm, R. D. (2019) · Biomaterials · doi:10.1016/j.biomaterials.2018.03.005 · Cited by 158
Theobald, S. J., Simonis, A., Georgomanolis, T., Kreer, C., Zehner, M., Eisfeld, H. S., Albert, M., Chhen, J., Motameny, S., Erger, F., et al. (2021) · EMBO Molecular Medicine · doi:10.15252/emmm.202114150 · Cited by 172
Pinton, L., Masetto, E., Vettore, M., Solito, S., Magri, S., D'Andolfi, M., Bianco, P. D., Lollo, G., Benoît, J., Okada, H., et al. (2019) · Journal for ImmunoTherapy of Cancer · doi:10.1186/s40425-019-0536-x · Cited by 161
Nowak, W., Grendas, L. N., Sanmarco, L. M., Estecho, I. G., Arena, Á. R., Eberhardt, N., Rodante, D. E., Aoki, M. P., Daray, F. M., Carrera Silva, E. A., et al. (2019) · EBioMedicine · doi:10.1016/j.ebiom.2019.10.063 · Cited by 159
The origins and homeostasis of monocytes and tissue‐resident macrophages in physiological situation
Zhao, Y., Zou, W., Du, J., & Zhao, Y. (2018) · Journal of Cellular Physiology · doi:10.1002/jcp.26461 · Cited by 190
Monocyte Regulation in Homeostasis and Malignancy
Robinson, A., Han, C. Z., Glass, C. K., & Pollard, J. W. (2021) · Trends in Immunology · doi:10.1016/j.it.2020.12.001 · Cited by 165
Social Stress Mobilizes Hematopoietic Stem Cells to Establish Persistent Splenic Myelopoiesis
McKim, D. B., Yin, W., Wang, Y., Cole, S. W., Godbout, J. P., & Sheridan, J. F. (2018) · Cell Reports · doi:10.1016/j.celrep.2018.10.102 · Cited by 153
Comparison of DNA repair and radiosensitivity of different blood cell populations
Heylmann, D., Ponath, V., Kindler, T., & Kaina, B. (2021) · Scientific Reports · doi:10.1038/s41598-021-81058-1 · Cited by 148
Trained immunity: General and emerging concepts
Vuscan, P., Kischkel, B., Joosten, L. A. B., & Netea, M. G. (2024) · Immunological Reviews · doi:10.1111/imr.13326 · Cited by 162
The immune system in Parkinson's disease: what we know so far
Roodveldt, C., Bernardino, L. I., Çakmak, Ö. Ö., Dragić, M., Fladmark, K. E., Ertan, S., Aktaş, B., Pita, C., Ciglar, L., Garraux, G., et al. (2024) · Brain · doi:10.1093/brain/awae177 · Cited by 151
Role of SLC7A5 in Metabolic Reprogramming of Human Monocyte/Macrophage Immune Responses
Yoon, B. R., Oh, Y.-J., Kang, S. W., Lee, E. B., & Lee, W. (2018) · Frontiers in Immunology · doi:10.3389/fimmu.2018.00053 · Cited by 144
A distinct innate immune signature marks progression from mild to severe COVID-19
Chevrier, S., Zurbuchen, Y., Cervia, C., Adamo, S., Raeber, M. E., de Souza, N., Sivapatham, S., Jacobs, A., Bächli, E., Rudiger, A., et al. (2020) · Cell Reports Medicine · doi:10.1016/j.xcrm.2020.100166 · Cited by 136
Macrophage Biology, Classification, and Phenotype in Cardiovascular Disease
Williams, J. W., Giannarelli, C., Rahman, A. H., Randolph, G. J., & Kovacic, J. C. (2018) · Journal of the American College of Cardiology · doi:10.1016/j.jacc.2018.08.2148 · Cited by 149
Dynamics of human monocytes and airway macrophages during healthy aging and after transplant
Byrne, A. J., Powell, J. E., O’Sullivan, B., Ogger, P. P., Hoffland, A., Cook, J., Bonner, K., Hewitt, R. J., Wolf, S., Ghai, P., et al. (2020) · The Journal of Experimental Medicine · doi:10.1084/jem.20191236 · Cited by 142
Monocyte Recruitment, Specification, and Function in Atherosclerosis
Kim, K.-W., Ivanov, S., & Williams, J. W. (2020) · Cells · doi:10.3390/cells10010015 · Cited by 139
Systemic Reprogramming of Monocytes in Cancer
Kiss, M., Caro, A. A., Raes, G., & Laoui, D. (2020) · Frontiers in Oncology · doi:10.3389/fonc.2020.01399 · Cited by 133
Major alterations in the mononuclear phagocyte landscape associated with COVID-19 severity
Kvedaraite, E., Hertwig, L., Sinha, I., Ponzetta, A., Myrberg, I. H., Lourda, M., Dzidic, M., Akber, M., Klingström, J., Folkesson, E., et al. (2021) · Proceedings of the National Academy of Sciences · doi:10.1073/pnas.2018587118 · Cited by 128
Hinterdobler, J., Schott, S., Jin, H. H., Meesmann, A., Steinsiek, A.-L., Zimmermann, A.-S., Wobst, J., Müller, P., Mauersberger, C., Vilne, B., et al. (2021) · European Heart Journal · doi:10.1093/eurheartj/ehab371 · Cited by 134
Myocardial infarction drives trained immunity of monocytes, accelerating atherosclerosis
Dong, Z., Hou, L., Luo, W., Pan, L., Xiao, L., Tan, H., Wu, R., Lu, H., Yao, K., Mu, M., et al. (2023) · European Heart Journal · doi:10.1093/eurheartj/ehad787 · Cited by 137
Macrophages and Cardiovascular Health
Frodermann, V., & Nahrendorf, M. (2018) · Physiological Reviews · doi:10.1152/physrev.00068.2017 · Cited by 128
Human monocytes and macrophages regulate immune tolerance via integrin αvβ8–mediated TGFβ activation
Kelly, A., Gunaltay, S., McEntee, C. P., Shuttleworth, E. E., Smedley, C., Houston, S. A., Fenton, T. M., Levison, S., Mann, E. R., & Travis, M. A. (2018) · Journal of Experimental Medicine · doi:10.1084/jem.20171491 · Cited by 124
Human Monocyte Subset Distinctions and Function: Insights From Gene Expression Analysis
Cormican, S., & Griffin, M. D. (2020) · Frontiers in Immunology · doi:10.3389/fimmu.2020.01070 · Cited by 126
Wong, S. W., Lenzini, S. B., Cooper, M. H., Mooney, D. J., & Shin, J. (2020) · Science Advances · doi:10.1126/sciadv.aaw0158 · Cited by 126
Skull bone marrow channels as immune gateways to the central nervous system
Mazzitelli, J. A., Pulous, F. E., Smyth, L. C. D., Kaya, Z., Rustenhoven, J., Moskowitz, M. A., Kipnis, J., & Nahrendorf, M. (2023) · Nature Neuroscience · doi:10.1038/s41593-023-01487-1 · Cited by 116
Role of Monocytes in Heart Failure and Atrial Fibrillation
Shahid, F., Lip, G. Y. H., & Shantsila, E. (2018) · Journal of the American Heart Association · doi:10.1161/jaha.117.007849 · Cited by 124
Macrophage metabolic reprogramming during chronic lung disease
Ogger, P. P., & Byrne, A. J. (2020) · Mucosal Immunology · doi:10.1038/s41385-020-00356-5 · Cited by 123
β-Glucan Induces Distinct and Protective Innate Immune Memory in Differentiated Macrophages
Stothers, C. L., Burelbach, K. R., Owen, A. M., Patil, N. K., McBride, M. A., Bohannon, J. K., Luan, L., Hernandez, A., Patil, T. K., Williams, D. L., et al. (2021) · The Journal of Immunology · doi:10.4049/jimmunol.2100107 · Cited by 120
Monocytes and macrophages: Origin, homing, differentiation, and functionality during inflammation
Dash, S. P., Gupta, S., & Sarangi, P. P. (2024) · Heliyon · doi:10.1016/j.heliyon.2024.e29686 · Cited by 124
Capturing the Fantastic Voyage of Monocytes Through Time and Space
Teh, Y. C., Ding, J. L., Ng, L. G., & Chong, S. Z. (2019) · Frontiers in Immunology · doi:10.3389/fimmu.2019.00834 · Cited by 120
Experimental human endotoxemia as a model of systemic inflammation
van Lier, D. P. T., Geven, C., Leijte, G. P., & Pickkers, P. (2018) · Biochimie · doi:10.1016/j.biochi.2018.06.014 · Cited by 112
A Novel, Five-Marker Alternative to CD16–CD14 Gating to Identify the Three Human Monocyte Subsets
Ong, S., Teng, K. W. W., Newell, E. W., Chen, H., Chen, J., Loy, T., Yeo, T.-W., Fink, K., & Wong, S. C. (2019) · Frontiers in Immunology · doi:10.3389/fimmu.2019.01761 · Cited by 111
Monocyte activation in systemic Covid-19 infection: Assay and rationale
Martínez, F. O., Combes, T., Orsenigo, F., & Gordon, S. (2020) · EBioMedicine · doi:10.1016/j.ebiom.2020.102964 · Cited by 111
Perturbation of the Monocyte Compartment in Human Obesity
Friedrich, K., Sommer, M., Strobel, S., Thrum, S., Blüher, M., Wagner, U. G., & Rossol, M. (2019) · Frontiers in Immunology · doi:10.3389/fimmu.2019.01874 · Cited by 110
Gómez-Aristizábal, A., Gandhi, R., Mahomed, N. N., Marshall, K. W., & Viswanathan, S. (2019) · Arthritis Research & Therapy · doi:10.1186/s13075-018-1798-2 · Cited by 108
The expanding world of tissue‐resident macrophages
Jenkins, S. J., & Allen, J. E. (2021) · European Journal of Immunology · doi:10.1002/eji.202048881 · Cited by 114
Sheffey, V. V., Siew, E. B., Tanner, E. E. L., & Eniola‐Adefeso, O. (2022) · Advanced Healthcare Materials · doi:10.1002/adhm.202101536 · Cited by 103
Macrophage immunomodulation in chronic osteolytic diseases—the case of periodontitis
Sima, C., Viniegra, A., & Glogauer, M. (2018) · Journal of Leukocyte Biology · doi:10.1002/jlb.1ru0818-310r · Cited by 108
Wijeyekoon, R., Kronenberg‐Versteeg, D., Scott, K. M., Hayat, S., Kuan, W., Evans, J., Breen, D. P., Cummins, G. A., Jones, J., Clatworthy, M. R., et al. (2020) · Brain Behavior and Immunity · doi:10.1016/j.bbi.2020.01.018 · Cited by 105
Mulder, P. P. G., Vlig, M., Boekema, B. K. H. L., Stoop, M. M., Pijpe, A., van Zuijlen, P. P. M., de Jong, E., van Cranenbroek, B., Joosten, I., Koenen, H. J. P. M., et al. (2021) · Frontiers in Immunology · doi:10.3389/fimmu.2020.621222 · Cited by 109
Immune aging – A mechanism in autoimmune disease
Zheng, Y., Liu, Q., Goronzy, J. J., & Weyand, C. M. (2023) · Seminars in Immunology · doi:10.1016/j.smim.2023.101814 · Cited by 109
Hirose, S., Lin, Q., Ohtsuji, M., Nishimura, H., & Verbeek, J. S. (2019) · International Immunology · doi:10.1093/intimm/dxz036 · Cited by 106
Macrophage profiling in atherosclerosis: understanding the unstable plaque
Gianopoulos, I., & Daskalopoulou, S. S. (2024) · Basic Research in Cardiology · doi:10.1007/s00395-023-01023-z · Cited by 101
Monocyte Differentiation and Heterogeneity: Inter-Subset and Interindividual Differences
Williams, H., Mack, C. D., Baraz, R., Marimuthu, R., Naralashetty, S., Li, S., & Medbury, H. J. (2023) · International Journal of Molecular Sciences · doi:10.3390/ijms24108757 · Cited by 108
Utility of monocyte HLA-DR and rationale for therapeutic GM-CSF in sepsis immunoparalysis
Joshi, I., Carney, W. P., & Rock, E. P. (2023) · Frontiers in Immunology · doi:10.3389/fimmu.2023.1130214 · Cited by 103
Yan, P., Kim, K.-W., Xiao, Q., Ma, X., Czerniewski, L. R., Liu, H., Rawnsley, D. R., Yan, Y., Randolph, G. J., Epelman, S., et al. (2022) · Journal of Clinical Investigation · doi:10.1172/jci152565 · Cited by 95
Innate Immune Memory and the Host Response to Infection
Sherwood, E. R., Burelbach, K. R., McBride, M. A., Stothers, C. L., Owen, A. M., Hernandez, A., Patil, N. K., Williams, D. L., & Bohannon, J. K. (2022) · The Journal of Immunology · doi:10.4049/jimmunol.2101058 · Cited by 104
The Endless Saga of Monocyte Diversity
Canè, S., Ugel, S., Trovato, R., Marigo, I., Sanctis, F. D., Sartoris, S., & Bronte, V. (2019) · Frontiers in Immunology · doi:10.3389/fimmu.2019.01786 · Cited by 100
Bone marrow endothelial dysfunction promotes myeloid cell expansion in cardiovascular disease
Rohde, D., Vandoorne, K., Lee, I., Grune, J., Zhang, S., McAlpine, C. S., Schloss, M. J., Nayar, R., Courties, G., Frodermann, V., et al. (2021) · Nature Cardiovascular Research · doi:10.1038/s44161-021-00002-8 · Cited by 100
Chambers, E. S., Vukmanovic-Stejic, M., Shih, B. B., Trahair, H., Subramanian, P., Devine, O. P., Glanville, J., Gilroy, D., Rustin, M. H. A., Freeman, T. C., et al. (2021) · Nature Aging · doi:10.1038/s43587-020-00010-6 · Cited by 96
Self-citationA lipid atlas of human and mouse immune cells provides insights into ferroptosis susceptibility
Morgan, P. K., Pernes, G., Huynh, K., Giles, C., Paul, S., Smith, A., Mellett, N. A., Liang, A., van Buuren-Milne, T., Veiga, C. B., et al. (2024) · Nature Cell Biology · doi:10.1038/s41556-024-01377-z · Cited by 103
Metadata
- Authors
- Patel, A. A., Zhang, Y., Fullerton, J. N., Boelen, L., Rongvaux, A., Maini, A. A., Bigley, V., Flavell, R. A., Gilroy, D. W., Asquith, B., Macallan, D., & Yona, S.
- Affiliations
- University of London (GB)
- St George's, University of London (GB)
- Imperial College London (GB)
- Yale University (US)
- Newcastle University (GB)
- Howard Hughes Medical Institute (US)
- Corresponding author
- Yona, Simon
- ORCID
- Venue
- Journal of Experimental Medicine
- Publisher
- Rockefeller University Press
- Published
- 2017-06-12
- Volume
- 214
- Issue
- 7
- Pages
- 1913-1923
- ISSN
- 0022-1007 (ISSN-L)
- 1540-9538
- PMC
- PMC5502436
- OpenAlex
- W2626120438
- Cited by
- 946
- References
- 64
- Citations by year
- 2026: 67 · 2025: 111 · 2024: 126 · 2023: 104 · 2022: 120 · 2021: 114 · 2020: 126 · 2019: 94 · 2018: 76 · 2017: 8
- FWCI
- 37.62
- Type
- journal article
- Language
- en
- Open access
- hybrid
- doi.org
- Locations
- The Journal of Experimental Medicine (publishedVersion, cc-by)
- Europe PMC (PubMed Central) (publishedVersion, cc-by)
- PubMed Central (publishedVersion, cc-by)
- PubMed (publishedVersion)
- St George's Online Research Archive (St George's University of London) (acceptedVersion)
- UCL Discovery (University College London) (submittedVersion)
- Spiral (Imperial College London) (submittedVersion, cc-by)
- Newcastle University ePrints (Newcastle Univesity) (cc-by)
- Funders
- Engineering and Physical Sciences Research Council
- Wellcome Trust (093053/Z/10/Z, 103865)
- Medical Research Council (G1001052, J007439)
- Bloodwise (15012)
- European Union Seventh Framework Program (FP7/2007–2013, 317040)
- Leukemia and Lymphoma Research (15012)
- Topics
- Life Sciences › Immunology and Microbiology › Immunology › Immune cells in cancer
- Life Sciences › Immunology and Microbiology › Immunology › Immune Response and Inflammation
- Life Sciences › Immunology and Microbiology › Immunology › Immune responses and vaccinations
- Keywords
- monocyte subsets, classical monocytes, intermediate monocytes, non-classical monocytes, systemic inflammation, endotoxemia, monocytopenia, monocyte differentiation, fate mapping, humanized mice, deuterium labeling
- MeSH terms
- Animals, Bone Marrow Cells, Cell Differentiation, Cell Survival, Cells, Cultured, Deuterium, Flow Cytometry, Homeostasis, Humans, Inflammation, Isotope Labeling, Monocytes, Time Factors, Endotoxemia, Mice
About these checks
Registry, retraction, Cites and statistics results are computed, not judged, with one exception: a printed reference that no index lists is read once by a model before it counts as a citation error. Claims are extracted by a model and kept only when their quote appears verbatim in the text; each cited source is then checked, with a model’s help, for whether it says what the claim relies on. Those verdicts can be wrong — read the claim’s quote and the cited source before relying on one.
Statistics and arithmetic are recomputed, not judged.
Confidence bands are shown only for fields calibrated on our annotated test set. None is calibrated yet, so no band is shown.
What counts as a claim ›How we measure confidence ›How we check this ›
Are you an author, or do you see a problem with this page? Request a review
