

The DOI matches its Crossref record; 41 of the 41 references it cites were found in a registry or an index; none of the 18 sources its claims cite is checked for support yet.
RAC2 gain-of-function variants causing inborn error of immunity drive NLRP3 inflammasome activation
Open accessAbstract
A growing number of patients presenting severe combined immunodeficiencies attributed to monoallelic RAC2 variants have been identified. The expression of the RHO GTPase RAC2 is restricted to the hematopoietic lineage. RAC2 variants have been described to cause immunodeficiencies associated with high frequency of infection, leukopenia, and autoinflammatory features. Here, we show that specific RAC2 activating mutations induce the NLRP3 inflammasome activation leading to the secretion of IL-1β and IL-18 from macrophages. This activation depends on the activation state of the RAC2 variant and is mediated by the downstream kinase PAK1. Inhibiting the RAC2–PAK1–NLRP3 inflammasome pathway might be considered as a potential treatment for these patients.
Overview
CoChat Summary
Written by AI from the paper’s full text.
TL;DR
RAC2 gain-of-function variants associated with inborn errors of immunity activate the NLRP3 inflammasome through a RAC2–PAK1–NLRP3 signaling axis. This activation is detectable in patient circulating myeloid cells and primary macrophages and is blocked by PAK, NLRP3, or caspase inhibitors.
Key findings
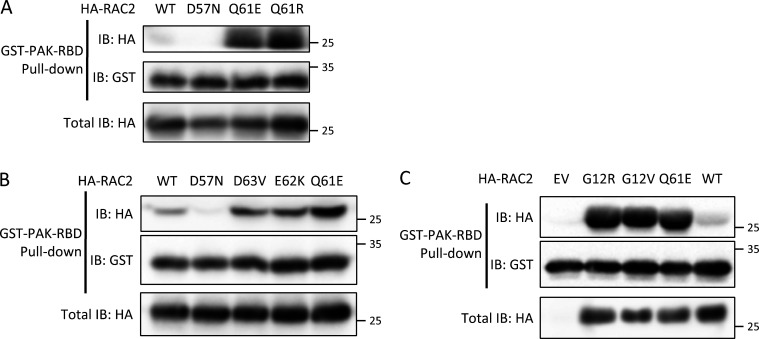
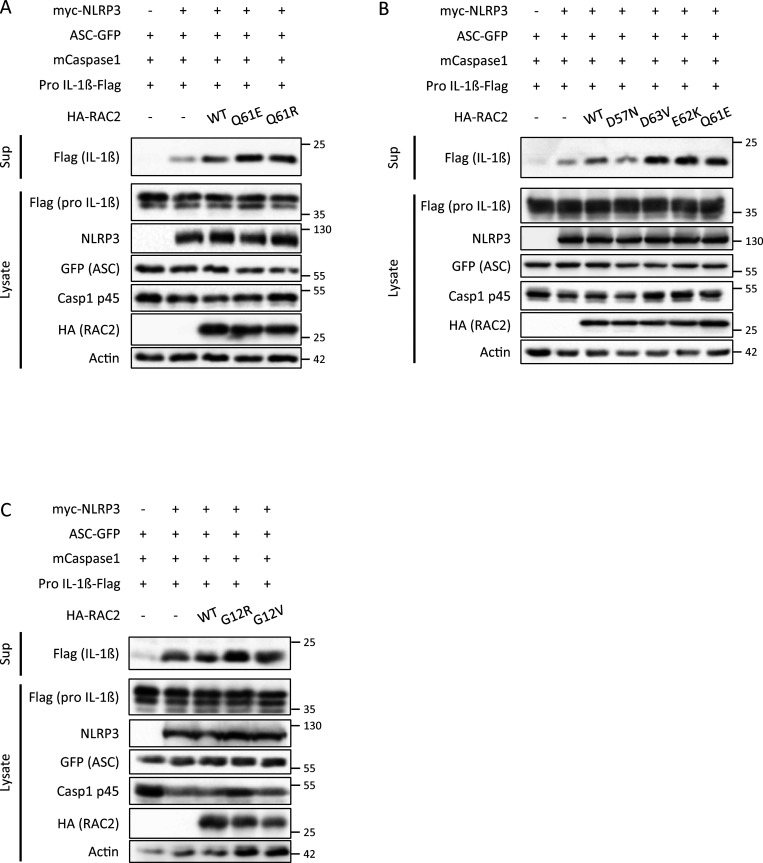
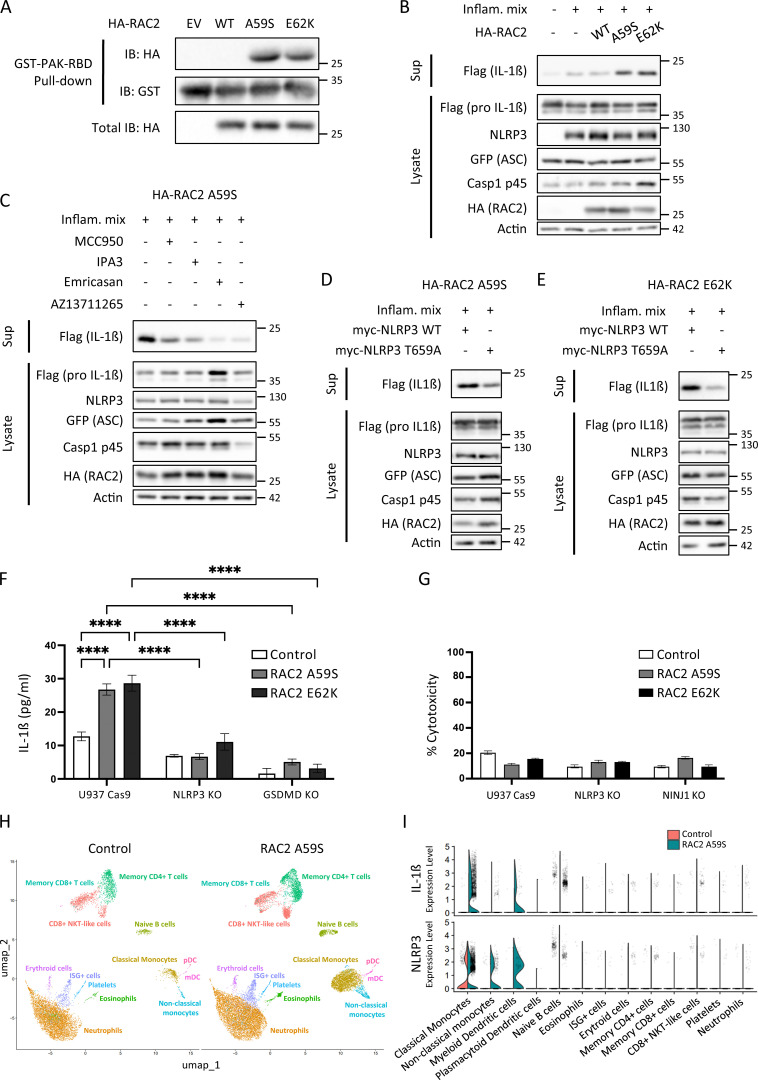
- RAC2 Q61R, E62K, D63V, G12R, G12V, and A59S bound GST–PAK–RBD and triggered pro-IL-1β cleavage/IL-1β secretion in an HEK293T NLRP3 reconstitution system; the inhibitory D57N variant behaved like empty vector and lower than WT RAC2.
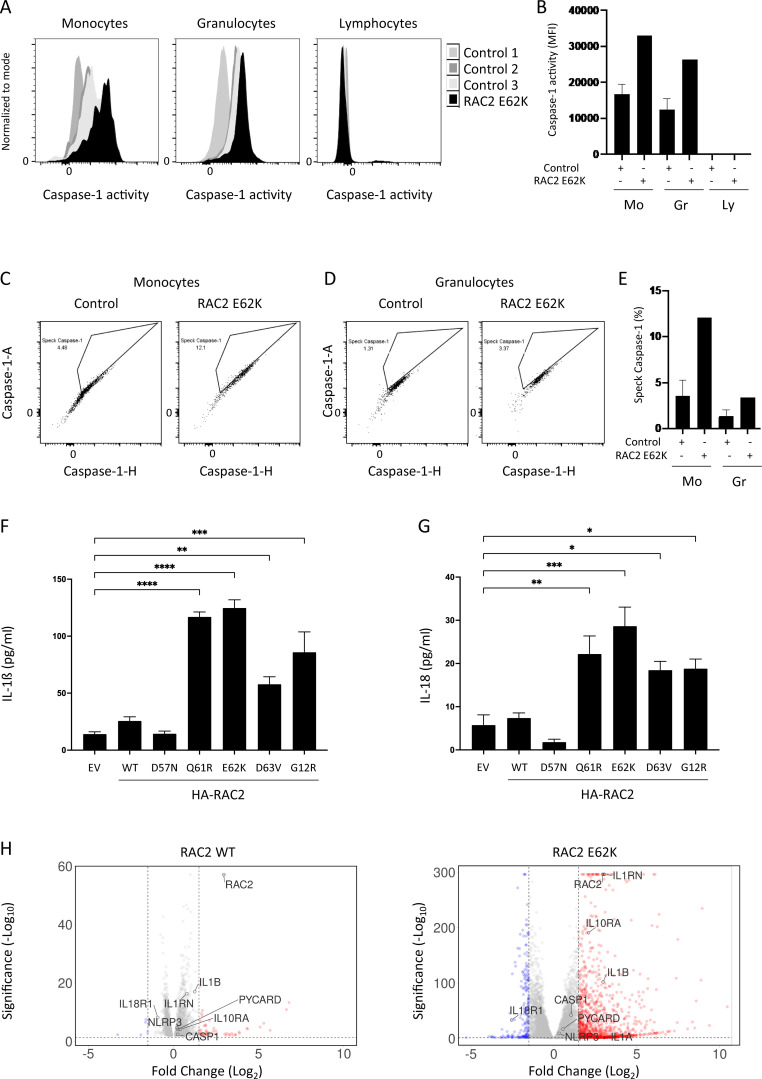
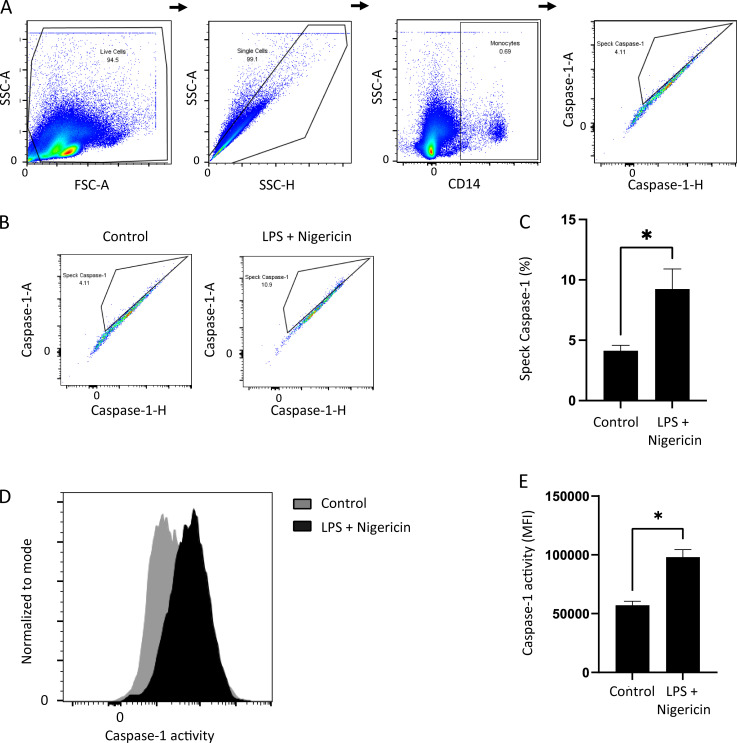
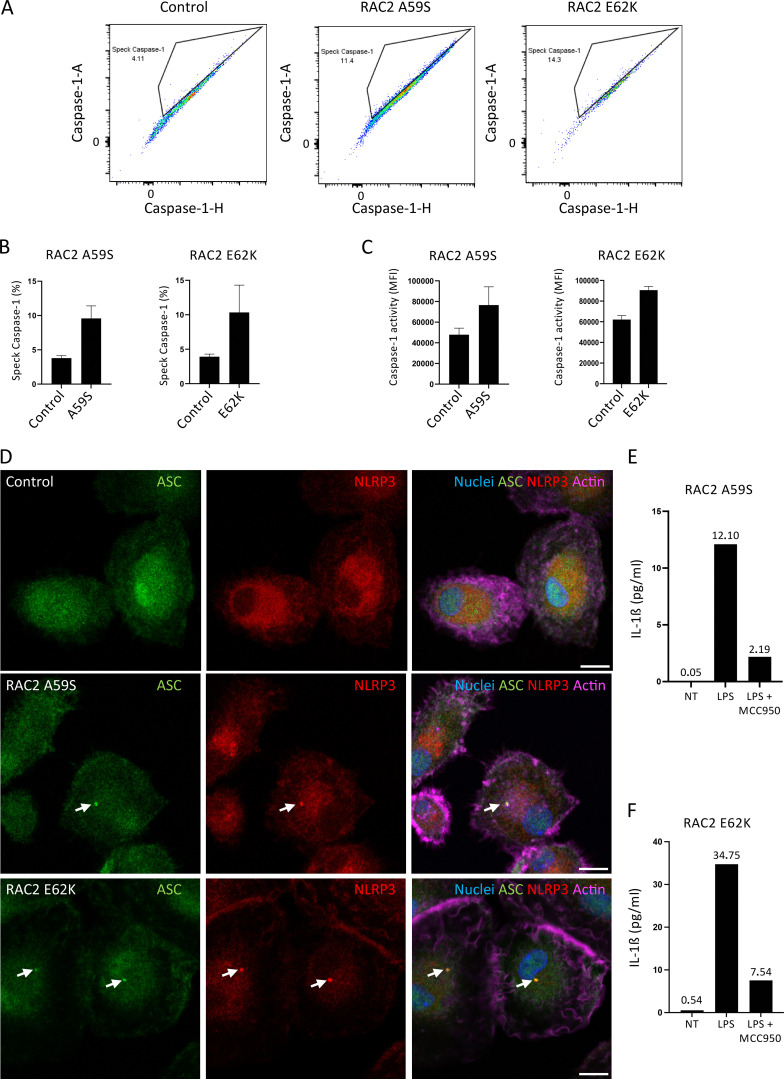
- In a RAC2 E62K patient, caspase-1 activity was increased in monocytes and granulocytes but not lymphocytes; up to 12% of monocytes had caspase-1 specks versus a mean of 4% in controls. In RAC2 A59S and E62K patient monocytes, 11.4% and 14.3% of cells had FAM–YVAD–FLICA-positive specks, respectively, versus 4% in controls.
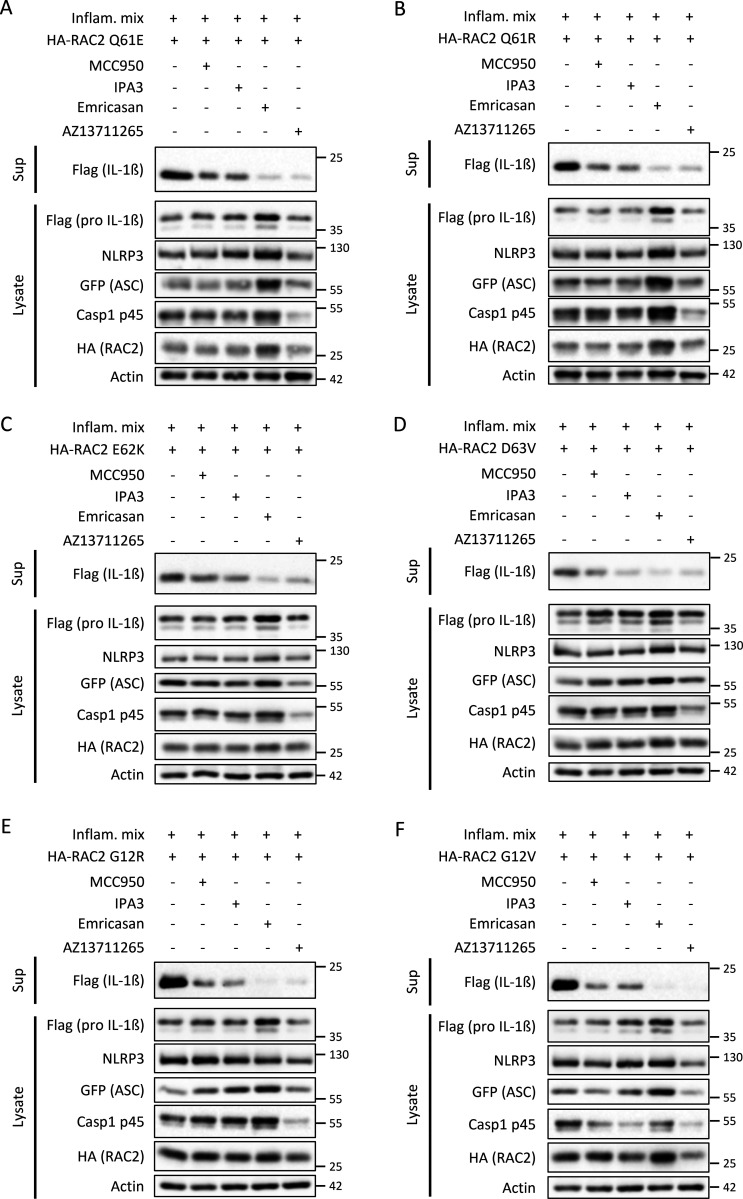
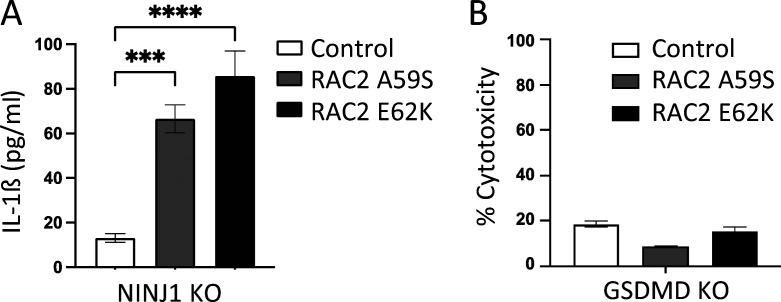
- IPA3, AZ13711265, MCC950, and Emricasan blocked IL-1β secretion triggered by gain-of-function RAC2 variants Q61R, E62K, D63V, and G12R. NLRP3 T659A impaired IL-1β secretion, GSDMD knockout impaired it, NINJ1 knockout did not affect it, and no significant cell death was measured.
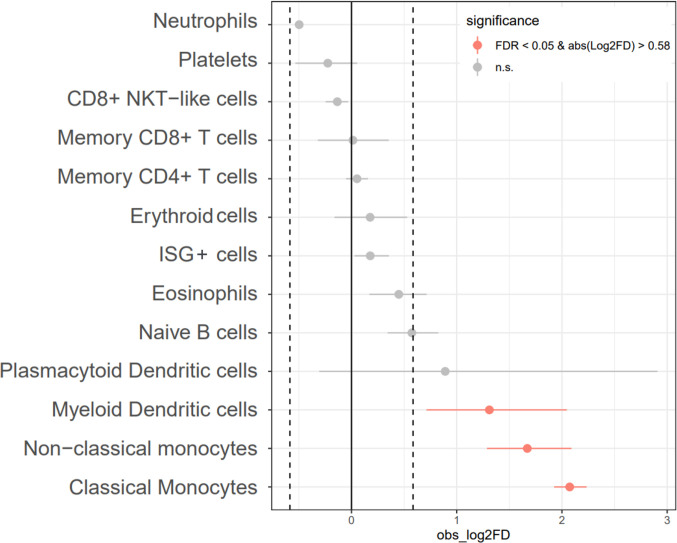
- Primary human macrophages overexpressing gain-of-function variants secreted higher IL-1β and IL-18; MOLM-13 cells expressing RAC2 E62K showed an increased IL-1β cytokine-related gene signature; single-cell RNAseq of a RAC2 A59S patient showed increased NLRP3 and IL-1β expression in monocytes and myeloid dendritic cells.
Methods
- Mechanistic assays used HEK293T cells transfected with NLRP3 inflammasome components (myc-NLRP3, ASC-GFP, caspase-1, pro-IL-1β-Flag) plus HA-RAC2 WT or mutants, GST–PAK–RBD pull-down, immunoblotting, and pathway inhibitors.
- Patient and primary-cell assays used whole blood/PBMCs from healthy donors and RAC2 E62K or A59S patients, flow cytometry with FAM–YVAD–FLICA for caspase-1 activity/specks, monocyte-derived macrophages transduced with lentiviral RAC2 variants and stimulated with LPS, ELISA for IL-1β/IL-18, immunofluorescence for ASC/NLRP3, U937 knockout lines, and LDH release.
- Transcriptomic analyses included bulk RNAseq of MOLM-13 cells transduced with RAC2 WT or E62K versus empty vector, and single-cell RNAseq of whole blood from one RAC2 A59S patient and a control (8,078 control cells, 14,524 patient cells).
Limitations
- The paper states that RAC2 variants are rare, mostly found in young children with low leukocyte counts, which limits more precise immunophenotyping with pyroptotic cell death markers; it also states that further studies are needed to determine the contribution of the inflammasome pathway to RAC2 gain-of-function disease and whether NLRP3 is a treatment target.
- Evident from the text: key patient data come from very few individuals (one RAC2 E62K and one RAC2 A59S patient in central assays), while many mechanistic conclusions rely on overexpression or reconstitution systems rather than in vivo models of RAC2-mutant disease.
Model-written summary. Check it against the paper before relying on it.
Integrity signals
Registry
Cites
Statistics
Figures
Verification
Claims the paper makes
38 Own result · 20 Own method · 7 Own interpretation · 6 No full text of the sources · 4 Check pending · 2 Not checked yet · 1 Sources not found
A result the paper reports from its own data — it cites no other source for it, so there is none to check. The quote shows it is in the paper.
In the paper
“This study shows NLRP3 inflammasome activation in circulating myeloid cells by human RAC2 gain-of-function variants that are linked to rare immune disorders.”
§ RAC2 gain-of-function variants causing inborn error of immunity drive NLRP3 inflammasome activation > Abstract
boostedstates a cause- Asserted: passes — The authors put it forward as true.
- Checkable: passes — It can be checked against evidence.
- Load-bearing: passes — The paper’s conclusions depend on it.
- Based: passes — The paper gives a reason why it holds.
A result the paper reports from its own data — it cites no other source for it, so there is none to check. The quote shows it is in the paper.
In the paper
“Consistent with our previous experiments, this newly revealed patient’s RAC2 variant showed gain-of-function effects, and the different tested inhibitors of the RAC–PAK–NLRP3–Caspase-1 pathway blocked IL-1β secretion (Fig. 5 C).”
§ RAC2 gain-of-function variants causing inborn error of immunity drive NLRP3 inflammasome activation > Results > Identification of a RAC2 A59S as a gain-of-function variant activating NLRP3
plainstates a causeSingle case- Asserted: passes — The authors put it forward as true.
- Checkable: passes — It can be checked against evidence.
- Load-bearing: passes — The paper’s conclusions depend on it.
- Based: passes — The paper gives a reason why it holds.
- Rests on an assumption not shown here.
A result the paper reports from its own data — it cites no other source for it, so there is none to check. The quote shows it is in the paper.
In the paper
“Here, we show the involvement of GSDMD in the RAC2 A59S and RAC2 E62K triggered IL-1β secretion in U937 monocytic cells, which is not associated with cell death.”
§ RAC2 gain-of-function variants causing inborn error of immunity drive NLRP3 inflammasome activation > Discussion > RAC2 gain-of-function variant–triggered NLRP3 inflammasome activation: Inflammation and cell death?
boostedstates an association- Asserted: passes — The authors put it forward as true.
- Checkable: passes — It can be checked against evidence.
- Load-bearing: passes — The paper’s conclusions depend on it.
- Based: passes — The paper gives a reason why it holds.
A result the paper reports from its own data — it cites no other source for it, so there is none to check. The quote shows it is in the paper.
In the paper
“This Nigericin-triggered Caspase-1 speck formation was correlated with an increased FAM–YVAD–FLICA MFI in Nigericin-treated monocytes (Fig. S1, D and E).”
§ RAC2 gain-of-function variants causing inborn error of immunity drive NLRP3 inflammasome activation > Results > Activating RAC2 mutations triggers inflammasome activation in circulating myeloid cells of patients and human primary macrophages
plainstates an association- Asserted: passes — The authors put it forward as true.
- Checkable: passes — It can be checked against evidence.
- Load-bearing: unclear — It is unclear whether the paper’s conclusions depend on it.
- Based: passes — The paper gives a reason why it holds.
A result the paper reports from its own data — it cites no other source for it, so there is none to check. The quote shows it is in the paper.
In the paper
“Monocytes and macrophages isolated from patients harboring the RAC2 E62K or RAC2 A59S mutations have an abnormal NLRP3 inflammasome activation.”
- Also stated in: § Discussion · boosted
“Here, we show that several RAC2 gain-of-function mutations trigger NLRP3 inflammasome activation in a human cell reconstitution system as well as in monocytes and macrophages isolated from RAC2 A59S or RAC2 E62K patients.”
§ RAC2 gain-of-function variants causing inborn error of immunity drive NLRP3 inflammasome activation > Results > Identification of a RAC2 A59S as a gain-of-function variant activating NLRP3
boostedstates an association- Asserted: passes — The authors put it forward as true.
- Checkable: passes — It can be checked against evidence.
- Load-bearing: passes — The paper’s conclusions depend on it.
- Based: passes — The paper gives a reason why it holds.
- Also stated in: § Discussion · boosted
- It may state two separate claims as one. 20
- The quote only partly states this claim. 11
- Probably not a substantial claim. 21
Create a free account to see these claims.
Create a free account to see these assumptions.
36 more claims
Create a free account to see all 78 claims and to verify the 7 references still open.
Self-check
Percentages, sums and reported differences re-computed from the paper’s own numbers.
Each contradiction between two passages listed here was confirmed by an independent check.
Rated minor: it would not touch a result — a value no result rests on, a p-value that stays on the same side of the significance level, or a conflict that is clerical, resolved elsewhere in the paper, or outside its own findings.
In the paper
§ RAC2 gain-of-function variants causing inborn error of immunity drive NLRP3 inflammasome activation > Results > Identification of a RAC2 A59S as a gain-of-function variant activating NLRP3
“The Caspase-1 activation was also visualized by measuring the FAM–YVAD–FLICA MFI (Fig. 6 C).”
§ RAC2 gain-of-function variants causing inborn error of immunity drive NLRP3 inflammasome activation > Results > Identification of a RAC2 A59S as a gain-of-function variant activating NLRP3
“(B and C) Graphic representation of percentage of cells with Caspase-1 specks.”
Rated minor: it would not touch a result — a value no result rests on, a p-value that stays on the same side of the significance level, or a conflict that is clerical, resolved elsewhere in the paper, or outside its own findings.
In the paper
§ RAC2 gain-of-function variants causing inborn error of immunity drive NLRP3 inflammasome activation > Results > Activating human RAC2 mutations activates the NLRP3 inflammasome
“We measured similar binding strength of PAK for both Q61E and Q61R variants, but not for the RAC2 D57N, a variant associated with a RAC2 inhibitory effect found in patients suffering from immunodeficiency (Fig. 1 A).”
§ RAC2 gain-of-function variants causing inborn error of immunity drive NLRP3 inflammasome activation > Results > Activating human RAC2 mutations activates the NLRP3 inflammasome
“(B) D57N, D63V, and E62K mutations were compared with WT and the constitutively active mutant RAC2 Q61E.”
Citations
Cites
Etienne-Manneville, S., & Hall, A. (2002) · Nature · doi:10.1038/nature01148 · Cited by 4,201
The GTPase superfamily: conserved structure and molecular mechanism
Bourne, H. R., Sanders, D. A., & McCormick, F. (1991) · Nature · doi:10.1038/349117a0 · Cited by 3,392
Burridge, K., & Wennerberg, K. (2004) · Cell · doi:10.1016/s0092-8674(04)00003-0 · Cited by 1,578
Rho GTPases and actin dynamics in membrane protrusions and vesicle trafficking
Ridley, A. J. (2006) · Trends in Cell Biology · doi:10.1016/j.tcb.2006.08.006 · Cited by 1,225
NINJ1 mediates plasma membrane rupture during lytic cell death
Kayagaki, N., Kornfeld, O. S., Lee, B. L., Stowe, I. B., O’Rourke, K., Li, Q., Sandoval, W., Yan, D., Kang, J., Xu, M., et al. (2021) · Nature · doi:10.1038/s41586-021-03218-7 · Cited by 857
Roberts, A. W., Kim, C., Zhen, L., Lowe, J. B., Kapur, R., Petryniak, B., Spaetti, A., Pollock, J. D., Borneo, J. B., Bradford, G. B., et al. (1999) · Immunity · doi:10.1016/s1074-7613(00)80019-9 · Cited by 556
Human neutrophil immunodeficiency syndrome is associated with an inhibitory Rac2 mutation
Ambruso, D. R., Knall, C., Abell, A. N., Panepinto, J., Kurkchubasche, A., Thurman, G., Gonzalez-Aller, C., Hiester, A., deBoer, M., Harbeck, R. J., et al. (2000) · Proceedings of the National Academy of Sciences · doi:10.1073/pnas.080074897 · Cited by 407
Regulation of innate immunity by Rho GTPases
Bokoch, G. (2005) · Trends in Cell Biology · doi:10.1016/j.tcb.2005.01.002 · Cited by 306
Mechanistic insights from inflammasome structures
Fu, J., Schroder, K., & Wu, H. (2024) · Nature reviews. Immunology · doi:10.1038/s41577-024-00995-w · Cited by 223
Lagrange, B., Benaoudia, S., Wallet, P., Magnotti, F., Provost, A., Michal, F., Martin, A., Lorenzo, F. D., Py, B. F., Molinaro, A., et al. (2018) · Nature Communications · doi:10.1038/s41467-017-02682-y · Cited by 210
Girard-Gagnepain, A., Amirache, F., Costa, C., Lévy, C., Frecha, C. A., Fusil, F., Négre, D., Lavillette, D., Cosset, F., & Verhoeyen, E. (2014) · Blood · doi:10.1182/blood-2014-02-558163 · Cited by 195
Self-citationCaye, A., Strullu, M., Guidez, F., Cassinat, B., Gazal, S., Fenneteau, O., Lainey, E., Nouri, K., Nakhaei-Rad, S., Dvorsky, R., et al. (2015) · Nature Genetics · doi:10.1038/ng.3420 · Cited by 189
García–Tsao, G., Bosch, J., Kayali, Z., Harrison, S. A., Abdelmalek, M. F., Lawitz, E., Satapathy, S. K., Ghabril, M., Shiffman, M. L., Younes, Z. H., et al. (2019) · Journal of Hepatology · doi:10.1016/j.jhep.2019.12.010 · Cited by 158
Kim, C., & Dinauer, M. C. (2001) · The Journal of Immunology · doi:10.4049/jimmunol.166.2.1223 · Cited by 151
Bacterial virulence factors targeting Rho GTPases: Parasitism or symbiosis?
Boquet, P., & Lemichez, E. (2003) · Trends in Cell Biology · doi:10.1016/s0962-8924(03)00037-0 · Cited by 149
Deficiency of Small Gtpase Rac2 Affects T Cell Activation
Yu, H. J., Leitenberg, D., Li, B., & Flavell, R. A. (2001) · The Journal of Experimental Medicine · doi:10.1084/jem.194.7.915 · Cited by 127
Yang, F.-C., Kapur, R., King, A. J., Tao, W., Kim, C., Borneo, J., Breese, R., Marshall, M., Dinauer, M. C., & Williams, D. A. (2000) · Immunity · doi:10.1016/s1074-7613(00)80207-1 · Cited by 126
Gasdermins: making pores for pyroptosis
Shao, F. (2021) · Nature reviews. Immunology · doi:10.1038/s41577-021-00602-2 · Cited by 121
Natori, S., Higuchi, H., Contreras, P., & Gores, G. J. (2003) · Liver Transplantation · doi:10.1053/jlts.2003.50019 · Cited by 111
Alkhairy, O. K., Rezaei, N., Graham, R. R., Abolhassani, H., Borte, S., Hultenby, K., Wu, C., Aghamohammadi, A., Williams, D. A., Behrens, T. W., et al. (2015) · Journal of Allergy and Clinical Immunology · doi:10.1016/j.jaci.2014.10.039 · Cited by 108
Berger, G., Durand, S., Goujon, C., Nguyen, X.-N., Cordeil, S., Darlix, J., & Cimarelli, A. (2011) · Nature Protocols · doi:10.1038/nprot.2011.327 · Cited by 105
Boyer, L., Magoc, L., Dejardin, S., Cappillino, M., Paquette, N., Hinault, C., Charriere, G. M., Ip, W. K. E., Fracchia, S., Hennessy, E., et al. (2011) · Immunity · doi:10.1016/j.immuni.2011.08.015 · Cited by 103
Self-citationAccetta, D., Syverson, G., Bonacci, B., Reddy, S., Bengtson, C., Surfus, J., Harbeck, R., Huttenlocher, A., Grossman, W., Routes, J., et al. (2011) · Journal of Allergy and Clinical Immunology · doi:10.1016/j.jaci.2010.10.013 · Cited by 95
Dominant activating RAC2 mutation with lymphopenia, immunodeficiency, and cytoskeletal defects
Hsu, A. P., Donkó, A., Arrington, M. E., Swamydas, M., Fink, D., Das, A., Escobedo, O., Bonagura, V., Szabolcs, P., Steinberg, H. N., et al. (2019) · Blood · doi:10.1182/blood-2018-11-886028 · Cited by 92
Paerewijck, O., & Lamkanfi, M. (2022) · Molecular Aspects of Medicine · doi:10.1016/j.mam.2022.101100 · Cited by 86
Dufies, O., Doye, A., Courjon, J., Torre, C., Michel, G., Loubatier, C., Jacquel, A., Chaintreuil, P., Majoor, A., Guinamard, R., et al. (2021) · Nature Microbiology · doi:10.1038/s41564-020-00832-5 · Cited by 84
Self-citationHematopoietic-specific Rho GTPases Rac2 and RhoH and human blood disorders
Troeger, A., & Williams, D. A. (2013) · Experimental Cell Research · doi:10.1016/j.yexcr.2013.07.002 · Cited by 73
Rac2 Regulation of Phospholipase C-β2 Activity and Mode of Membrane Interactions in Intact Cells
Illenberger, D., Walliser, C., Strobel, J., Gutman, O., Niv, H., Gaidzik, V. I., Kloog, Y., Gierschik, P., & Henis, Y. I. (2003) · Journal of Biological Chemistry · doi:10.1074/jbc.m211971200 · Cited by 72
RAC2 and primary human immune deficiencies
Lougaris, V., Baronio, M., Gazzurelli, L., Benvenuto, A., & Plebani, A. (2020) · Journal of Leukocyte Biology · doi:10.1002/jlb.5mr0520-194rr · Cited by 59
Diabate, M., Munro, P. M., Garcia, E., Jacquel, A., Michel, G., Obba, S., Gonçalvès, D., Luci, C., Marchetti, S., Demon, D., et al. (2015) · PLoS Pathogens · doi:10.1371/journal.ppat.1004732 · Cited by 47
Self-citationTrapping of CDC42 C-terminal variants in the Golgi drives pyrin inflammasome hyperactivation
Nishitani‐Isa, M., Mukai, K., Honda, Y., Nihira, H., Tanaka, T., Shibata, H., Kodama, K., Hiejima, E., Izawa, K., Kawasaki, Y., et al. (2022) · The Journal of Experimental Medicine · doi:10.1084/jem.20211889 · Cited by 45
Reconstruction of the Mouse Inflammasome System in HEK293T Cells
Shi, H., Murray, A. R., & Beutler, B. (2016) · BIO-PROTOCOL · doi:10.21769/bioprotoc.1986 · Cited by 41
Assessment of Inflammasome Formation by Flow Cytometry
Sester, D. P., Zamoshnikova, A., Thygesen, S. J., Vajjhala, P. R., Cridland, S. O., Schroder, K., & Stacey, K. J. (2016) · Current Protocols in Immunology · doi:10.1002/cpim.13 · Cited by 38
Lagresle-Peyrou, C., Olichon, A., Sadek, H., Roche, P., Tardy, C., Silva, C. D., Garrigue, A., Fischer, A., Moshous, D., Collette, Y., et al. (2020) · Haematologica · doi:10.3324/haematol.2019.230250 · Cited by 35
Self-citationCDC42 regulates PYRIN inflammasome assembly
Spel, L., Zaffalon, L., Hou, C., Nganko, N., Chapuis, C., & Martinon, F. (2022) · Cell Reports · doi:10.1016/j.celrep.2022.111636 · Cited by 32
Clinical and functional spectrum of RAC2-related immunodeficiency
Donkó, Á., Sharapova, S. O., Kabat, J., Ganesan, S., Hauck, F. H., Bergerson, J. R. E., Marois, L., Abbott, J., Moshous, D., Williams, K. W., et al. (2024) · Blood · doi:10.1182/blood.2023022098 · Cited by 32
Self-citationRhoGTPases and inflammasomes: Guardians of effector-triggered immunity
Dufies, O., & Boyer, L. (2021) · PLoS Pathogens · doi:10.1371/journal.ppat.1009504 · Cited by 25
Self-citationThe molecular basis for immune dysregulation by the hyperactivated E62K mutant of the GTPase RAC2
Arrington, M. E., Temple, B., Schaefer, A., & Campbell, S. L. (2020) · Journal of Biological Chemistry · doi:10.1074/jbc.ra120.012915 · Cited by 19
Hsu, A. P. (2023) · Clinical & Experimental Immunology · doi:10.1093/cei/uxad001 · Cited by 19
A novel RAC2 variant presenting as severe combined immunodeficiency
Stern, H., Donkó, A., Shapiro, T., Hsu, A. P., Leto, T. L., Holland, S. M., & Andreae, D. A. (2021) · Journal of Clinical Immunology · doi:10.1007/s10875-020-00915-2 · Cited by 15
Batistic, L., & Boyer, L. (2024) · DRYAD · doi:10.5061/dryad.p8cz8w9zx · Cited by 1
Self-citation
Cited by
Ren, H., Wei, G., Kong, Z., Zhang, M., Li, Y., Liu, S., & Guo, Y. (2025) · Journal of Orthopaedic Surgery and Research · doi:10.1186/s13018-025-05526-4 · Cited by 13
Immunoactinopathies revisited: understanding clinical manifestations and biological pathways
Hiensch, F., Dupré, L., & Salzer, E. (2025) · Blood · doi:10.1182/blood.2024026763 · Cited by 10
Epitranscriptomic mechanisms and implications of RNA m 5 C modification in cancer
Mao, Z., Tian, Y., Wu, L., & Zhang, Y. (2025) · Theranostics · doi:10.7150/thno.112332 · Cited by 10
Li, X., Guo, Y., Deng, X., Jiao, Y., Hao, H., Dong, Q., Sun, H., & Han, S. (2025) · Journal of Ethnopharmacology · doi:10.1016/j.jep.2025.119757 · Cited by 8
Doye, A., Chaintreuil, P., Verhoeyen, E., & Boyer, L. (2025) · médecine/sciences · doi:10.1051/medsci/2025008 · Cited by 1
Self-citation
Metadata
- Authors
- Doye, A., Chaintreuil, P., Lagresle-Peyrou, C., Batistic, L., Marion, V., Munro, P., Loubatier, C., Chirara, R., Sorel, N., Bessot, B., Bronnec, P., Contenti, J., Courjon, J., Giordanengo, V., Jacquel, A., Barbry, P., Couralet, M., Aladjidi, N., Fischer, A., Cavazzana, M., Mallebranche, C., Visvikis, O., Kracker, S., Moshous, D., Verhoeyen, E., & Boyer, L.
- Affiliations
- Inserm (FR)
- Université Paris Cité 2 , Paris, France
- Université Côte d’Azur, INSERM, C3M 1 , Nice, France
- Lyon 1 Université (FR)
- Centre National de la Recherche Scientifique (FR)
- Hôpital Necker-Enfants Malades (FR)
- Corresponding author
- Boyer, Laurent
- ORCID
- Doye, Anne
- Chaintreuil, Paul
- Lagresle-Peyrou, Chantal
- Batistic, Ludovic
- Marion, Valentine
- Munro, Patrick
- Loubatier, Celine
- Chirara, Rayana
- Sorel, Nataël
- Bessot, Boris
- Bronnec, Pauline
- Contenti, Julie
- Courjon, Johan
- Giordanengo, Valerie
- Jacquel, Arnaud
- Barbry, Pascal
- Couralet, Marie
- Aladjidi, Nathalie
- Fischer, Alain
- Cavazzana, Marina
- Mallebranche, Coralie
- Visvikis, Orane
- Kracker, Sven
- Moshous, Despina
- Verhoeyen, Els
- Boyer, Laurent
- Venue
- Journal of Experimental Medicine
- Publisher
- Rockefeller University Press
- Published
- 2024-08-30
- Volume
- 221
- Issue
- 10
- ISSN
- 0022-1007 (ISSN-L)
- 1540-9538
- PMC
- PMC11363864
- OpenAlex
- W4402049585
- Semantic Scholar
- 233439add4bc4a2d0b640c5e0f5b069af36ef567
- Cited by
- 12
- References
- 41
- Citations by year
- 2026: 6 · 2025: 6
- FWCI
- 1.33
- Type
- journal article
- Language
- en
- Open access
- hybrid
- doi.org
- Licence
- Locations
- The Journal of Experimental Medicine (publishedVersion, cc-by-nc-sa)
- PubMed Central (publishedVersion, cc-by-nc-sa)
- PubMed (publishedVersion)
- HAL (submittedVersion)
- Funders
- Fondation pour la Recherche Médicale (EQU202403018053)
- Agence Nationale de la Recherche (ANR-17-CE15-0001, ANR-22-CE15-0032, ANR-22-CE14-0003, ANR-11-LABX-0028-01, ANR-15-IDEX-01, ANR-10-INBS-09, ANR-19-P3IA-0002, ANR-23-IAHU-0007, ANR-10-IAHU-01, ANR-19-CE17-0012, ANR-21-CE17-0046, ANR-PRTS 2013)
- E-Rare Joint Transnational Call for Proposals 2015 (EuroCID)
- Association pour la Recherche sur le Cancer (RAC15014AAA)
- Université Côte d’Azur
- France Génomique National Infrastructure
- Canceropôle PACA
- Topics
- Life Sciences › Biochemistry, Genetics and Molecular Biology › Molecular Biology › Inflammasome and immune disorders
- Life Sciences › Immunology and Microbiology › Immunology › Immunodeficiency and Autoimmune Disorders
- Life Sciences › Immunology and Microbiology › Immunology › Immune Response and Inflammation
- Keywords
- Rac2, gain-of-function mutations, primary immunodeficiency, severe combined immunodeficiency, NLRP3 inflammasome, PAK1, IL-1β, IL-18, macrophages, autoinflammation, Rho GTPases, hematopoietic lineage
- MeSH terms
- NLR Family, Pyrin Domain-Containing 3 Protein, Gain of Function Mutation, RAC2 GTP-Binding Protein, Animals, Humans, Macrophages, Signal Transduction, Interleukin-18, rac GTP-Binding Proteins, Mice, Interleukin-1beta, p21-Activated Kinases, Inflammasomes
About these checks
Registry, retraction, Cites and statistics results are computed, not judged, with one exception: a printed reference that no index lists is read once by a model before it counts as a citation error. Claims are extracted by a model and kept only when their quote appears verbatim in the text; each cited source is then checked, with a model’s help, for whether it says what the claim relies on. Those verdicts can be wrong — read the claim’s quote and the cited source before relying on one.
A language model drew the claims from the paper on 2026-11-12, under version 3 of the claim definition (model deepseek-v4.1-flash, prompt extract-v3).
A second model labelled each claim on 2026-11-12 (model jev-1.13-20260917, definition revision gold-guideline-v0.2).
Statistics and arithmetic are recomputed, not judged.
Confidence bands are shown only for fields calibrated on our annotated test set. None is calibrated yet, so no band is shown.
What counts as a claim ›How we measure confidence ›How we check this ›
Are you an author, or do you see a problem with this page? Request a review
