

The DOI matches its Crossref record; 58 of the 58 references it cites were found in a registry or an index.
Regulated Exocytosis of GABA-containing Synaptic-like Microvesicles in Pancreatic β-cells
Open accessAbstract
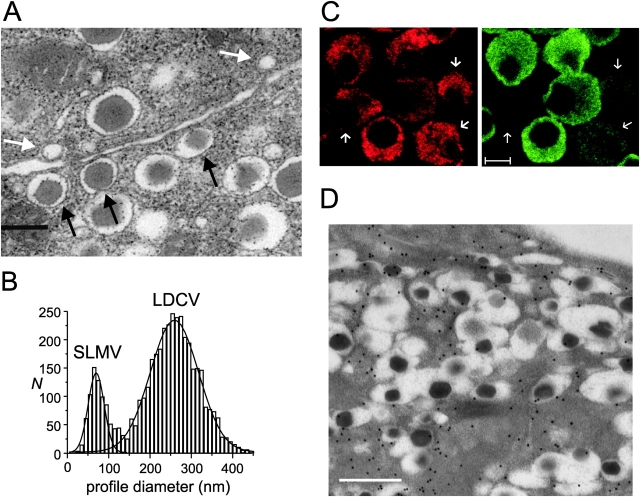
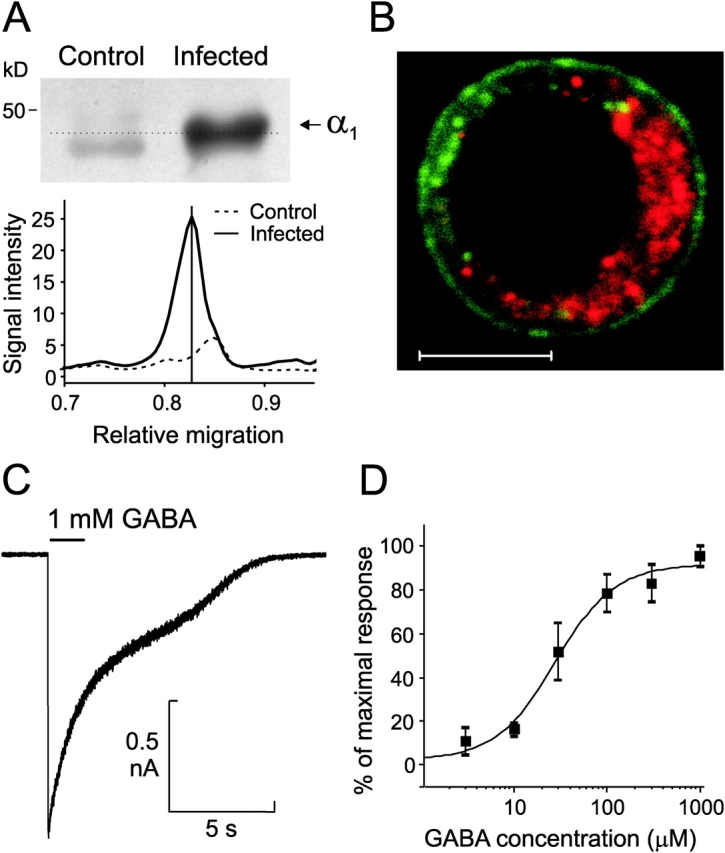
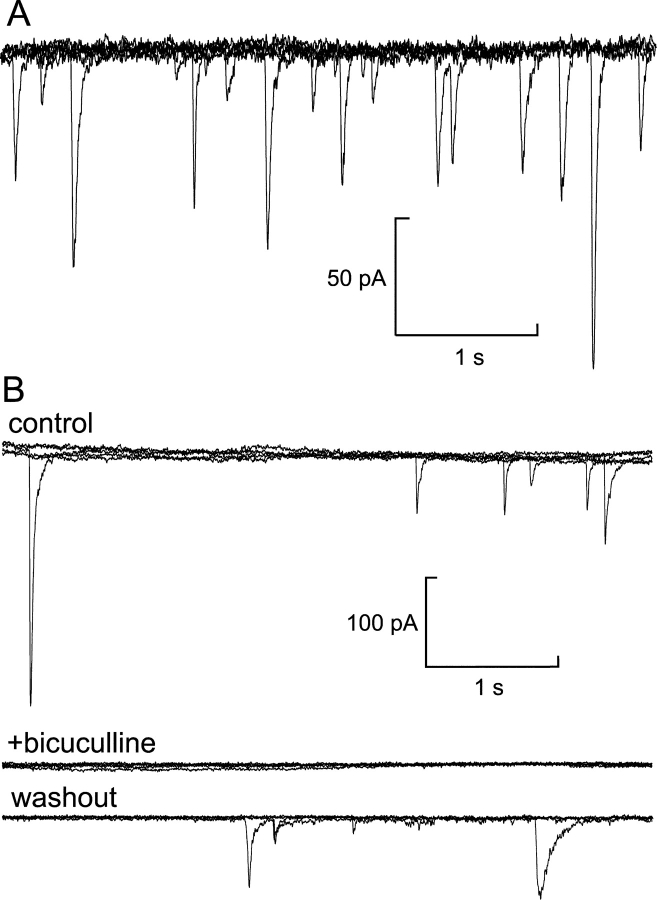
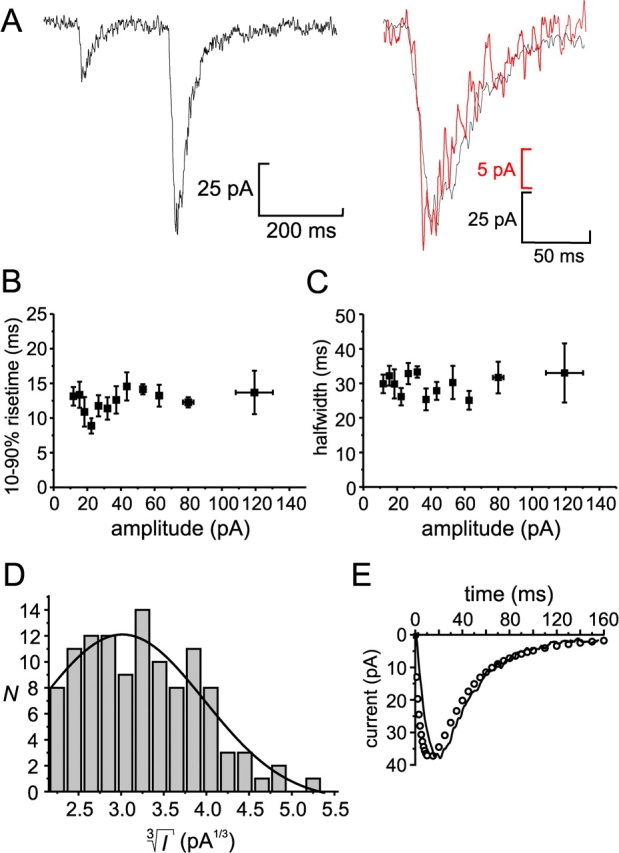
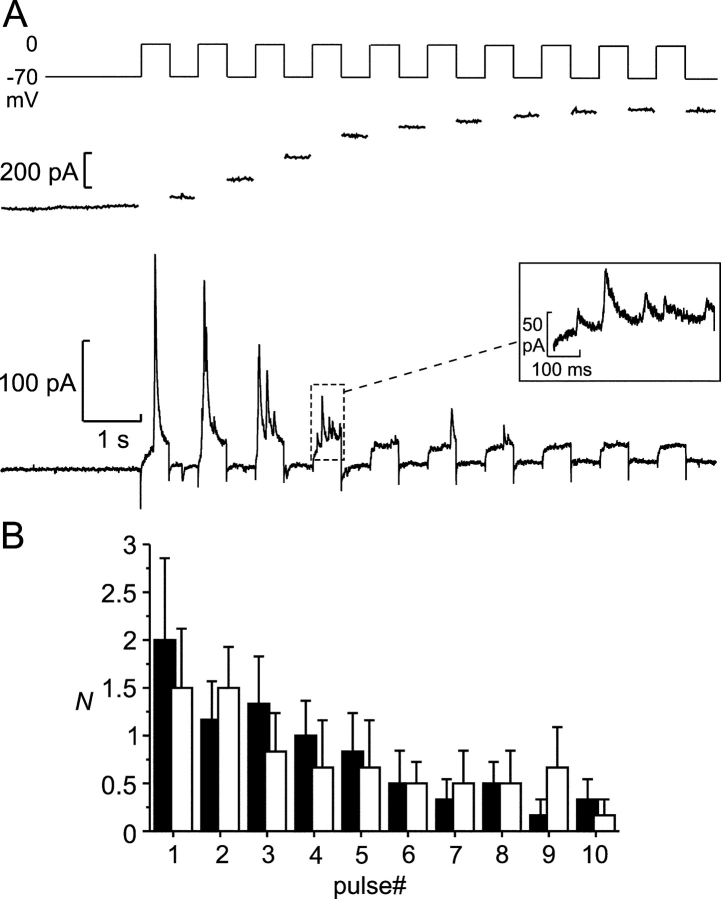
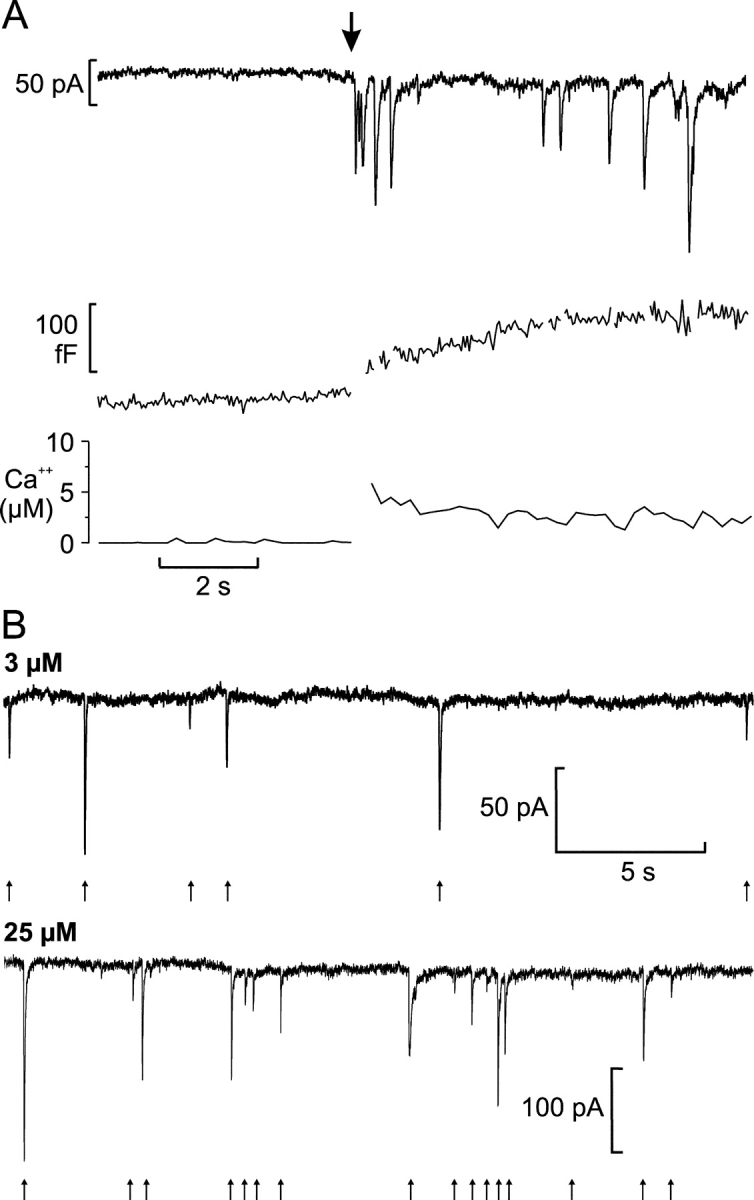
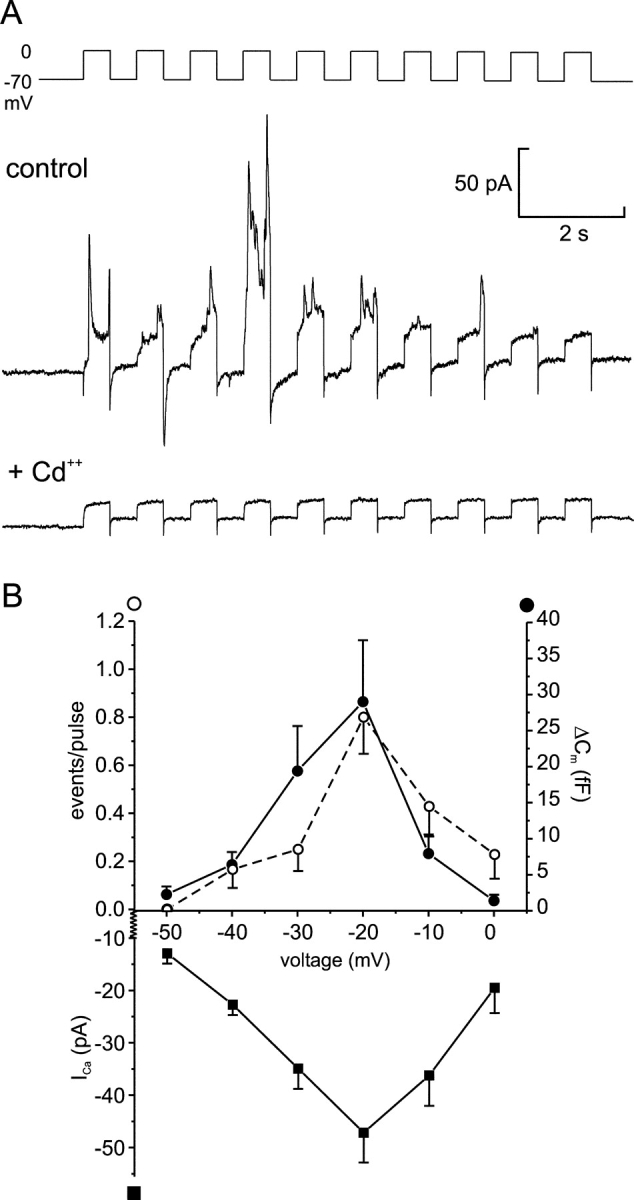
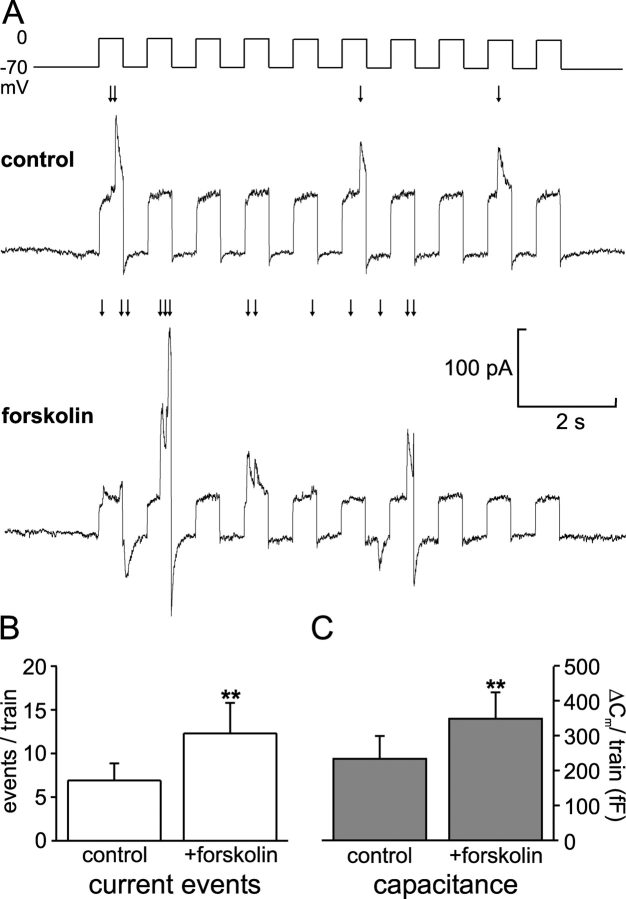
We have explored whether γ-aminobutyric acid (GABA) is released by regulated exocytosis of GABA-containing synaptic-like microvesicles (SLMVs) in insulin-releasing rat pancreatic β-cells. To this end, β-cells were engineered to express GABAA-receptor Cl−-channels at high density using adenoviral infection. Electron microscopy indicated that the average diameter of the SLMVs is 90 nm, that every β-cell contains ∼3,500 such vesicles, and that insulin-containing large dense core vesicles exclude GABA. Quantal release of GABA, seen as rapidly activating and deactivating Cl−-currents, was observed during membrane depolarizations from −70 mV to voltages beyond −40 mV or when Ca2+ was dialysed into the cell interior. Depolarization-evoked GABA release was suppressed when Ca2+ entry was inhibited using Cd2+. Analysis of the kinetics of GABA release revealed that GABA-containing vesicles can be divided into a readily releasable pool and a reserve pool. Simultaneous measurements of GABA release and cell capacitance indicated that exocytosis of SLMVs contributes ∼1% of the capacitance signal. Mathematical analysis of the release events suggests that every SLMV contains 0.36 amol of GABA. We conclude that there are two parallel pathways of exocytosis in pancreatic β-cells and that release of GABA may accordingly be temporally and spatially separated from insulin secretion. This provides a basis for paracrine GABAergic signaling within the islet.
Overview
The claims and statistics of this paper haven’t been checked yet.
Run the check — free, no account needed. It reads the open-access text and checks the sources it cites.
Integrity signals
Registry
Cites
Statistics
Figures
Verification
Claims the paper makes
The claims and statistics of this paper haven’t been checked yet.
Run the check — free, no account needed. It reads the open-access text and checks the sources it cites.
Claims other papers make about this one
Each is checked against this paper’s own text: does it say what the citing paper says it does?
The cited source says what the claim attributes to it.
In the citing paper
“For example, β-cells have been genetically engineered for detection of ATP, GABA or glycine release by adenoviral infection with ATP-activated P2X2 receptors (P2X2R) (484), GABAA receptors (GABAAR) (93) or glycine receptors (GlyR) (744).”
From Pancreatic β-Cell Electrical Activity and Insulin Secretion: Of Mice and Men (2018) · cites this paper as [93]
The check wasn’t confident either way, so it gives no verdict — never disputed.
In the citing paper
“Pancreatic β-cells have an intracellular chloride concentration ([Cl-]i) as high as 35 mM (93). This predicts a Cl- reversal potential (ECl) of -35 mV, and argues that at more negative potentials opening of Cl- channels will result in Cl- influx, and thus membrane depolarization.”
From Pancreatic β-Cell Electrical Activity and Insulin Secretion: Of Mice and Men (2018) · cites this paper as [93]
Experimental — accuracy not yet measuredIn the citing paper
“Consequently, it is unlikely that insulin or Zn 2+ co-secreted from the same beta cell granules or the similarly regulated release of GABA from beta cell microvesicles [36] contribute to inhibition of glucagon secretion by up to 7 mmol/l glucose.”
From Glucose inhibits glucagon secretion by a direct effect on mouse pancreatic alpha cells (2007) · cites this paper as [36]
Self-check
Percentages, sums and reported differences re-computed from the paper’s own numbers.
The self-check needs the paper’s full text.
Citations
Cites
[6] Correction for liquid junction potentials in patch clamp experiments
Neher, E. (1992) · Methods in Enzymology · doi:10.1016/0076-6879(92)07008-c · Cited by 1,132
Pickup, J. C., & Williams, G. H. (1991) · Cited by 573
Chapter 8 Use of Recombinant Adenovirus for Metabolic Engineering of Mammalian Cells
Becker, T. C., Noel, R. J., Coats, W. S., Gómèz‐Foix, A. M., Alam, T., Gerard, R. D., & Newgard, C. B. (1994) · Methods in cell biology · doi:10.1016/s0091-679x(08)60603-2 · Cited by 569
The exocytotic event in chromaffin cells revealed by patch amperometry
Albillos, A., Dernick, G., Horstmann, H., Almers, W., de Toledo, G. Á., & Lindau, M. (1997) · Nature · doi:10.1038/39081 · Cited by 564
Edwards, F. A., Konnerth, A., & Sakmann, B. (1990) · The Journal of Physiology · doi:10.1113/jphysiol.1990.sp018289 · Cited by 535 · cited 2×
“The obtained solution was then imported into the MATLAB workspace (Mathworks, Inc.) and used for fitting to experimental data.”
Glucose-inhibition of glucagon secretion involves activation of GABAA-receptor chloride channels
Rorsman, P., Berggren, P., Bokvist, K. B., Ericson, H., Möhler, H., Östenson, C., & Smith, P. A. (1989) · Nature · doi:10.1038/341233a0 · Cited by 463
Self-citationIslet β-cell secretion determines glucagon release from neighbouring α-cells
Ishihara, H., Maechler, P., Gjinovci, A., Herrera, P. L., & Wollheim, C. B. (2003) · Nature Cell Biology · doi:10.1038/ncb951 · Cited by 391
Reetz, A., Solimena, M., Matteoli, M., Folli, F. B., Takei, K., & Camilli, P. V. D. (1991) · The EMBO Journal · doi:10.1002/j.1460-2075.1991.tb08069.x · Cited by 387
Calcium-independent potentiation of insulin release by cyclic AMP in single β-cells
Ämmälä, C., Ashcroft, F. M., & Rorsman, P. (1993) · Nature · doi:10.1038/363356a0 · Cited by 377
Self-citationThe Cell Physiology of Biphasic Insulin Secretion.
Rorsman, P., Eliasson, L., Renström, E., Gromada, J., Barg, S., & Göpel, S. (2000) · News in Physiological Sciences - NIPS · doi:10.1152/physiologyonline.2000.15.2.72 · Cited by 369
Self-citation
Research works printed but not linked: 4
- 1995, J. Membr. Biol., 148, 193
- 2000, News Physiol. Sci., 15, 72
- 2000, J. Clin. Endocrinol. Metab., 85, 4053
- 1991, Diabetes., 40, 1365
Cited by
Sorted by citations
Pancreatic β-Cell Electrical Activity and Insulin Secretion: Of Mice and Men
Rorsman, P., & Ashcroft, F. M. (2018) · Physiological Reviews · doi:10.1152/physrev.00008.2017 · Cited by 793
Self-citationα-Cells of the Endocrine Pancreas: 35 Years of Research but the Enigma Remains
Gromada, J., Franklin, I., & Wollheim, C. B. (2007) · Endocrine Reviews · doi:10.1210/er.2006-0007 · Cited by 596
Self-citationIntra-islet insulin suppresses glucagon release via GABA-GABAA receptor system
Xu, E., Kumar, M., Zhang, Y., Ju, W., Obata, T., Zhang, N., Liu, S., Wendt, A., Deng, S., Ebina, Y., et al. (2006) · Cell Metabolism · doi:10.1016/j.cmet.2005.11.015 · Cited by 283
Self-citationThe Role of Voltage-Gated Calcium Channels in Pancreatic β-Cell Physiology and Pathophysiology
Yang, S.-N., & Berggren, P. (2006) · Endocrine Reviews · doi:10.1210/er.2005-0888 · Cited by 276
γ-Aminobutyric Acid (GABA) Is an Autocrine Excitatory Transmitter in Human Pancreatic β-Cells
Braun, M., Ramracheya, R., Bengtsson, M., Clark, A., Walker, J. N., Johnson, P. R., & Rorsman, P. (2010) · Diabetes · doi:10.2337/db09-0797 · Cited by 239
Self-citation
Metadata
- Authors
- Braun, M., Wendt, A., Birnir, B., Broman, J., Eliasson, L., Galvanovskis, J., Gromada, J., Mulder, H., & Rorsman, P.
- Affiliations
- Lund University (SE)
- 3Lilly Research Laboratories, Lilly Forschung GmbH, D-22419 Hamburg, Germany
- Corresponding author
- Braun, Matthias
- ORCID
- Venue
- The Journal of General Physiology
- Publisher
- Rockefeller University Press
- Published
- 2004-02-09
- Volume
- 123
- Issue
- 3
- Pages
- 191-204
- ISSN
- 0022-1295 (ISSN-L)
- 1540-7748
- PMC
- PMC2217446
- OpenAlex
- W2128115766
- Cited by
- 130
- References
- 58
- Citations by year
- 2026: 2 · 2025: 4 · 2024: 5 · 2023: 2 · 2022: 4 · 2021: 3 · 2020: 4 · 2019: 6 · 2018: 3 · 2017: 3 · 2016: 3 · 2015: 6 · 2014: 9 · 2013: 12 · 2012: 5
- FWCI
- 11.72
- Type
- journal article
- Language
- en
- Open access
- bronze
- doi.org
- Locations
- The Journal of General Physiology (publishedVersion)
- Europe PMC (PubMed Central) (publishedVersion, cc-by-nc-sa)
- PubMed Central (publishedVersion, cc-by-nc-sa)
- PubMed (publishedVersion)
- Lund University Publications (Lund University) (submittedVersion, other-oa)
- Funders
- Vetenskapsrådet
- Topics
- Health Sciences › Medicine › Endocrinology, Diabetes and Metabolism › Pancreatic function and diabetes
- Life Sciences › Biochemistry, Genetics and Molecular Biology › Cell Biology › Cellular transport and secretion
- Life Sciences › Neuroscience › Cellular and Molecular Neuroscience › Neuroscience and Neuropharmacology Research
- Keywords
- GABA release, regulated exocytosis, synaptic-like microvesicles, pancreatic beta cells, quantal release, readily releasable pool, reserve pool, calcium-dependent exocytosis, islet, insulin secretion, large dense core vesicles
- MeSH terms
- Animals, Dose-Response Relationship, Drug, Exocytosis, gamma-Aminobutyric Acid, Humans, Islets of Langerhans, Receptors, GABA-A, Synaptic Vesicles, Rats, Sprague-Dawley, Rats, Wistar, Calcium Signaling, Rats, GABA-A Receptor Agonists
About these checks
Registry, retraction, Cites and statistics results are computed, not judged, with one exception: a printed reference that no index lists is read once by a model before it counts as a citation error. Claims are extracted by a model and kept only when their quote appears verbatim in the text; each cited source is then checked, with a model’s help, for whether it says what the claim relies on. Those verdicts can be wrong — read the claim’s quote and the cited source before relying on one.
Statistics and arithmetic are recomputed, not judged.
Confidence bands are shown only for fields calibrated on our annotated test set. None is calibrated yet, so no band is shown.
What counts as a claim ›How we measure confidence ›How we check this ›
Are you an author, or do you see a problem with this page? Request a review
