

The DOI matches its Crossref record; 36 of the 37 references it cites were found in a registry or an index.
Negative impacts of climate change on cereal yields: statistical evidence from France
Open accessAbstract
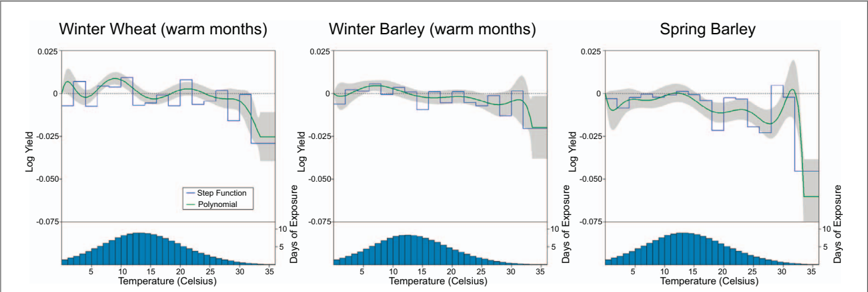
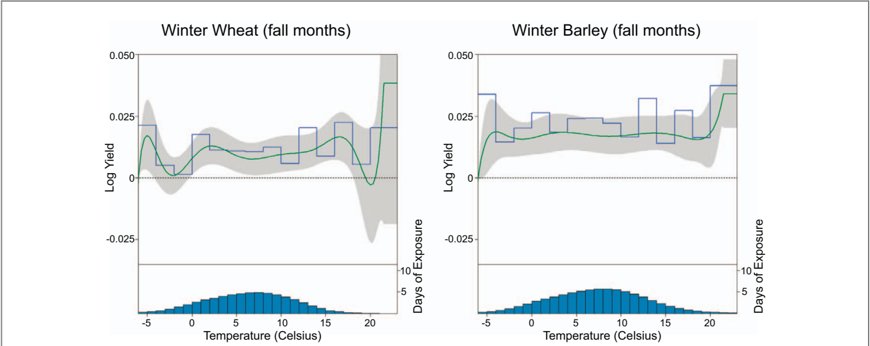
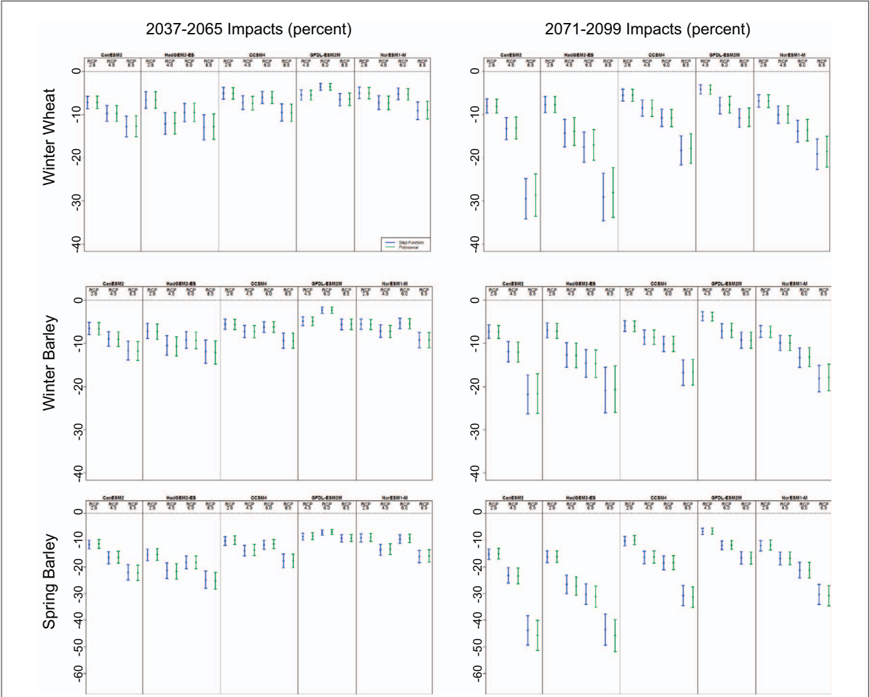
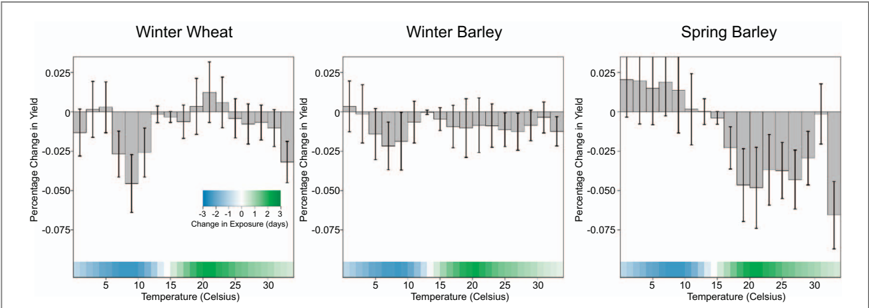
In several world regions, climate change is predicted to negatively affect crop productivity. The recent statistical yield literature emphasizes the importance of flexibly accounting for the distribution of growing-season temperature to better represent the effects of warming on crop yields. We estimate a flexible statistical yield model using a long panel from France to investigate the impacts of temperature and precipitation changes on wheat and barley yields. Winter varieties appear sensitive to extreme cold after planting. All yields respond negatively to an increase in spring–summer temperatures and are a decreasing function of precipitation about historical precipitation levels. Crop yields are predicted to be negatively affected by climate change under a wide range of climate models and emissions scenarios. Under warming scenario RCP8.5 and holding growing areas and technology constant, our model ensemble predicts a 21.0% decline in winter wheat yield, a 17.3% decline in winter barley yield, and a 33.6% decline in spring barley yield by the end of the century. Uncertainty from climate projections dominates uncertainty from the statistical model. Finally, our model predicts that continuing technology trends would counterbalance most of the effects of climate change.
Overview
The claims and statistics of this paper haven’t been checked yet.
Run the check — free, no account needed. It reads the open-access text and checks the sources it cites.
Integrity signals
Registry
Cites
Statistics
Figures
Verification
Claims the paper makes
The claims and statistics of this paper haven’t been checked yet.
Run the check — free, no account needed. It reads the open-access text and checks the sources it cites.
Claims other papers make about this one
Each is checked against this paper’s own text: does it say what the citing paper says it does?
In the citing paper
“Notably, the increasing temperature may lead to contradictory impacts on different production areas.For example, crop yields are expected to increase in some regions such as in Canada and northern Spain, where warmer winters would improve yields (Masud et al., 2018;Bento et al., 2021), whilst other regions such as France and southern Spain are likely to experience increasing agricultural losses (G”
From Genetic resources and precise gene editing for targeted improvement of barley abiotic stress tolerance (2023) · cites this paper as Gammans et al., 2017
Self-check
Percentages, sums and reported differences re-computed from the paper’s own numbers.
The self-check needs the paper’s full text.
Citations
Cites
Climate Trends and Global Crop Production Since 1980
Lobell, D. B., Schlenker, W., & Costa-Roberts, J. (2011) · Science · doi:10.1126/science.1204531 · Cited by 4,927
Nonlinear temperature effects indicate severe damages to U.S. crop yields under climate change
Schlenker, W., & Roberts, M. J. (2009) · Proceedings of the National Academy of Sciences · doi:10.1073/pnas.0906865106 · Cited by 3,420
GMM Estimation with Cross Sectional Dependence
Conley, T. G. (1999) · Journal of Econometrics · doi:10.1016/s0304-4076(98)00084-0 · Cited by 2,685
Rising temperatures reduce global wheat production
Asseng, S., Ewert, F., Martre, P., Rötter, R. P., Lobell, D. B., Cammarano, D., Kimball, B. A., Ottman, M. J., Wall, G. W., White, J. W., et al. (2015) · Nature Climate Change · doi:10.1038/nclimate2470 · Cited by 2,491
Haylock, M. R., Hofstra, N., Tank, A. K., Klok, E. J., Jones, P. D., & New, M. G. (2008) · Journal of Geophysical Research Atmospheres · doi:10.1029/2008jd010201 · Cited by 2,439
Adapting agriculture to climate change
Howden, M. S., Soussana, J., Tubiello, F. N., Chhetri, N., Dunlop, M., & Meinke, H. (2007) · Proceedings of the National Academy of Sciences · doi:10.1073/pnas.0701890104 · Cited by 2,136
Robust negative impacts of climate change on African agriculture
Schlenker, W., & Lobell, D. B. (2010) · Environmental Research Letters · doi:10.1088/1748-9326/5/1/014010 · Cited by 1,492
Temperatures and the growth and development of wheat: a review
Porter, J. R., & Gawith, M. J. (1999) · European Journal of Agronomy · doi:10.1016/s1161-0301(98)00047-1 · Cited by 1,162
Fisher, A. C., Hanemann, W. M., Roberts, M. J., & Schlenker, W. (2012) · American Economic Review · doi:10.1257/aer.102.7.3749 · Cited by 1,068
Adaptation to climate change: Evidence from US agriculture
Burke, M., & Emerick, K. (2016) · American Economic Journal: Economic Policy · doi:10.1257/pol.20130025 · Cited by 922
Research works printed but not linked: 1
- Lobell D B, 2017, Environ. Res. Lett., 12
Cited by
Sorted by citations
Effect of Climate Change on the Yield of Cereal Crops: A Review
Wang, J., Vanga, S. K., Saxena, R., Orsat, V., & Raghavan, V. (2018) · Climate · doi:10.3390/cli6020041 · Cited by 388
Temperature shocks and industry earnings news
Addoum, J. M., Ng, D. T., & Ortiz‐Bobea, A. (2023) · Journal of Financial Economics · doi:10.1016/j.jfineco.2023.07.002 · Cited by 322
Self-citationThe fingerprints of climate warming on cereal crops phenology and adaptation options
Fatima, Z., Ahmed, M., Hussain, M., Abbas, G., Ul‐Allah, S., Ahmad, S., Ahmed, N., Ali, M. A., Sarwar, G., Haque, E. U., et al. (2020) · Scientific Reports · doi:10.1038/s41598-020-74740-3 · Cited by 284
A Critical Review of Climate Change Impact at a Global Scale on Cereal Crop Production
Farooq, A., Farooq, N., Akbar, H., Hassan, Z. U., & Gheewala, S. H. (2023) · Agronomy · doi:10.3390/agronomy13010162 · Cited by 217
Unpacking the climatic drivers of US agricultural yields
Ortiz‐Bobea, A., Wang, H., Carrillo, C. M., & Ault, T. R. (2019) · Environmental Research Letters · doi:10.1088/1748-9326/ab1e75 · Cited by 220
Self-citationWorld’s Demand for Food and Water: The Consequences of Climate Change
Islam, S. M. F., & Karim, Z. (2019) · IntechOpen eBooks · doi:10.5772/intechopen.85919 · Cited by 203
Hu, T., Zhang, X., Khanal, S., Wilson, R. S., Leng, G., Toman, E. M., Wang, X., Li, Y., & Zhao, K. (2024) · Environmental Modelling & Software · doi:10.1016/j.envsoft.2024.106119 · Cited by 204
Does Climate Change Affect the Yield of the Top Three Cereals and Food Security in the World?
Neupane, D., Adhikari, P., Bhattarai, D., Rana, B., Ahmed, Z., Sharma, U., & Adhikari, D. (2022) · Earth · doi:10.3390/earth3010004 · Cited by 183
Climate change and adaptation in agriculture: Evidence from US cropping patterns
Cui, X. (2020) · Journal of Environmental Economics and Management · doi:10.1016/j.jeem.2020.102306 · Cited by 163
Cui, X., & Xie, W. (2021) · American Journal of Agricultural Economics · doi:10.1111/ajae.12227 · Cited by 144
Ortiz-Bobea, A., Knippenberg, E., & Chambers, R. G. (2018) · Science Advances · doi:10.1126/sciadv.aat4343 · Cited by 139
Self-citationHeat stress in wheat: a global challenge to feed billions in the current era of the changing climate
Farhad, M., Kumar, U., Tomar, V., Bhati, P. K., Navaneetha Krishnan, J., Mustarin, K. E., Bárek, V., Brestič, M., & Hossain, A. (2023) · Frontiers in Sustainable Food Systems · doi:10.3389/fsufs.2023.1203721 · Cited by 152
Identifying the Economic Impacts of Climate Change on Agriculture
Carter, C., Cui, X., Ghanem, D., & Mérel, P. (2018) · Annual Review of Resource Economics · doi:10.1146/annurev-resource-100517-022938 · Cited by 133
Self-citationCrop Biodiversity: An Unfinished Magnum Opus of Nature
Hufford, M. B., y Terán, J. C. B. M., & Gepts, P. (2019) · Annual Review of Plant Biology · doi:10.1146/annurev-arplant-042817-040240 · Cited by 122
Rewilding crops for climate resilience: economic analysis and de novo domestication strategies
Razzaq, A., Wani, S. H., Saleem, F., Yu, M., Zhou, M., & Shabala, S. N. (2021) · Journal of Experimental Botany · doi:10.1093/jxb/erab276 · Cited by 128
Climate change, cropland adjustments, and food security: Evidence from China
Cui, X., & Zheng, Z. (2023) · Journal of Development Economics · doi:10.1016/j.jdeveco.2023.103245 · Cited by 118
Climate Econometrics: Can the Panel Approach Account for Long‐Run Adaptation?
Mérel, P., & Gammans, M. (2021) · American Journal of Agricultural Economics · doi:10.1111/ajae.12200 · Cited by 131
Self-citationCrop rotations sustain cereal yields under a changing climate
Marini, L., St-Martin, A., Vico, G., Baldoni, G., Berti, A., Blecharczyk, A., Małecka-Jankowiak, I., Morari, F., Sawinska, Z., & Bommarco, R. (2020) · Environmental Research Letters · doi:10.1088/1748-9326/abc651 · Cited by 108
Reinermann, S., Geßner, U., Asam, S., Kuenzer, C., & Dech, S. W. (2019) · Remote Sensing · doi:10.3390/rs11151783 · Cited by 87
Hou, P., Liu, Y., Liu, W., Yang, H. S., Xie, R., Wang, K., Ming, B., Liu, G., Xue, J., Wang, Y., et al. (2021) · Resources Conservation and Recycling · doi:10.1016/j.resconrec.2021.105811 · Cited by 83
Chandio, A. A., Gökmenoğlu, K. K., & Ahmad, F. (2021) · Environmental Science and Pollution Research · doi:10.1007/s11356-021-14358-8 · Cited by 81
The impact of climate change in wheat and barley yields in the Iberian Peninsula
Bento, V. A., Ribeiro, A. F. S., Russo, A., Gouveia, C. M., Cardoso, R. M., & Soares, P. M. M. (2021) · Scientific Reports · doi:10.1038/s41598-021-95014-6 · Cited by 72
The Sixth Mass Extinction Crisis and its Impact on Biodiversity and Human Welfare
Shivanna, K. R. (2020) · Resonance · doi:10.1007/s12045-019-0924-z · Cited by 78
Mohammadi, S., Rydgren, K., Bakkestuen, V., & Gillespie, M. A. K. (2023) · Scientific Reports · doi:10.1038/s41598-023-30813-7 · Cited by 69
Climate change impact on wheat and maize growth in Ethiopia: A multi-model uncertainty analysis
Rettie, F. M., Gayler, S., Weber, T. K. D., Tesfaye, K., & Streck, T. (2022) · PLoS ONE · doi:10.1371/journal.pone.0262951 · Cited by 65
Using insurance data to quantify the multidimensional impacts of warming temperatures on yield risk
Perry, E., Yu, J., & Tack, J. (2020) · Nature Communications · doi:10.1038/s41467-020-17707-2 · Cited by 66
Two Harvests Are Better than One: Double Cropping as a Strategy for Climate Change Adaptation
Kawasaki, K. (2018) · American Journal of Agricultural Economics · doi:10.1093/ajae/aay051 · Cited by 62
Beyond Yield Response: Weather Shocks and Crop Abandonment
Cui, X. (2020) · Journal of the Association of Environmental and Resource Economists · doi:10.1086/709859 · Cited by 63
Climate risk to agriculture: A synthesis to define different types of critical moments
Shah, H., Hellegers, P., & Siderius, C. (2021) · Climate Risk Management · doi:10.1016/j.crm.2021.100378 · Cited by 62
Chen, X., Cui, X., & Gao, J. (2023) · Journal of Environmental Economics and Management · doi:10.1016/j.jeem.2023.102801 · Cited by 61
Grosse-Heilmann, M., Cristiano, E., Deidda, R., & Viola, F. (2024) · Resources Environment and Sustainability · doi:10.1016/j.resenv.2024.100170 · Cited by 64
Gowda, P. H., Steiner, J. L., OLSON, C. G., Boggess, M., Farrigan, T., & Grusak, M. A. (2018) · doi:10.7930/nca4.2018.ch10 · Cited by 61
The empirical analysis of climate change impacts and adaptation in agriculture
Ortiz‐Bobea, A. (2021) · Handbook of agricultural economics · doi:10.1016/bs.hesagr.2021.10.002 · Cited by 68
Self-citationGroh, J., Vanderborght, J., Pütz, T., Vogel, H. J., Gründling, R., Rupp, H., Rahmati, M., Sommer, M., Vereecken, H., & Gerke, H. H. (2020) · Hydrology and earth system sciences · doi:10.5194/hess-24-1211-2020 · Cited by 57
Impact of Climate Change on Durum Wheat Yield
Sabella, E., Aprile, A., Negro, C., Nicolì, F., Nutricati, E., Vergine, M., Luvisi, A., & Bellis, L. D. (2020) · Agronomy · doi:10.3390/agronomy10060793 · Cited by 55
Temperature effects on crop yields in heat index insurance
Bucheli, J., Dalhaus, T., & Finger, R. (2022) · Food Policy · doi:10.1016/j.foodpol.2021.102214 · Cited by 55
Historical and projected impacts of climate change and technology on soybean yield in China
Guo, S., Zhang, Z., Guo, E., Fu, Z., Gong, J., & Yang, X. (2022) · Agricultural Systems · doi:10.1016/j.agsy.2022.103522 · Cited by 53
Gamar, M. I. A., Kisiała, A., Emery, R. J. N., Yeung, E. C.-T., Stone, S. L., & Qaderi, M. M. (2019) · Planta · doi:10.1007/s00425-019-03213-3 · Cited by 52
Saddique, Q., Cai, H., Xu, J., Ajaz, A., He, J., Yu, Q., Wang, Y., Chen, H., Khan, M. I., Liu, D. L., et al. (2020) · Mitigation and Adaptation Strategies for Global Change · doi:10.1007/s11027-020-09935-0 · Cited by 52
Agricultural diversification, productivity, and food security across time and space
Chavas, J., Rivieccio, G., Falco, S. D., Luca, G. D., & Capitanio, F. (2022) · Agricultural Economics · doi:10.1111/agec.12742 · Cited by 61
Is another genetic revolution needed to offset climate change impacts for US maize yields?
Ortiz‐Bobea, A., & Tack, J. (2018) · Environmental Research Letters · doi:10.1088/1748-9326/aae9b8 · Cited by 49
Self-citationFaye, B., Webber, H. A., Gaiser, T., Müller, C., Zhang, Y., Stella, T., Latka, C., Reckling, M., Heckelei, T., Helming, K., et al. (2022) · European Journal of Agronomy · doi:10.1016/j.eja.2022.126670 · Cited by 54
Plant development and heat stress: role of exogenous nutrients and phytohormones in thermotolerance
Angon, P. B., Das, A., Roy, A. R., Khan, J. J., Ahmad, I., Biswas, A., Pallob, A. T., Mondol, M., & Yeasmin, S. T. (2024) · Discover Plants. · doi:10.1007/s44372-024-00020-3 · Cited by 45
Global implications of regional grain production through virtual water trade
Masud, M. B., Wada, Y., Goss, G. G., & Faramarzi, M. (2018) · The Science of The Total Environment · doi:10.1016/j.scitotenv.2018.12.392 · Cited by 45
Obembe, O. S., Hendricks, N. P., & Tack, J. (2021) · PLoS ONE · doi:10.1371/journal.pone.0252067 · Cited by 45
Review: Future consequences of climate change for European Union pig production
Renaudeau, D., & Dourmad, J.-Y. (2021) · animal · doi:10.1016/j.animal.2021.100372 · Cited by 39
Measuring the Effects of Climate Change on Wheat Production: Evidence from Northern China
Zhang, H., Tang, Y., Chandio, A. A., Sargani, G. R., & Twumasi, M. A. (2022) · International Journal of Environmental Research and Public Health · doi:10.3390/ijerph191912341 · Cited by 38
Weather insurance in European crop and horticulture production
Bucheli, J., Conrad, N., Wimmer, S., Dalhaus, T., & Finger, R. (2023) · Climate Risk Management · doi:10.1016/j.crm.2023.100525 · Cited by 41
Karkanis, A., Ntatsi, G., Alemardan, A., Petropoulos, S. A., & Bilalis, D. J. (2018) · The Journal of Agricultural Science · doi:10.1017/s0021859619000108 · Cited by 40
Bareille, F., & Chakir, R. (2023) · American Journal of Agricultural Economics · doi:10.1111/ajae.12420 · Cited by 36
Yao, P., Fan, H. M., Wu, Q., Ouyang, J., & Li, K. (2023) · The Science of The Total Environment · doi:10.1016/j.scitotenv.2023.163105 · Cited by 35
THE CRITICAL ROLE OF MARKETS IN CLIMATE CHANGE ADAPTATION
Anderson, S. E., Anderson, T. L., Hill, A. C., Kahn, M. E., Kunreuther, H., Libecap, G. D., Mantripragada, H. C., Mérel, P., Plantinga, A. J., & Smith, V. K. (2018) · Climate Change Economics · doi:10.1142/s2010007819500039 · Cited by 38
Self-citationHardening Blueberry Plants to Face Drought and Cold Events by the Application of Fungal Endophytes
Acuña‐Rodríguez, I. S., Ballesteros, G., Atala, C., Gundel, P. E., & Molina‐Montenegro, M. A. (2022) · Agronomy · doi:10.3390/agronomy12051000 · Cited by 33
Radmehr, R., Brorsen, B. W., & Shayanmehr, S. (2024) · Agricultural Water Management · doi:10.1016/j.agwat.2024.109052 · Cited by 32
Climate Change and Ecological Migration: A Study of Villages in the Province of Khuzestan, Iran
چشمه, م. م. د., & Ghaedi, S. (2020) · Environmental Research Engineering and Management · doi:10.5755/j01.erem.76.1.24513 · Cited by 27
Ajal, J., Jäck, O., Vico, G., & Weih, M. (2021) · Perspectives in Plant Ecology Evolution and Systematics · doi:10.1016/j.ppees.2021.125612 · Cited by 27
Paux, E., Lafarge, S., Balfourier, F., Derory, J., Charmet, G., Alaux, M., Perchet, G., Bondoux, M., Baret, F., Barillot, R., et al. (2022) · Biology · doi:10.3390/biology11010149 · Cited by 27
The Dynamic Effects of Weather Shocks on Agricultural Production
Crofils, C., Gallic, E., & Vermandel, G. (2024) · Journal of Environmental Economics and Management · doi:10.1016/j.jeem.2024.103078 · Cited by 26
Vialatte, A., Tibi, A., Alignier, A., Angeon, V., Bedoussac, L., Bohan, D. A., Bougherara, D., Carpentier, A., Castagneyrol, B., Cordeau, S., et al. (2021) · Advances in ecological research/Advances in Ecological Research · doi:10.1016/bs.aecr.2021.10.004 · Cited by 25
Rahman, M. M., Crain, J. L., Haghighattalab, A., Singh, R. P., & Poland, J. (2021) · Frontiers in Plant Science · doi:10.3389/fpls.2021.633651 · Cited by 25
Spatial difference of climate change effects on wheat protein concentration in China
Zhou, W., Liu, Y., Ata-Ul-Karim, S. T., & Ge, Q. (2021) · Environmental Research Letters · doi:10.1088/1748-9326/ac3401 · Cited by 24
Climate change to increase crop failure in U.S.
Kim, S. M., & Mendelsohn, R. O. (2022) · Environmental Research Letters · doi:10.1088/1748-9326/acac41 · Cited by 25
Relationships between weather and yield anomalies vary with crop type and latitude in Sweden
Sjulgård, H., Keller, T., Garland, G., & Colombi, T. (2023) · Agricultural Systems · doi:10.1016/j.agsy.2023.103757 · Cited by 30
The Triticeae CBF Gene Cluster—To Frost Resistance and Beyond
Caccialupi, G., Milc, J. A., Caradonia, F., Nasar, M. F., & Francia, E. (2023) · Cells · doi:10.3390/cells12222606 · Cited by 29
Assessing the Sensitivity of Main Crop Yields to Climate Change Impacts in China
Xu, Y., Chou, J., Yang, F., Sun, M., Zhao, W., & Li, J. (2021) · Atmosphere · doi:10.3390/atmos12020172 · Cited by 23
Maldonado-Méndez, M. D. L., Lozano, J. L. R., & Monterroso-Rivas, A. I. (2022) · Atmosphere · doi:10.3390/atmos13071114 · Cited by 23
Risk management in agricultural production
Tack, J., & Yu, J. (2021) · Handbook of agricultural economics · doi:10.1016/bs.hesagr.2021.10.004 · Cited by 30
Extreme weather events, climate expectations, and agricultural export dynamics
Nes, K., Schaefer, K. A., Gammans, M., & Scheitrum, D. P. (2025) · American Journal of Agricultural Economics · doi:10.1111/ajae.12505 · Cited by 28
Self-citationEvaluating area-specific adaptation strategies for rainfed maize under future climates of India
Rao, A. V. M. S., Chandran, M. A. S., Bal, S. K., Pramod, V. P., Sandeep, V. M., Manikandan, N., Raju, B. M. K., Prabhakar, M., Islam, A., Kumar, S. N., et al. (2022) · The Science of The Total Environment · doi:10.1016/j.scitotenv.2022.155511 · Cited by 22
On model selection criteria for climate change impact studies
Cui, X., Gafarov, B., Ghanem, D., & Kuffner, T. A. (2023) · Journal of Econometrics · doi:10.1016/j.jeconom.2023.105511 · Cited by 23
Contrasted response to climate change of winter and spring grain legumes in southwestern France
Falconnier, G. N., Vermue, A., Journet, E., Christina, M., Bedoussac, L., & Justes, É. (2020) · Field Crops Research · doi:10.1016/j.fcr.2020.107967 · Cited by 20
Double cropping as an adaptation to climate change in the United States
Gammans, M., Mérel, P., & Ortiz‐Bobea, A. (2024) · American Journal of Agricultural Economics · doi:10.1111/ajae.12491 · Cited by 20
Self-citationTrends and climate response in the yield of staple crops across Northeast China
Xiao, D.-P., Yang, X., Bai, H.-Z., Tang, J.-Z., & Tao, F.-L. (2024) · Frontiers in Sustainable Food Systems · doi:10.3389/fsufs.2023.1246347 · Cited by 19
Fertilizer response to climate change: Evidence from corn production in China
Quan, Q., Yi, F., & Liu, H. (2024) · The Science of The Total Environment · doi:10.1016/j.scitotenv.2024.172226 · Cited by 20
Karunarathne, S., Walker, E., Sharma, D., Li, C., & Han, Y. (2023) · Journal of Zhejiang University-SCIENCE B · doi:10.1631/jzus.b2200552 · Cited by 18
“…in some regions such as in Canada and northern Spain, where warmer winters would improve yields (Masud et al., 2018; Bento et al., 2021), whilst other regions such as France and southern Spain are likely to experience increasing agricultural losses (Gammans et al., 2017; Bento et al., 2021).”
Do Farmers Adapt to Climate Change? A Macro Perspective
Alvi, S., Jamil, F., Roson, R., & Sartori, M. (2020) · Agriculture · doi:10.3390/agriculture10060212 · Cited by 18
Impacts of Temperature Trends and SPEI on Yields of Major Cereal Crops in the Gambia
Jabbi, F. F., Li, Y., Zhang, T., Wang, B., Hassan, W., & Songcai, Y. (2021) · Sustainability · doi:10.3390/su132212480 · Cited by 17
Wang, T., Yi, F., Wu, X., Liu, H., & Zhang, Y. Y. (2023) · Australian Journal of Agricultural and Resource Economics · doi:10.1111/1467-8489.12545 · Cited by 16
Temperature thresholds and the effect of warming on American farmland value
Massetti, E., & Mendelsohn, R. O. (2020) · Climatic Change · doi:10.1007/s10584-020-02694-6 · Cited by 16
Araya, A., Prasad, P. V. V., Gowda, P. H., Djanaguiramana, M., & Gebretsadkan, Y. (2021) · Climate Risk Management · doi:10.1016/j.crm.2021.100308 · Cited by 16
Stella, T., Webber, H. A., Olesen, J. E., Ruane, A. C., Fronzek, S., Bregaglio, S., Mamidanna, S., Bindi, M., Collins, B., Faye, B., et al. (2021) · Environmental Research Letters · doi:10.1088/1748-9326/ac2196 · Cited by 16
Vicente, R., Vergara‐Díaz, O., Kerfal, S., López, A., Melichar, J. P. E., Bort, J., Serret, M. D., Araus, J. L., & Kefauver, S. C. (2018) · Plant Science · doi:10.1016/j.plantsci.2018.10.002 · Cited by 16
Corn and soybean prevented planting acres response to weather
Boyer, C. N., Park, E., & Yun, S. D. (2022) · Applied Economic Perspectives and Policy · doi:10.1002/aepp.13237 · Cited by 15
Nowak, B., Michaud, A., & Marliac, G. (2022) · Agronomy for Sustainable Development · doi:10.1007/s13593-022-00770-y · Cited by 14
Gao, Y., Wang, L., & Yue, Y.-J. (2024) · Frontiers in Sustainable Food Systems · doi:10.3389/fsufs.2023.1291866 · Cited by 13
Hagn, L., Schuster, J., Mittermayer, M., & Hülsbergen, K. (2024) · Precision Agriculture · doi:10.1007/s11119-024-10144-x · Cited by 14
Climate, weather, and collective reputation: Implications for California's wine prices and quality
Whitnall, S., & Alston, J. M. (2025) · Journal of Wine Economics · doi:10.1017/jwe.2025.8 · Cited by 14
Agricultural innovation and adaptation to climate change: Insights from US maize
Lee, S., Ji, Y., & Moschini, G. (2022) · Journal of the Agricultural and Applied Economics Association · doi:10.1002/jaa2.20 · Cited by 13
Sorvali, J., Liu, X., & Kaseva, J. (2022) · Frontiers in Psychology · doi:10.3389/fpsyg.2022.939201 · Cited by 13
Microclimate Modification in Field Crops: A Way Toward Climate-Resilience
Biswas, P., Mondal, S., Maji, S., Mondal, A., & Bandopadhyay, P. (2023) · Springer eBooks · doi:10.1007/978-3-031-37424-1_29 · Cited by 13
Széles, A., Huzsvai, L., Mohammed, S., Nyéki, A., Zagyi, P., Horváth, É., Simon, K., Arshad, S., & Tamás, A. (2024) · Journal of Agriculture and Food Research · doi:10.1016/j.jafr.2024.100967 · Cited by 13
Ahmed, M. H., Tesfaye, W. M., & Gassmann, F. (2022) · Journal of Agricultural Economics · doi:10.1111/1477-9552.12507 · Cited by 12
Faraz, M., Mereu, V., Spano, D., Trabucco, A., Marras, S., & Chami, D. E. (2023) · Sustainability · doi:10.3390/su151914582 · Cited by 15
Schuurman, D., & Ker, A. P. (2024) · American Journal of Agricultural Economics · doi:10.1111/ajae.12446 · Cited by 12
Unleashing the Potential of Biostimulants in Stimulating Pollen Germination and Tube Growth
Gupta, S., Novák, O., Kulkarni, M. G., Doležalová, I., Staden, J. V., & Doležal, K. (2024) · Journal of Plant Growth Regulation · doi:10.1007/s00344-024-11346-3 · Cited by 12
Effects of extreme heat events on crop revenues for U.S. corn and soybeans
Lee, S. (2025) · American Journal of Agricultural Economics · doi:10.1111/ajae.12527 · Cited by 11
Maphosa, Y., Jideani, V. A., & Ikhu‐Omoregbe, D. (2022) · Processes · doi:10.3390/pr10020299 · Cited by 10
He, T., Angessa, T. T., Hill, C. B., Zhang, X., Telfer, P., Westcott, S., & Li, C. (2022) · Crop Design · doi:10.1016/j.cropd.2021.12.001 · Cited by 10
Kim, Y.-G., Park, H. H., Lee, H., Kim, H.-K., & Kuk, Y. I. (2022) · Agronomy · doi:10.3390/agronomy12112731 · Cited by 10
Széles, É. (2018) · Emirates Journal of Food and Agriculture · doi:10.9755/ejfa.2018.v30.i9.1800 · Cited by 10
Metadata
- Authors
- Gammans, M., Mérel, P., & Ortiz-Bobea, A.
- Affiliations
- University of California, Davis (US)
- Giannini Foundation of Agricultural Economics (US)
- Venue
- Environmental Research Letters
- Publisher
- IOP Publishing
- Published
- 2017-05-01
- Volume
- 12
- Issue
- 5
- Pages
- 054007
- ISSN
- 1748-9326 (ISSN-L)
- OpenAlex
- W2411760869
- Cited by
- 185
- References
- 37
- Citations by year
- 2026: 12 · 2025: 17 · 2024: 28 · 2023: 26 · 2022: 35 · 2021: 27 · 2020: 19 · 2019: 7 · 2018: 14
- FWCI
- 9.52
- Type
- journal article
- Language
- en
- Open access
- gold
- doi.org
- Licence
- Locations
- Environmental Research Letters (publishedVersion, cc-by)
- DOAJ (DOAJ: Directory of Open Access Journals) (submittedVersion)
- Topics
- Life Sciences › Agricultural and Biological Sciences › Agronomy and Crop Science › Climate change impacts on agriculture
- Physical Sciences › Environmental Science › Global and Planetary Change › Climate variability and models
- Social Sciences › Economics, Econometrics and Finance › Economics and Econometrics › Climate Change Policy and Economics
- Keywords
- climate change impacts, cereal yield, wheat yield, barley yield, temperature effects on crop yield, precipitation effects, extreme cold, RCP8.5, agricultural technology trends, France
About these checks
Registry, retraction, Cites and statistics results are computed, not judged, with one exception: a printed reference that no index lists is read once by a model before it counts as a citation error. Claims are extracted by a model and kept only when their quote appears verbatim in the text; each cited source is then checked, with a model’s help, for whether it says what the claim relies on. Those verdicts can be wrong — read the claim’s quote and the cited source before relying on one.
Statistics and arithmetic are recomputed, not judged.
Confidence bands are shown only for fields calibrated on our annotated test set. None is calibrated yet, so no band is shown.
What counts as a claim ›How we measure confidence ›How we check this ›
Are you an author, or do you see a problem with this page? Request a review
