

The DOI matches its Crossref record; 62 of the 62 references it cites were found in a registry or an index.
Cell survival, DNA damage, and oncogenic transformation after a transient and reversible apoptotic response
Open accessAbstract
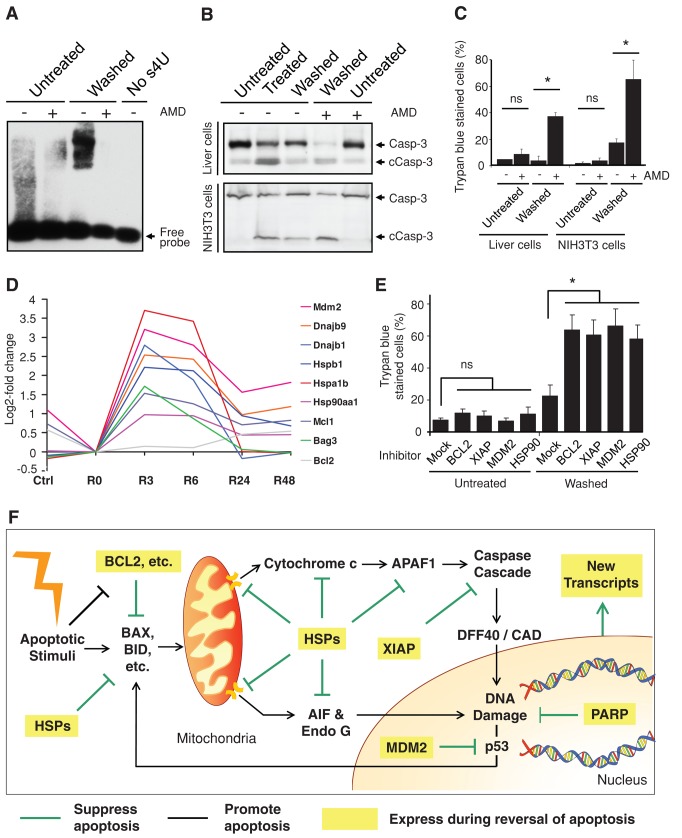
Apoptosis serves as a protective mechanism by eliminating damaged cells through programmed cell death. After apoptotic cells pass critical checkpoints, including mitochondrial fragmentation, executioner caspase activation, and DNA damage, it is assumed that cell death inevitably follows. However, this assumption has not been tested directly. Here we report an unexpected reversal of late-stage apoptosis in primary liver and heart cells, macrophages, NIH 3T3 fibroblasts, cervical cancer HeLa cells, and brain cells. After exposure to an inducer of apoptosis, cells exhibited multiple morphological and biochemical hallmarks of late-stage apoptosis, including mitochondrial fragmentation, caspase-3 activation, and DNA damage. Surprisingly, the vast majority of dying cells arrested the apoptotic process and recovered when the inducer was washed away. Of importance, some cells acquired permanent genetic changes and underwent oncogenic transformation at a higher frequency than controls. Global gene expression analysis identified a molecular signature of the reversal process. We propose that reversal of apoptosis is an unanticipated mechanism to rescue cells from crisis and propose to name this mechanism “anastasis” (Greek for “rising to life”). Whereas carcinogenesis represents a harmful side effect, potential benefits of anastasis could include preservation of cells that are difficult to replace and stress-induced genetic diversity.
Overview
The claims and statistics of this paper haven’t been checked yet.
Run the check — free, no account needed. It reads the open-access text and checks the sources it cites.
Integrity signals
Registry
Cites
Statistics
Figures
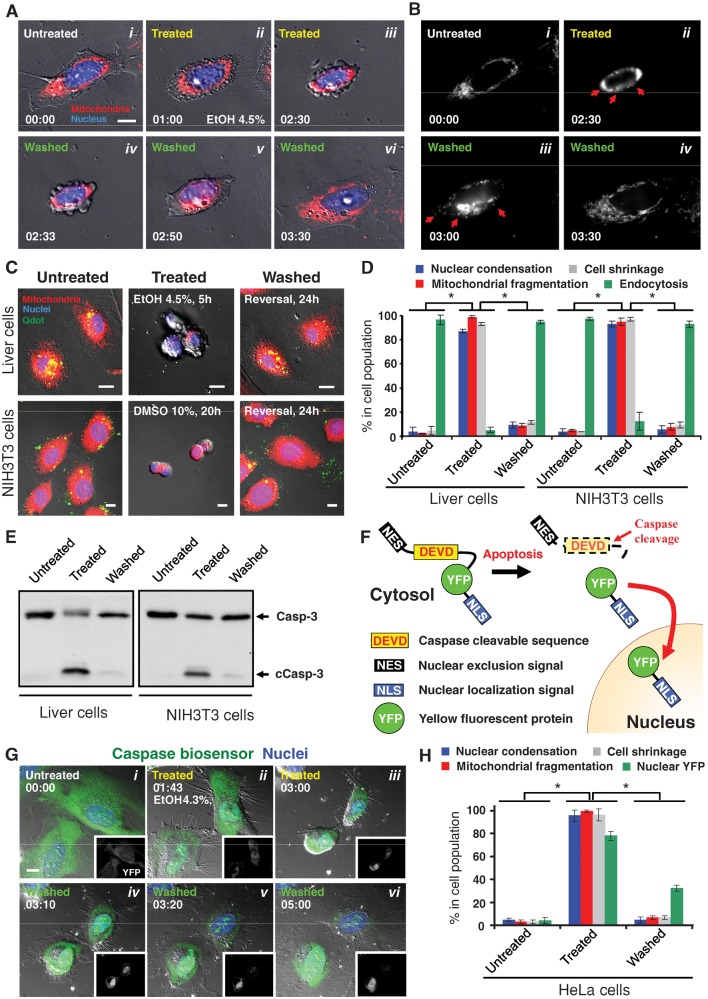
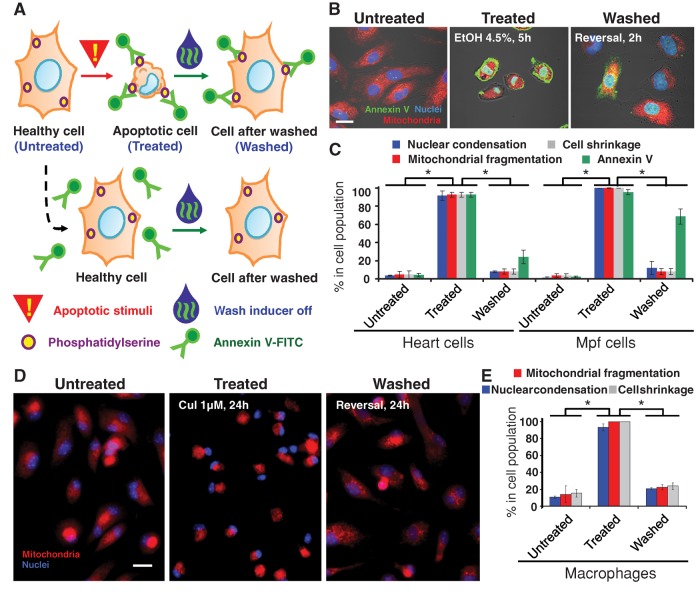
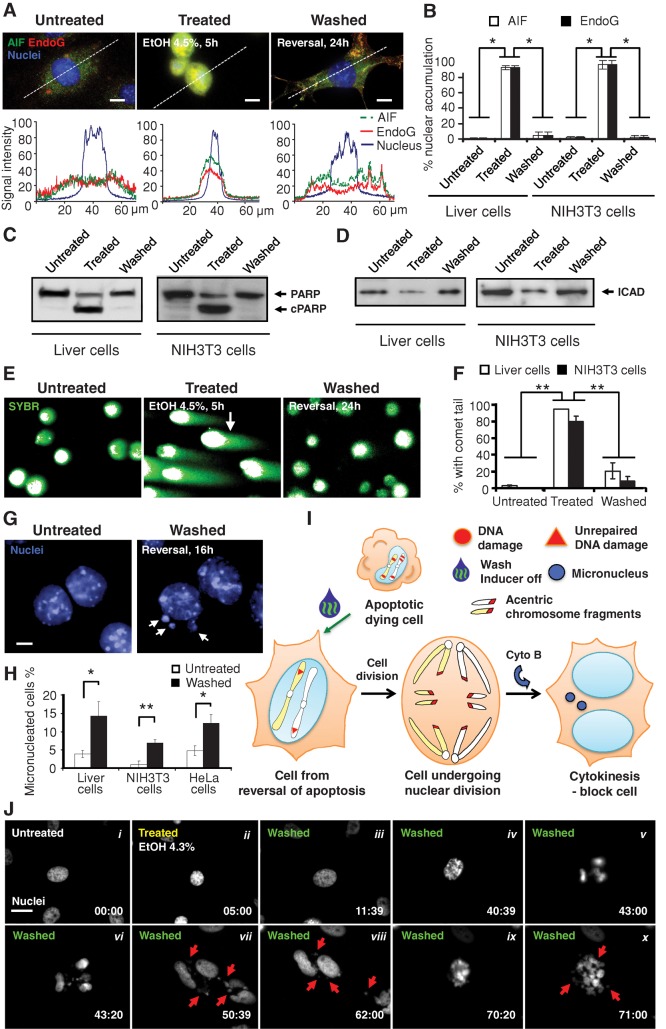
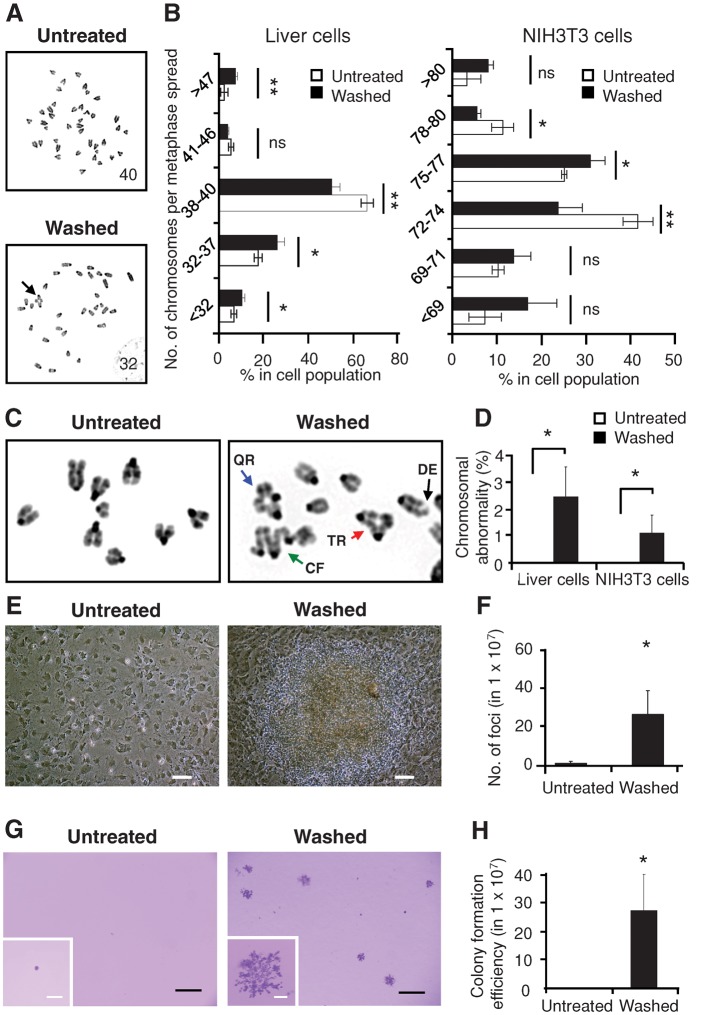
Verification
Claims the paper makes
The claims and statistics of this paper haven’t been checked yet.
Run the check — free, no account needed. It reads the open-access text and checks the sources it cites.
Claims other papers make about this one
Each is checked against this paper’s own text: does it say what the citing paper says it does?
In the citing paper
“Finally, at least some cells exposed to transient apoptotic stimuli appear to survive MOMP affecting a limited number of mitochondria and the partial activation of executioner caspases by a hitherto poorly characterized process called anastasis (most likely constituting a robust adaptative response upstream of the boundary between cellular life and death) [226–228].”
From Molecular mechanisms of cell death: recommendations of the nomenclature committee on cell death 2018. (2018) · cites this paper as [228]
Self-check
Percentages, sums and reported differences re-computed from the paper’s own numbers.
The self-check needs the paper’s full text.
Citations
Cites
Apoptosis: A Basic Biological Phenomenon with Wideranging Implications in Tissue Kinetics
Kerr, J. F. R., Wyllie, A. H., & Currie, A. R. (1972) · British Journal of Cancer · doi:10.1038/bjc.1972.33 · Cited by 15,673
Molecular characterization of mitochondrial apoptosis-inducing factor
Susin, S. A., Lorenzo, H. K., Zamzami, N., Marzo, I., Snow, B. E., Brothers, G. M., Mangion, J., Jacotot, E., Costantini, P., Loeffler, M., et al. (1999) · Nature · doi:10.1038/17135 · Cited by 4,060
Stratton, M. R., Campbell, P. J., & Futreal, P. A. (2009) · Nature · doi:10.1038/nature07943 · Cited by 3,625
The Pathophysiology of Mitochondrial Cell Death
Green, D. R., & Kroemer, G. (2004) · Science · doi:10.1126/science.1099320 · Cited by 3,487
Classification of cell death: recommendations of the Nomenclature Committee on Cell Death 2009
Kroemer, G., Galluzzi, L., Vandenabeele, P., Abrams, J., Alnemri, E. S., Baehrecke, E. H., Blagosklonny, M. V., El-Deiry, W. S., Golstein, P., Green, D. R., et al. (2009) · Cell Death & Differentiation · doi:10.1038/cdd.2008.150 · Cited by 3,399
A caspase-activated DNase that degrades DNA during apoptosis, and its inhibitor ICAD
Enari, M., Sakahira, H., Yokoyama, H., Okawa, K., Iwamatsu, A., & Nagata, S. (1998) · Nature · doi:10.1038/34112 · Cited by 3,239
Apoptosis: controlled demolition at the cellular level
Taylor, R. C., Cullen, S. P., & Martin, S. J. (2007) · Nature Reviews Molecular Cell Biology · doi:10.1038/nrm2312 · Cited by 2,708
Programmed Cell Death in Animal Development
Jacobson, M. D., Weil, M., & RAFF, M. C. (1997) · Cell · doi:10.1016/s0092-8674(00)81873-5 · Cited by 2,685
The Significance of Responses of the Genome to Challenge
McClintock, B. (1984) · Science · doi:10.1126/science.15739260 · Cited by 2,638
Cleavage of poly(ADP-ribose) polymerase by a proteinase with properties like ICE
Lazebnik, Y. A., Kaufmann, S. H., Desnoyers, S., Poirier, G. G., & Earnshaw, W. C. (1994) · Nature · doi:10.1038/371346a0 · Cited by 2,563
Research works printed but not linked: 1
- Gordon WC, 2002, Invest Ophthalmol Visual Sci, 43, 3511
Cited by
Sorted by citations
Items 101–200 of 290
Contribution of Apaf-1 to the pathogenesis of cancer and neurodegenerative diseases
Shakeri, R., Kheirollahi, A., & Davoodi, J. (2021) · Biochimie · doi:10.1016/j.biochi.2021.07.004 · Cited by 32
Chattopadhyay, C., Grimm, E. A., & Woodman, S. E. (2014) · PLoS ONE · doi:10.1371/journal.pone.0083957 · Cited by 30
Cell-Cycle Cross Talk with Caspases and Their SubstratesPreprint
Connolly, P. F., García-Carpio, I., & Villunger, A. (2019) · Cold Spring Harbor Perspectives in Biology · doi:10.1101/cshperspect.a036475 · Cited by 32
Kumar, A., Sirohi, V. K., Anum, F., Singh, P. K., Gupta, K., Gupta, D., Saraf, S. A., Dwivedi, A., & Chourasia, M. K. (2017) · Nanomedicine Nanotechnology Biology and Medicine · doi:10.1016/j.nano.2017.04.014 · Cited by 29
Xing, J., & Tian, X. (2019) · Physical Biology · doi:10.1088/1478-3975/ab0032 · Cited by 31
The DNA Double-Strand Break Repair in Glioma: Molecular Players and Therapeutic Strategies
Maksoud, S. (2022) · Molecular Neurobiology · doi:10.1007/s12035-022-02915-2 · Cited by 29
Viability Assessment Following Anticancer Treatment Requires Single-Cell Visualization
Mirzayans, R., Andrais, B., & Murray, D. L. (2018) · Cancers · doi:10.3390/cancers10080255 · Cited by 28
The cause of cancer: The unifying theory
Majérus, M.-A. (2022) · Advances in Cancer Biology - Metastasis · doi:10.1016/j.adcanc.2022.100034 · Cited by 32
Deivasigamani, S., Miteva, M. T., Natale, S., Gutierrez‐Barragan, D., Basilico, B., Angelantonio, S. D., Weinhard, L., Molotkov, D., Deb, S., Pape, C., et al. (2023) · Cerebral Cortex · doi:10.1093/cercor/bhad313 · Cited by 28
Wang, R., Wang, Y., Liu, X., Liu, M., Sun, L., Pan, X., Hu, H., Jiang, B., Zou, Y., Liu, Q., et al. (2023) · Cell Death and Disease · doi:10.1038/s41419-023-05916-8 · Cited by 27
Wier, E. M., Fu, K., Hodgson, A., Sun, X., & Wan, F. (2015) · FEBS Letters · doi:10.1016/j.febslet.2015.10.019 · Cited by 27
Carter, J. R., Keith, J. H., Fraser, T. S., Dawson, J. L., Kucharski, C. A., Horne, K. M., Higgs, S., & Fraser, M. J. (2014) · Virology Journal · doi:10.1186/1743-422x-11-111 · Cited by 26
Ma, F., Zhang, A., Chang, D., Velev, O. D., Wiltberger, K., & Kshirsagar, R. (2019) · Process Biochemistry · doi:10.1016/j.procbio.2019.02.017 · Cited by 25
Multi-parametric imaging of cell heterogeneity in apoptosis analysis
Vorobjev, I. A., & Barteneva, N. S. (2016) · Methods · doi:10.1016/j.ymeth.2016.07.003 · Cited by 24
Bioenergetics of life, disease and death phenomena
Kasperski, A., & Kasperska, R. (2018) · Theory in Biosciences · doi:10.1007/s12064-018-0266-5 · Cited by 25
Cytochrome c: Using Biological Insight toward Engineering an Optimized Anticancer Biodrug
Delinois, L. J., León-Vélez, O. D., Vázquez-Medina, A., Vélez-Cabrera, A., Marrero-Sánchez, A., Nieves-Escobar, C., Alfonso-Cano, D., Caraballo-Rodríguez, D., Rodriguez-Ortiz, J., Acosta‐Mercado, J., et al. (2021) · Inorganics · doi:10.3390/inorganics9110083 · Cited by 22
Persister cell plasticity in tumour drug resistance
McDonald, P. C., & Dedhar, S. (2023) · Seminars in Cell and Developmental Biology · doi:10.1016/j.semcdb.2023.11.003 · Cited by 29
Learning on the Fly: The Interplay between Caspases and Cancer
Xu, D. C., Arthurton, L., & Baena-López, L. A. (2018) · BioMed Research International · doi:10.1155/2018/5473180 · Cited by 23
Dias, L. M., Sharifi, F., de Keijzer, M. J., Mesquita, B. S., Desclos, E. C. B., Kochan, J. A., de Klerk, D. J., Ernst, D., de Haan, L. R., Franchi, L. P., et al. (2021) · Journal of Photochemistry and Photobiology B Biology · doi:10.1016/j.jphotobiol.2021.112146 · Cited by 21
You, W., Zhou, T., Knoops, K., Berendschot, T. T. J. M., van Zandvoort, M. A. M. J., Germeraad, W. T. V., Benedikter, B. J., Webers, C. A. B., Reutelingsperger, C. P. M., & Gorgels, T. G. M. F. (2023) · Scientific Reports · doi:10.1038/s41598-023-38210-w · Cited by 21
Zhang, C., Yan, W., Bi, L., Xu, B., Gong, Y., Chu, F., Zhang, Y., Yao, Q., Wang, P., & Lei, H. (2015) · International Journal of Molecular Sciences · doi:10.3390/ijms160716401 · Cited by 20
Genetic Instability and Chromatin Remodeling in Spermatids
Cavé, T., Desmarais, R., Lacombe-Burgoyne, C., & Boissonneault, G. (2019) · Genes · doi:10.3390/genes10010040 · Cited by 21
Effects of Acute Hyperthermia on the Thermotolerance of Cow and Sheep Skin-Derived Fibroblasts
Saadeldin, I. M., Swelum, A. A., Zakri, A. M., Tukur, H. A., & Alowaimer, A. N. (2020) · Animals · doi:10.3390/ani10040545 · Cited by 20
Review: apoptotic mechanisms in bacterial infections of the central nervous system
Parthasarathy, G., & Philipp, M. T. (2012) · Frontiers in Immunology · doi:10.3389/fimmu.2012.00306 · Cited by 20
Carter, J. R., Taylor, S., Fraser, T. S., Kucharski, C. A., Dawson, J. L., & Fraser, M. J. (2015) · PLoS ONE · doi:10.1371/journal.pone.0139899 · Cited by 20
The DNA double-strand “breakome” of mouse spermatids
Grégoire, M.-C., Leduc, F., Morin, M., Cavé, T., Arguin, M., Richter, M. V., Jacques, P., & Boissonneault, G. (2018) · Cellular and Molecular Life Sciences · doi:10.1007/s00018-018-2769-0 · Cited by 23
Cao, Y., Lu, C., Beeraka, N. M., Efetov, S. K., Enikeev, M. E., Fu, Y., Yang, X., Basappa, B., He, M., & Li, Z. (2024) · Frontiers in Immunology · doi:10.3389/fimmu.2024.1428920 · Cited by 20
Activation of the apoptotic pathway during prolonged prometaphase blocks daughter cell proliferation
Uetake, Y., & Sluder, G. (2018) · Molecular Biology of the Cell · doi:10.1091/mbc.e18-01-0026 · Cited by 17
Detecting Anastasis In Vivo by CaspaseTracker Biosensor
Tang, H. M., Fung, M. C., & Tang, H. L. (2018) · Journal of Visualized Experiments · doi:10.3791/54107 · Cited by 20
Self-citationPellegrini, H., Sharpe, E. H., Liu, G., Nishiuchi, E., Doerr, N., Kipp, K. R., Chin, T., Schimmel, M. F., & Weimbs, T. (2023) · Journal of Biological Chemistry · doi:10.1016/j.jbc.2023.105158 · Cited by 17
Anandi, L., V, Chakravarty, V., Ashiq, K. A., Bodakuntla, S., & Lahiri, M. (2017) · Journal of Cell Science · doi:10.1242/jcs.203034 · Cited by 18
Moumaris, M., Rajoelya, B., & Abuafa, N. (2015) · Open Biological Sciences Journal · doi:10.2174/2352633501501010007 · Cited by 18
The Problem of Apoptotic Processes Reversibility
Zakharov, I. I., Savitskaya, M. A., & Онищенко, Г. Е. (2020) · Biochemistry (Moscow) · doi:10.1134/s000629792010003x · Cited by 17
Current trends in luminescence-based assessment of apoptosis
Moldovan, C. S., Onaciu, A., Toma, V., Munteanu, R. A., Gulei, D., Moldovan, A. I., STIUFIUC, G., Feder, R., Cenariu, D., Iuga, C. A., et al. (2023) · RSC Advances · doi:10.1039/d3ra05809c · Cited by 16
A time window for rescuing dying retinal ganglion cells
You, W., Knoops, K., Boesten, I., Berendschot, T. T. J. M., van Zandvoort, M. A. M. J., Benedikter, B. J., Webers, C. A. B., Reutelingsperger, C. P. M., & Gorgels, T. G. M. F. (2024) · Cell Communication and Signaling · doi:10.1186/s12964-023-01427-3 · Cited by 17
Dias, L. M., de Keijzer, M. J., Ernst, D., Sharifi, F., de Klerk, D. J., Kleijn, T. G., Desclos, E. C. B., Kochan, J. A., de Haan, L. R., Franchi, L. P., et al. (2022) · Journal of Photochemistry and Photobiology B Biology · doi:10.1016/j.jphotobiol.2022.112500 · Cited by 17
Oleanolic acid inhibits cell growth and induces apoptosis in A375 melanoma cells
Vazhappilly, C. G., Kumar, D. R. N., Suresh, P. K., & Kumar, R. A. (2014) · Biomedicine & Preventive Nutrition · doi:10.1016/j.bionut.2013.09.003 · Cited by 17
Wang, Y., Wang, R., Liu, X., Liu, M., Sun, L., Pan, X., Hu, H., Jiang, B., Zou, Y., Liu, Q., et al. (2023) · Oncogenesis · doi:10.1038/s41389-023-00479-x · Cited by 15
Mutagenic Consequences of Sublethal Cell Death Signaling
Hawkins, C. J., & Miles, M. A. (2021) · International Journal of Molecular Sciences · doi:10.3390/ijms22116144 · Cited by 15
Guo, W., Zhang, H., Yan, W., Liu, Y., Zhou, F., Cai, D., Zhang, W., Huang, X., Jia, X., Chen, H., et al. (2019) · European Journal of Medicinal Chemistry · doi:10.1016/j.ejmech.2019.111839 · Cited by 15
Tang, H. M., Talbot, C. C., Fung, M. C., & Tang, H. L. (2022) · Scientific Data · doi:10.1038/s41597-022-01470-8 · Cited by 16
Self-citationMutations, protein homeostasis, and epigenetic control of genome integrity
Xie, J. L., & Jarosz, D. F. (2018) · DNA repair · doi:10.1016/j.dnarep.2018.08.004 · Cited by 18
Benayas, E., Espinosa, A., Portolés, M. T., Sol, V. V., Morales, M. P., & Serrano, M. C. (2023) · ACS Applied Materials & Interfaces · doi:10.1021/acsami.3c02729 · Cited by 14
Zeta-crystallin: a moonlighting player in cancer
Lulli, M., Nencioni, D., Papucci, L., & Schiavone, N. (2019) · Cellular and Molecular Life Sciences · doi:10.1007/s00018-019-03301-3 · Cited by 14
What does BCL-2 do? From new molecular insights to the clinical implications
Croce, C. M., Tait, S. W. G., García‐Sáez, A. J., Villunger, A., Letai, A. G., Walter, H. S., Dyer, M. J. S., Green, D. R., Shi, Y., & Melino, G. (2026) · Cell Death and Differentiation · doi:10.1038/s41418-025-01607-3 · Cited by 14
Chromosomal Rearrangements and Chromothripsis: The Alternative End Generation Model
de Groot, D., Spanjaard, A., Hogenbirk, M. A., & Jacobs, H. (2023) · International Journal of Molecular Sciences · doi:10.3390/ijms24010794 · Cited by 15
Mirzayans, R. (2024) · Current Issues in Molecular Biology · doi:10.3390/cimb46060322 · Cited by 13
Caught green-handed: methods for in vivo detection and visualization of protease activity
Fernández-Fernández, Á. D., van der Hoorn, R. A. L., Gevaert, K., Breusegem, F. V., & Stael, S. (2019) · Journal of Experimental Botany · doi:10.1093/jxb/erz076 · Cited by 13
Wan, Q., & Tang, J. Y. (2019) · Graefe s Archive for Clinical and Experimental Ophthalmology · doi:10.1007/s00417-019-04410-2 · Cited by 13
Joshi, C., Karumuri, B. K., Newman, J. J., & DeCoster, M. A. (2012) · doi:10.13140/2.1.3299.6648 · Cited by 13
Saadeldin, I. M., Tanga, B. M., Bang, S., Maigoro, A. Y., Kang, H., Cha, D., Lee, S., Lee, S., & Cho, J. (2023) · Functional & Integrative Genomics · doi:10.1007/s10142-023-01126-9 · Cited by 12
Co-Delivery of siRNA and Docetaxel to Cancer Cells by NLC for Therapy
Şenel, B., Başaran, E., Akyıl, E., Güven, U. M., & Büyükköroğlu, G. (2024) · ACS Omega · doi:10.1021/acsomega.3c09098 · Cited by 13
Avian blastoderm dormancy arrests cells in G 2 and suppresses apoptosis
Ko, M., Hwang, Y. S., Rim, J. S., Han, H. J., & Han, J. Y. (2017) · The FASEB Journal · doi:10.1096/fj.201601051rr · Cited by 12
DNA fragility at the KMT2A / MLL locus: insights from old and new technologies
Cowell, I. G., & Austin, C. A. (2023) · Open Biology · doi:10.1098/rsob.220232 · Cited by 12
Premature senescence and cardiovascular disease following cancer treatments: mechanistic insights
Jain, A., Casanova, D., Padilla, A. V., Paniagua-Bojorges, A., Kotla, S., Ko, K. A., Samanthapudi, V. S. K., Chau, K. M., Nguyen, M. T., Wen, J. J., et al. (2023) · Frontiers in Cardiovascular Medicine · doi:10.3389/fcvm.2023.1212174 · Cited by 11
Nieratschker, M., Yıldız, E., Gerlitz, M., Bera, S., Gadenstaetter, A. J., Kramer, A.-M., Kwiatkowska, M., Mistrík, P., Landegger, L. D., Braun, S., et al. (2024) · Cell Death and Disease · doi:10.1038/s41419-024-06854-9 · Cited by 11
Apoptosis signaling is activated as a transient pulse in neurons
Spiess, K., Geden, M. J., Romero, S. E., Hollville, É., Hammond, E. S., Patterson, R. L., Girardi, Q. B., & Deshmukh, M. (2024) · Cell Death and Differentiation · doi:10.1038/s41418-024-01403-5 · Cited by 11
Wang, L., Bukhari, H., Kong, L., Hagemann, T. L., Zhang, S.-C., Messing, A., & Feany, M. Β. (2022) · Journal of Neuroscience · doi:10.1523/jneurosci.1659-21.2021 · Cited by 11
Potential role of anastasis in cancer initiation and progression
Raj, A. T., Kheur, S. M., Bhonde, R. R., Gupta, A. A., Patil, V. R., & Kharat, A. H. (2019) · APOPTOSIS · doi:10.1007/s10495-019-01538-8 · Cited by 11
Grilo, A. L., & Mantalaris, A. (2019) · Biotechnology Journal · doi:10.1002/biot.201800573 · Cited by 11
Ghosh, N., & Sil, P. C. (2021) · Elsevier eBooks · doi:10.1016/b978-0-12-821562-3.00031-9 · Cited by 11
Pellestor, F., Gâtinois, V., Puechberty, J., Geneviève, D., & Lefort, G. (2014) · médecine/sciences · doi:10.1051/medsci/20143003014 · Cited by 11
HepG2 cells recovered from apoptosis show altered drug responses and invasiveness
Wang, S., Xie, X., Wong, C. S. T., Choi, P. Y., & Fung, M. C. (2014) · Hepatobiliary & pancreatic diseases international · doi:10.1016/s1499-3872(14)60042-4 · Cited by 11
Self-citationYou, W., Berendschot, T. T. J. M., Knoops, K., van Zandvoort, M. A. M. J., Webers, C. A. B., Reutelingsperger, C. P. M., & Gorgels, T. G. M. F. (2022) · International Journal of Molecular Sciences · doi:10.3390/ijms23052650 · Cited by 10
Redefining the roles of apoptotic factors in carcinogenesis
Liu, X., He, Y., Li, F., Huang, Q., Kato, T. A., Hall, R. P., & Li, C. (2015) · Molecular & Cellular Oncology · doi:10.1080/23723556.2015.1054550 · Cited by 10
Possible molecular mechanisms underlying the development of atherosclerosis in cancer survivors
Banerjee, P., Rosales, J. E., Chau, K. M., Nguyen, M. T., Kotla, S., Lin, S. H., Deswal, A. M., Dantzer, R., Olmsted‐Davis, E. A., Nguyen, H., et al. (2023) · Frontiers in Cardiovascular Medicine · doi:10.3389/fcvm.2023.1186679 · Cited by 10
CD24 flags anastasis in melanoma cells
Vasileva, M. H., Bennemann, A., Zachmann, K., Schön, M. P., Frank, J., & Ulaganathan, V. K. (2024) · APOPTOSIS · doi:10.1007/s10495-024-01990-1 · Cited by 9
Marca, J. E. L., Kelly, G. L., Strasser, A., & Diepstraten, S. T. (2024) · Developmental Cell · doi:10.1016/j.devcel.2024.06.018 · Cited by 9
Programmed cell revival from imminent cell death enhances tissue repair and regeneration
Dhar, K., Jena, K. K., Mehto, S., Sahu, R., Murmu, K. C., Mahajan, A. A., Behera, S., Putchala, R. K., Mathew, R. J., Bal, R., et al. (2025) · The EMBO Journal · doi:10.1038/s44318-025-00540-y · Cited by 9
After-Death Functions of Cell Death.
Lee, Y., & Overholtzer, M. (2019) · Europe PMC (PubMed Central) · Cited by 9
Hasan, A., Rizvi, S. F., Parveen, S., & Mir, S. S. (2022) · Life Sciences · doi:10.1016/j.lfs.2022.120852 · Cited by 11
Plaza, S. C., & Su, T. T. (2024) · Cell Death Discovery · doi:10.1038/s41420-023-01769-4 · Cited by 8
Cell Death, by Any Other Name…
Kandouz, M. (2024) · Cells · doi:10.3390/cells13040325 · Cited by 10
Zikaki, K., Kiachaki, E., Gaitanaki, C., & Aggeli, I.-K. S. (2025) · International Journal of Molecular Sciences · doi:10.3390/ijms26062435 · Cited by 9
Bettadapur, A., & Ralston, K. S. (2020) · Molecular and Biochemical Parasitology · doi:10.1016/j.molbiopara.2020.111301 · Cited by 9
Gama, V., & Deshmukh, M. (2015) · Molecular Cell · doi:10.1016/j.molcel.2015.03.035 · Cited by 9
The undead in culture and science
Nugent, C., Berdine, G. G., & NUGENT, K. M. (2018) · Baylor University Medical Center Proceedings · doi:10.1080/08998280.2018.1441216 · Cited by 9
Nuclear stability in early embryo. Chromosomal aberrations
Баранов, В. С., & Kuznetzova, T. V. (2021) · Elsevier eBooks · doi:10.1016/b978-0-12-823579-9.00012-6 · Cited by 8
DNA fragmentation factor B suppresses interferon to enable cancer persister cell regrowth
Williams, A. F., Gervasio, D. A. G., Turkal, C. E., Stuhlfire, A. E., Wang, M. X., Mauch, B. E., Plawat, R., Nguyen, A. H., Paw, M. H., Hairani, M., et al. (2025) · Nature Cell Biology · doi:10.1038/s41556-025-01810-x · Cited by 9
Toward a predictive understanding of epithelial cell death
Cumming, T., & Levayer, R. (2023) · Seminars in Cell and Developmental Biology · doi:10.1016/j.semcdb.2023.06.008 · Cited by 8
A feedback loop that drives cell death and proliferation and its defect in intestinal stem cells
Sulekh, S., Ikegawa, Y., Naito, S., Oji, A., Hiratani, I., & Yoo, S. K. (2024) · Life Science Alliance · doi:10.26508/lsa.202302238 · Cited by 8
Wolf, S. P., Leisegang, M., Steiner, M., Wallace, V., Kiyotani, K., Hu, Y., Rosenberger, L., Huang, J., Schreiber, K., Nakamura, Y., et al. (2024) · Science Immunology · doi:10.1126/sciimmunol.adp6529 · Cited by 9
Anastasis and the ER stress response: Solving the paradox of the unfolded protein response in cancer
Manalo, R. V. M. (2017) · Medical Hypotheses · doi:10.1016/j.mehy.2017.09.013 · Cited by 8
Reversion of Pneumolysin-Induced Executioner Caspase Activation Redirects Cells to Survival
Nerlich, A. G., Teruel, I. V. W.-R., Mieth, M., Hönzke, K., Rückert, J. C., Mitchell, T. J., Suttorp, N., Hippenstiel, S., & Hocke, A. C. (2020) · The Journal of Infectious Diseases · doi:10.1093/infdis/jiaa639 · Cited by 8
Hadžić, M., Pojskić, L., Lojo-Kadrić, N., Haverić, A., Ramić, J., Galić, B., & Haverić, S. (2022) · Journal of Biochemical and Molecular Toxicology · doi:10.1002/jbt.23005 · Cited by 8
Unravelling the pathological roles of anastasis in cancer recurrence
Tang, H. M., & Tang, H. L. (2025) · Open Biology · doi:10.1098/rsob.240270 · Cited by 7
Self-citationNeuroprotective Role of Vitamin B 3 in Experimentally Induced Oxidative Stress
El‐Atrash, A., Dawood, L. M., Tousson, E., & Salama, A. M. A. (2015) · Clinical and experimental neurology · doi:10.12691/ijcen-3-1-4 · Cited by 7
Intracellular mitochondrial DNA transfers to the nucleus in human cancer cells
Ju, Y. S. (2016) · Current Opinion in Genetics & Development · doi:10.1016/j.gde.2016.02.005 · Cited by 8
Ávila, J., Gómez‐Ramos, A., & Soriano, E. (2014) · Frontiers in Aging Neuroscience · doi:10.3389/fnagi.2014.00323 · Cited by 7
Nonapoptotic role of EGL-1 in exopher production and neuronal health in Caenorhabditis elegans
Wu, Z., Cardona, E. A., Cohn, J., & Pierce-Shimomura, J. T. (2025) · Proceedings of the National Academy of Sciences · doi:10.1073/pnas.2407909122 · Cited by 5
Anastasis, recovery from the brink of death as a mechanism of drug resistance
McDonald, P. C., Nagel, J. M., & Dedhar, S. (2021) · Elsevier eBooks · doi:10.1016/b978-0-12-821310-0.00004-8 · Cited by 6
When Therapy-Induced Cancer Cell Apoptosis Fuels Tumor Relapse
Mirzayans, R. (2024) · Onco · doi:10.3390/onco4010003 · Cited by 6
TABIBZADEH, S. S., & Brown, O. R. (2024) · Aging and Cancer · doi:10.1002/aac2.12070 · Cited by 7
Mirzayans, R., Andrais, B., & Murray, D. L. (2024) · Methods in molecular biology · doi:10.1007/978-1-0716-3946-7_17 · Cited by 6
In Vivo Biosensor Tracks Non-apoptotic Caspase Activity in Drosophila
Tang, H. L., Tang, H. M., Fung, M. C., & Hardwick, J. M. (2016) · Journal of Visualized Experiments · doi:10.3791/53992 · Cited by 6
Self-citationXu, Y., So, C., Lam, H., Fung, M.-C., & Tsang, S. Y. (2019) · Journal of Visualized Experiments · doi:10.3791/58642 · Cited by 7
Self-citationMartinikova, A. S., Burócziová, M., Stoyanov, M., & Macůrek, L. (2020) · Cells · doi:10.3390/cells9092068 · Cited by 6
Therapeutic Synergy in Esophageal Cancer and Mesothelioma Is Predicted by Dynamic BH3 Profiling
Surman, D. R., Xu, Y., Lee, M.-J., Trepel, J. B., Brown, K., Ramineni, M., Splawn, T. G., Diggs, L. P., Hodges, H. C., Davis, J. L., et al. (2021) · Molecular Cancer Therapeutics · doi:10.1158/1535-7163.mct-20-0887 · Cited by 6
TRAIL causes deletions at the HPRT and TK1 loci of clonogenically competent cells
Miles, M. A., Shekhar, T. M., Hall, N. E., & Hawkins, C. J. (2016) · Mutation research. Fundamental and molecular mechanisms of mutagenesis · doi:10.1016/j.mrfmmm.2016.02.006 · Cited by 6
Li, Z., Liu, C., Ma, S., Zhang, D., & Yamaguchi, Y. (2016) · Analytical Methods · doi:10.1039/c5ay02705e · Cited by 6
Metadata
- Authors
- Tang, H. L., Tang, H. M., Mak, K. H., Hu, S., Wang, S. S., Wong, K. M., Wong, C. S. T., Wu, H. Y., Law, H. T., Liu, K., Talbot, C. C., Lau, W. K., Montell, D. J., & Fung, M. C.
- Affiliations
- Johns Hopkins University (US)
- Chinese University of Hong Kong (HK)
- School of Life Sciences, Chinese University of Hong Kong, Shatin, Hong Kong
- Corresponding author
- Tang, Ho Lam
- Montell, Denise J.
- Fung, Ming Chiu
- Venue
- Molecular Biology of the Cell
- Published
- 2012-06-15
- Volume
- 23
- Issue
- 12
- Pages
- 2240-2252
- ISSN
- 1059-1524 (ISSN-L)
- 1939-4586
- PMC
- PMC3374744
- OpenAlex
- W2166525237
- Cited by
- 293
- References
- 62
- Citations by year
- 2026: 18 · 2025: 22 · 2024: 31 · 2023: 25 · 2022: 26 · 2021: 16 · 2020: 24 · 2019: 28 · 2018: 27 · 2017: 20 · 2016: 14 · 2015: 20 · 2014: 13 · 2013: 3 · 2012: 5
- FWCI
- 5.28
- Type
- journal article
- Language
- en
- Open access
- green
- www.ncbi.nlm.nih.gov
- Licence
- cc-by-nc-sa
- Locations
- Molecular Biology of the Cell (publishedVersion)
- Europe PMC (PubMed Central) (publishedVersion, cc-by-nc-sa)
- PubMed Central (publishedVersion, cc-by-nc-sa)
- PubMed (publishedVersion)
- Funders
- Johns Hopkins University
- National Institute of General Medical Sciences (R01GM46425, R01GM046425)
- National Center for Research Resources (S10RR024550)
- Topics
- Life Sciences › Biochemistry, Genetics and Molecular Biology › Molecular Biology › Cell death mechanisms and regulation
- Life Sciences › Biochemistry, Genetics and Molecular Biology › Cell Biology › Autophagy in Disease and Therapy
- Health Sciences › Medicine › Oncology › Cancer-related Molecular Pathways
- Keywords
- anastasis, oncogenic transformation, DNA damage, caspase-3 activation, mitochondrial fragmentation, cell survival, carcinogenesis, hepatocytes, cardiomyocytes, macrophages, fibroblasts, HeLa cells, brain cells
- MeSH terms
- Ethanol, Animals, Animals, Newborn, Anti-Infective Agents, Local, Antineoplastic Agents, Cell Survival, Cell Transformation, Neoplastic, Cells, Cultured, DNA Damage, HeLa Cells, Humans, Liver, Mice, Inbred BALB C, Microscopy, Fluorescence, Rats, Sprague-Dawley, Apoptosis, Reverse Transcriptase Polymerase Chain Reaction, Oligonucleotide Array Sequence Analysis, Gene Expression Profiling, Myocytes, Cardiac, NIH 3T3 Cells, Depsipeptides, Mice, Rats, Transcriptome
About these checks
Registry, retraction, Cites and statistics results are computed, not judged, with one exception: a printed reference that no index lists is read once by a model before it counts as a citation error. Claims are extracted by a model and kept only when their quote appears verbatim in the text; each cited source is then checked, with a model’s help, for whether it says what the claim relies on. Those verdicts can be wrong — read the claim’s quote and the cited source before relying on one.
Statistics and arithmetic are recomputed, not judged.
Confidence bands are shown only for fields calibrated on our annotated test set. None is calibrated yet, so no band is shown.
What counts as a claim ›How we measure confidence ›How we check this ›
Are you an author, or do you see a problem with this page? Request a review
