

The DOI matches its Crossref record; 6 of the 6 references it cites were found in a registry or an index.
Single-molecule tracking of tau reveals fast kiss-and-hop interaction with microtubules in living neurons
Abstract
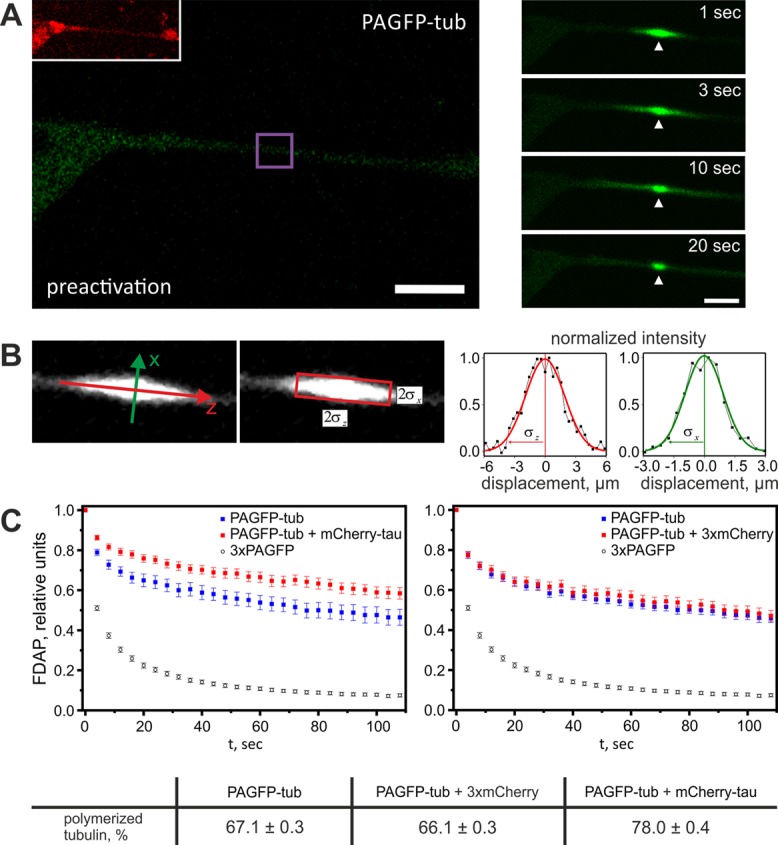
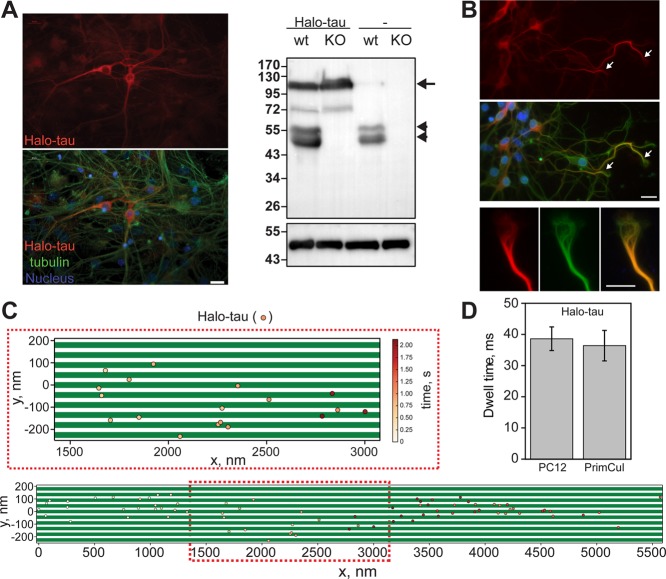
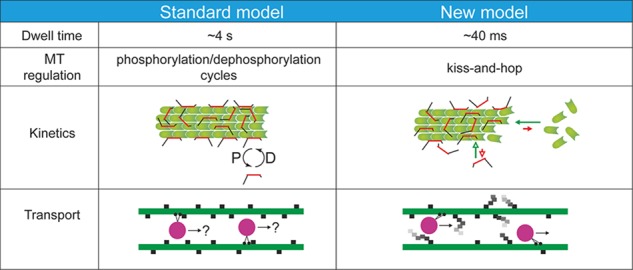
The microtubule-associated phosphoprotein tau regulates microtubule dynamics and is involved in neurodegenerative diseases collectively called tauopathies. It is generally believed that the vast majority of tau molecules decorate axonal microtubules, thereby stabilizing them. However, it is an open question how tau can regulate microtubule dynamics without impeding microtubule-dependent transport and how tau is also available for interactions other than those with microtubules. Here we address this apparent paradox by fast single-molecule tracking of tau in living neurons and Monte Carlo simulations of tau dynamics. We find that tau dwells on a single microtubule for an unexpectedly short time of ∼40 ms before it hops to the next. This dwell time is 100-fold shorter than previously reported by ensemble measurements. Furthermore, we observed by quantitative imaging using fluorescence decay after photoactivation recordings of photoactivatable GFP–tagged tubulin that, despite this rapid dynamics, tau is capable of regulating the tubulin–microtubule balance. This indicates that tau's dwell time on microtubules is sufficiently long to influence the lifetime of a tubulin subunit in a GTP cap. Our data imply a novel kiss-and-hop mechanism by which tau promotes neuronal microtubule assembly. The rapid kiss-and-hop interaction explains why tau, although binding to microtubules, does not interfere with axonal transport.
Overview
The claims and statistics of this paper haven’t been checked yet.
Run the check — free, no account needed. It reads the open-access text and checks the sources it cites.
Integrity signals
Registry
Cites
Statistics
Figures
Verification
Claims the paper makes
The claims and statistics of this paper haven’t been checked yet.
Run the check — free, no account needed. It reads the open-access text and checks the sources it cites.
Claims other papers make about this one
Each is checked against this paper’s own text: does it say what the citing paper says it does?
In the citing paper
“It has been suggested that the binding of Tau to MTs involves both single Tau molecules (Janning et al, 2014) as well as liquid‐condensed forms of Tau (Hernández‐Vega et al, 2017; Tan et al, 2019; reviewed in Mitchison, 2020).”
From Molecular crowding and RNA synergize to promote phase separation, microtubule interaction, and seeding of Tau condensates (2022) · cites this paper as Janning et al, 2014
In the citing paper
“Notably, the interaction of monomeric non‐condensed Tau with MTs is very transient (Janning et al, 2014)”
From Molecular crowding and RNA synergize to promote phase separation, microtubule interaction, and seeding of Tau condensates (2022) · cites this paper as Janning et al, 2014
Self-check
Percentages, sums and reported differences re-computed from the paper’s own numbers.
The self-check needs the paper’s full text.
Citations
Cites
Python for scientific computing
Oliphant, T. E. (2007) · Computing in Science & Engineering · doi:10.1109/mcse.2007.58 · Cited by 3,303 · cited 2×
“The fitting was performed using a self-written Python script (van Rossum and de Boer, 1991; Oliphant, 2007).”
MethodTau-mediated neurodegeneration in Alzheimer’s disease and related disorders
Ballatore, C., Lee, V. M.-Y., & Trojanowski, J. Q. (2007) · Nature Reviews Neuroscience · doi:10.1038/nrn2194 · Cited by 2,174
Cleveland, D. W., Hwo, S.-Y., & Kirschner, M. W. (1977) · Journal of Molecular Biology · doi:10.1016/0022-2836(77)90213-3 · Cited by 915 · cited 2×
“Molecular Biology of the Cell ized tubulin has been determined as 1:5 (Cleveland et al., 1977; Hirokawa et al., 1988).”
BackgroundMorris, M., Maeda, S., Vossel, K., & Mucke, L. (2011) · Neuron · doi:10.1016/j.neuron.2011.04.009 · Cited by 899
Structural Polymorphism of 441-Residue Tau at Single Residue Resolution
Mukrasch, M. D., Bibow, S., Korukottu, J., Jeganathan, S., Biernat, J., Griesinger, C., Mandelkow, E., & Zweckstetter, M. (2009) · PLoS Biology · doi:10.1371/journal.pbio.1000034 · Cited by 652
SnapShot: Pathobiology of Alzheimer's Disease
Selkoe, D. J. (2013) · Cell · doi:10.1016/j.cell.2013.07.003 · Cited by 46
Research works printed but not linked: 47
- Aronov S, 2001, J Neurosci, 21, 6577, 10.1523/JNEUROSCI.21-17-06577.2001 · DOI
- Bakota L, 2012, Mol Genet Genomics, 287, 313, 10.1007/s00438-012-0680-1 · DOI
- Bates DM, 1988, Nonlinear Regression Analysis and Its Applications, 10.1002/9780470316757 · DOI
- Brandt R, 1993, J Biol Chem, 268, 3414, 10.1016/S0021-9258(18)53710-8 · DOI
- Brandt R, 1993, J Neurochem, 61, 997, 10.1111/j.1471-4159.1993.tb03613.x · DOI
- Butner KA, 1991, J Cell Biol, 115, 717, 10.1083/jcb.115.3.717 · DOI · Paper page
- Dawson HN, 2001, J Cell Sci, 114, 1179, 10.1242/jcs.114.6.1179 · DOI · Paper page
- Fath T, 2002, J Neurosci, 22, 9733, 10.1523/JNEUROSCI.22-22-09733.2002 · DOI
- Galbraith JA, 1999, Proc Natl Acad Sci USA, 96, 11589, 10.1073/pnas.96.20.11589 · DOI
- Gardner MK, 2011, Cell, 146, 582, 10.1016/j.cell.2011.06.053 · DOI
- Gauthier-Kemper A, 2011, J Cell Biol, 192, 647, 10.1083/jcb.201007161 · DOI
- Gauthier-Kemper A, 2012, Methods Enzymol, 505, 3, 10.1016/B978-0-12-388448-0.00009-7 · DOI
- Hess ST, 2006, Biophys J, 91, 4258, 10.1529/biophysj.106.091116 · DOI
- Hink MA, 2000, J Biol Chem, 275, 17556, 10.1074/jbc.M001348200 · DOI
- Hinrichs MH, 2012, J Biol Chem, 287, 38559, 10.1074/jbc.M112.369785 · DOI · Paper page
- Hirokawa N, 1988, J Cell Biol, 107, 1449, 10.1083/jcb.107.4.1449 · DOI
- Hirokawa N, 2005, Nat Rev Neurosci, 6, 201, 10.1038/nrn1624 · DOI
- Hundelt M, 2011, Neurobiol Aging, 32, 991, 10.1016/j.neurobiolaging.2009.06.007 · DOI
- Igaev M, 2014, Biophys J
- Irwin DJ, 2013, Nat Rev Neurosci, 14, 626, 10.1038/nrn3549 · DOI
- Ittner LM, 2010, Nat Rev Neurosci, 12, 67, 10.1038/nrn2967 · DOI · Paper page
- Ittner LM, 2010, Cell, 142, 387, 10.1016/j.cell.2010.06.036 · DOI · Paper page
- Jacobs JR, 1986, J Cell Biol, 103, 895, 10.1083/jcb.103.3.895 · DOI
- Jendretzki A, 2009, Mol Genet Genomics, 282, 437, 10.1007/s00438-009-0476-0 · DOI
- 10.1091/mbc.11.4.1213 · DOI
- Kempf M, 1996, J Neurosci, 16, 5583, 10.1523/JNEUROSCI.16-18-05583.1996 · DOI
- Konzack S, 2007, J Neurosci, 27, 9916, 10.1523/JNEUROSCI.0927-07.2007 · DOI
- Litman P, 1993, Neuron, 10, 627, 10.1016/0896-6273(93)90165-N · DOI
- Lorberg A, 2001, Mol Genet Genomics, 266, 514, 10.1007/s004380100580 · DOI
- Los GV, 2008, ACS Chem Biol, 3, 373, 10.1021/cb800025k · DOI · Paper page
- Maeder CI, 2007, Nat Cell Biol, 9, 1319, 10.1038/ncb1652 · DOI
- Michelman-Ribeiro A, 2009, Biophys J, 97, 337, 10.1016/j.bpj.2009.04.027 · DOI
- Mylonas E, 2008, Biochem, 47, 10345, 10.1021/bi800900d · DOI · Paper page
- Newton AC, 1995, J Biol Chem, 270, 28495, 10.1074/jbc.270.48.28495 · DOI
- Popov S, 1992, J Neurosci, 12, 77, 10.1523/JNEUROSCI.12-01-00077.1992 · DOI
- Seeger MA, 2010, J Biol Chem, 285, 8155, 10.1074/jbc.M109.068247 · DOI
- Sergé A, 2008, Nat Methods, 5, 687, 10.1038/nmeth.1233 · DOI · Paper page
- Spillantini MG, 2013, Lancet Neurol, 12, 609, 10.1016/S1474-4422(13)70090-5 · DOI · Paper page
- Sprague BL, 2004, Biophys J, 86, 3473, 10.1529/biophysj.103.026765 · DOI · Paper page
- Swaminathan R, 1996, Biophys J, 71, 1140, 10.1016/S0006-3495(96)79316-5 · DOI
- Tulu US, 2003, Curr Biol, 13, 1894, 10.1016/j.cub.2003.10.002 · DOI
- VandeVondele S, 2003, Biotechnol Bioeng, 82, 784, 10.1002/bit.10625 · DOI
- Van Rossum G, 1991, CWI Q, 4, 283
- Weimann L, 2013, PLoS One, 8, e64287, 10.1371/journal.pone.0064287 · DOI
- Weissmann C, 2009, Traffic, 10, 1655, 10.1111/j.1600-0854.2009.00977.x · DOI
- Wilmes S, 2012, Angew Chem, 124, 4952, 10.1002/ange.201200853 · DOI
- Yuan A, 2008, J Neurosci, 28, 1682, 10.1523/JNEUROSCI.5242-07.2008 · DOI
Cited by
Arendt, T., Stieler, J. T., & Holzer, M. (2016) · Brain Research Bulletin · doi:10.1016/j.brainresbull.2016.08.018 · Cited by 609
Local Nucleation of Microtubule Bundles through Tubulin Concentration into a Condensed Tau Phase
Hernández-Vega, A., Braun, M., Scharrel, L., Jahnel, M., Wegmann, S., Hyman, B. T., Alberti, S., Diez, S., & Hyman, A. A. (2017) · Cell Reports · doi:10.1016/j.celrep.2017.08.042 · Cited by 395
“…with itself, are likely contributing to the liquid-like behavior of the tau encapsulation, the nucleation of new microtubules, and the formation of microtubule bundles (Igaev et al., 2014; Janning et al., 2014; Kadavath et al., 2015; Li et al., 2015; Li and Rhoades, 2017; Melo et al., 2016).”
BackgroundAlzheimer's disease and type 2 diabetes: a critical assessment of the shared pathological traits
Chatterjee, S., & Mudher, A. (2018) · Frontiers in Neuroscience · doi:10.3389/fnins.2018.00383 · Cited by 270
Tau: Enabler of diverse brain disorders and target of rapidly evolving therapeutic strategies
Chang, C.-W., Shao, E., & Mucke, L. (2021) · Science · doi:10.1126/science.abb8255 · Cited by 263
Tau Does Not Stabilize Axonal Microtubules but Rather Enables Them to Have Long Labile Domains
Qiang, L., Sun, X., Austin, T. O., Muralidharan, H., Jean, D. C., Liu, M., Yu, W., & Baas, P. W. (2018) · Current Biology · doi:10.1016/j.cub.2018.05.045 · Cited by 222
Metadata
- Authors
- Janning, D., Igaev, M., Sündermann, F., Brühmann, J., Beutel, O., Heinisch, J. J., Bakota, L., Piehler, J., Junge, W., & Brandt, R.
- Venue
- Molecular Biology of the Cell
- Published
- 2014-11-05
- Volume
- 25
- Issue
- 22
- Pages
- 3541-3551
- ISSN
- 1059-1524
- 1939-4586
- PMC
- PMC4230615
- Cited by
- 176
- References
- 6
- Language
- en
About these checks
Registry, retraction, Cites and statistics results are computed, not judged, with one exception: a printed reference that no index lists is read once by a model before it counts as a citation error. Claims are extracted by a model and kept only when their quote appears verbatim in the text; each cited source is then checked, with a model’s help, for whether it says what the claim relies on. Those verdicts can be wrong — read the claim’s quote and the cited source before relying on one.
Statistics and arithmetic are recomputed, not judged.
Confidence bands are shown only for fields calibrated on our annotated test set. None is calibrated yet, so no band is shown.
What counts as a claim ›How we measure confidence ›How we check this ›
Are you an author, or do you see a problem with this page? Request a review
Data sources
Bibliographic data: Semantic Scholar, OpenAlex, Crossref.
Contains information from the Semantic Scholar Academic Graph Datasets, made available under the ODC Attribution License (ODC-BY 1.0).
Semantic Scholar’s data is described in: Kinney, R., et al. (2023). The Semantic Scholar Open Data Platform. arXiv:2301.10140.
