

STAT3 controls COL1A2 enhancer activation cooperatively with JunB, regulates type I collagen synthesis posttranscriptionally, and is essential for lung myofibroblast differentiation
Open accessThe DOI matches its Crossref record; 33 of the 33 references it cites were found in a registry or an index.
Abstract
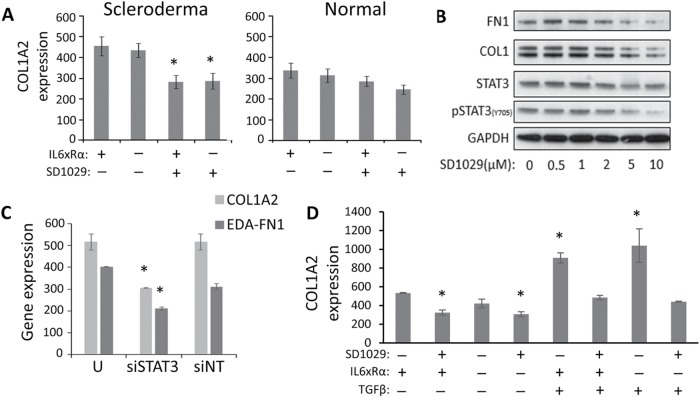
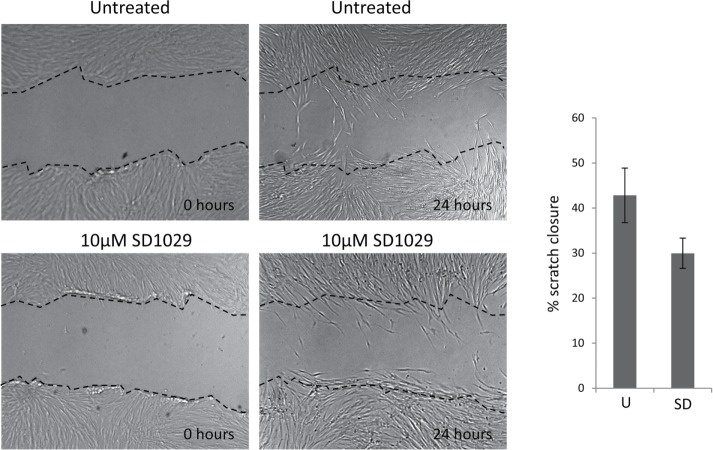
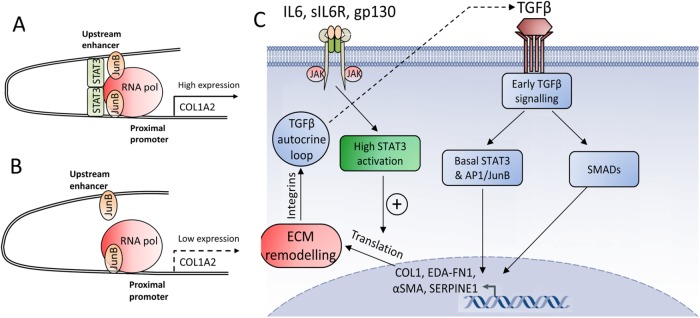
Fibroblast differentiation is a key cellular process that underlies the process of fibrosis, a deadly complication of fibrotic diseases like scleroderma (SSc). This transition coincides with the overproduction of collagen type I (COL1) and other extracellular matrix proteins. High-level expression of the collagen type 1α2 subunit (COL1A2), requires the engagement of a far-upstream enhancer, whose activation is strongly dependent on the AP1 factor JunB. We now report that STAT3 also binds the COL1A2 enhancer and is essential for RNA polymerase recruitment, without affecting JunB binding. STAT3 is required for the increased COL1A2 expression observed in myofibroblasts. We also report that TGFβ partially activates STAT3 and show that inhibiting STAT3 potently blocks TGFβ signaling, matrix remodeling, and TGFβ-induced myofibroblast differentiation. Activation of STAT3 with IL6 transsignaling alone, however, only increased COL1A2 protein expression, leaving COL1A2 mRNA levels unchanged. Our results suggest that activated STAT3 is not the limiting factor for collagen enhancer activation in human lung fibroblasts. Yet, a certain threshold level of STAT3 activity is essential to support activation of the COL1A2 enhancer and TGFβ signaling in fibroblasts. We propose that STAT3 operates at the posttranscriptional as well as the transcriptional level.
Overview
The claims and statistics of this paper haven’t been checked yet.
Free: it reads the open-access text and checks the first 5 claims that cite a source we can check. Create a free account to check every claim.
Integrity signals
Registry
Cites
Statistics
Figures




Verification
Claims the paper makes
The claims and statistics of this paper haven’t been checked yet.
Free: it reads the open-access text and checks the first 5 claims that cite a source we can check. Create a free account to check every claim.
Claims other papers make about this one
Each is checked against this paper’s own text: does it say what the citing paper says it does?
The source backs part of the claim, not all of it — or backs it for a different population, condition or comparison.
In the citing paper
“In SSc skin, STAT3 signaling is activated (81) resulting in pro-fibrotic gene expression in fibroblasts; for example, STAT3 regulates collagen type I expression in SSc skin fibroblasts (82). However, of note, in lungs of SSc patients no enhanced STAT3 activation can be observed (82).”
From Unraveling SSc Pathophysiology; The Myofibroblast (2018) · cites this paper as [82]
Experimental — accuracy not yet measured
Self-check
Percentages, sums and reported differences re-computed from the paper’s own numbers.
The self-check needs the paper’s full text.
Citations
Cites
Goecks, J., Nekrutenko, A., Taylor, J., & The Galaxy Team (2010) · Genome Biology · doi:10.1186/gb-2010-11-8-r86 · Cited by 3,453 · cited 1×
“The degree of conservation for each site was checked using the Galaxy UCSC genome browser (Giardine et al., 2005, Goecks et al., 2010).”
MethodTGF-β signaling and the fibrotic response
Leask, A., & Abraham, D. J. (2004) · The FASEB Journal · doi:10.1096/fj.03-1273rev · Cited by 2,319 · cited 5×
“Transforming growth factor β (TGFβ) is the master regulator of wound healing and the gene expression program drives myofibroblast differentiation and function (e.g., CTGF, COL1, α-SMA, EDA-fibronectin; Leask and Abraham, 2004).”
BackgroundInfluentialSelf-citationTRANSFAC(R) and its module TRANSCompel(R): transcriptional gene regulation in eukaryotes
Matys, V. (2006) · Nucleic Acids Research · doi:10.1093/nar/gkj143 · Cited by 2,166 · cited 2×
“…factor binding site in silico analysis Analysis of STAT3 binding to the COL1A2 enhancer was carried out using the Transfac Match program (Matys et al., 2016) and the Our results offer a new understanding of the avenues of interaction between profibrotic and inflammatory signaling, which…”
MethodHinz, B., Phan, S. H., Thannickal, V. J., Galli, A., Bochaton-Piallat, M.-L., & Gabbiani, G. (2007) · The American Journal of Pathology · doi:10.2353/ajpath.2007.070112 · Cited by 2,068 · cited 1×
“A key feature of fibroproliferative disorders is the abnormal persistence of myofibroblasts and their excessive proliferation leading to inappropriate connective tissue expansion (Hinz et al., 2007).”
BackgroundGalaxy: A platform for interactive large-scale genome analysis
Giardine, B., Riemer, C., Hardison, R. C., Burhans, R., Elnitski, L., Shah, P., Zhang, Y., Blankenberg, D., Albert, I., Taylor, J., et al. (2005) · Genome Research · doi:10.1101/gr.4086505 · Cited by 2,026 · cited 1×
“The degree of conservation for each site was checked using the Galaxy UCSC genome browser (Giardine et al., 2005, Goecks et al., 2010).”
MethodThe JAK/STAT signaling pathway
Rawlings, J. S., Rosler, K. M., & Harrison, D. A. (2004) · Journal of Cell Science · doi:10.1242/jcs.00963 · Cited by 1,858 · cited 2×
“In addition, JAK-independent activation of STATs by Src and MAPK family members has been described (Rawlings et al., 2004).”
BackgroundHirano, T., Ishihara, K., & Hibi, M. (2000) · Oncogene · doi:10.1038/sj.onc.1203551 · Cited by 1,190 · cited 1×
“In addition to regulating the ECM and growth factor signaling, STAT 3 can contribute to fibrosis through its links to survival and proliferation (Hirano et al., 2000).”
BackgroundSystemic sclerosis: a prototypic multisystem fibrotic disorder
Varga, J., & Abraham, D. (2007) · Journal of Clinical Investigation · doi:10.1172/jci31139 · Cited by 1,163 · cited 10×
“In normal wound healing this is an essential process, allowing wound closure and reformation of lost connective tissue to support reepithelization (Leask and Abraham, 2004; Varga and Abraham, 2007).”
BackgroundInfluentialSelf-citationMathelier, A., Zhao, X., Zhang, A. W., Parcy, F., Worsley-Hunt, R., Arenillas, D. J., Buchman, S., Chen, C.-Y., Chou, A., Ienasescu, H., et al. (2014) · Nucleic Acids Research · doi:10.1093/nar/gkt997 · Cited by 983 · cited 1×
“Jaspar database (Mathelier et al., 2014) using STAT-specific matrices.”
Kojima, Y., Acar, A., Eaton, E. N., Mellody, K. T., Scheel, C., Ben-Porath, I., Onder, T. T., Wang, Z. C., Richardson, A. L., Weinberg, R. A., et al. (2010) · Proceedings of the National Academy of Sciences · doi:10.1073/pnas.1013805107 · Cited by 848 · cited 2×
“…the collagen 1α2 enhancer | 91 naling initiating a self-reinforcing process of ECM modification and integrin signaling activation (Thannickal et al., 2003) that culminates in the creation of a high mechanical tension environment and the establishment of a TGFβ autocrine loop (Kojima et al., 2010).”
Background
Cited by
Tocilizumab in systemic sclerosis: a randomised, double-blind, placebo-controlled, phase 3 trial
Khanna, D., Lin, C. J. F., Furst, D. E., Goldin, J., Kim, G., Kuwana, M., Allanore, Y., Matucci-Cerinic, M., Distler, O., Shima, Y., et al. (2020) · The Lancet Respiratory Medicine · doi:10.1016/s2213-2600(20)30318-0 · Cited by 662
Self-citationBharadwaj, U., Kasembeli, M. M., Robinson, P., & Tweardy, D. J. (2020) · Pharmacological Reviews · doi:10.1124/pr.119.018440 · Cited by 314
Kasembeli, M. M., Bharadwaj, U., Robinson, P., & Tweardy, D. J. (2018) · International Journal of Molecular Sciences · doi:10.3390/ijms19082299 · Cited by 199
“Recent findings demonstrate that, in conjunction with JunB, STAT3 is able to directly control COL1A2 enhancer activation [177].”
BackgroundZhang, J., Wang, D., Wang, L., Wang, S., Roden, A. C., Zhao, H., Li, X., Prakash, Y. S., Matteson, E. L., Tschumperlin, D. J., et al. (2019) · American Journal of Physiology-Lung Cellular and Molecular Physiology · doi:10.1152/ajplung.00301.2018 · Cited by 194
“Recent studies have also implicated a role for JAK2 and STAT3-dependent signaling in lung fibrosis (2, 38, 44, 47, 49, 50) and ECM regulation (44, 67).”
BackgroundFibroblast senescence in the pathology of idiopathic pulmonary fibrosis
Waters, D. W., Blokland, K. E. C., Pathinayake, P. S., Burgess, J. K., Mutsaers, S. E., Prele, C. M., Schuliga, M., Grainge, C. L., & Knight, D. A. (2018) · American Journal of Physiology-Lung Cellular and Molecular Physiology · doi:10.1152/ajplung.00037.2018 · Cited by 163
Unraveling SSc Pathophysiology; The Myofibroblast
van Caam, A., Vonk, M., van den Hoogen, F., van Lent, P., & van der Kraan, P. (2018) · Frontiers in Immunology · doi:10.3389/fimmu.2018.02452 · Cited by 153
“However, of note, in lungs of SSc patients no enhanced STAT3 activation can be observed (82).”
BackgroundWang, T., Jin, H., Hu, J., Li, X., Ruan, H., Xu, H., Wei, L., Dong, W., Teng, F., Gu, J., et al. (2020) · Journal of Experimental & Clinical Cancer Research · doi:10.1186/s13046-020-01650-7 · Cited by 157
Han, D., Gong, H., Wei, Y., Xu, Y., Zhou, X., Wang, Z., & Feng, F. (2023) · Phytomedicine · doi:10.1016/j.phymed.2023.154680 · Cited by 134
Mahmoud, A. M., Desouky, E. M., Hozayen, W. G., Bin-Jumah, M. N., El‐Nahass, E., Soliman, H. A., & Farghali, A. A. (2019) · Biomolecules · doi:10.3390/biom9100528 · Cited by 125
“Recently, STAT3 has been reported to control COL1A2 enhancer activation directly [57].”
BackgroundThe JAK/STAT pathway is activated in systemic sclerosis and is effectively targeted by tofacitinib
Wang, W., Bhattacharyya, S., Marangoni, R. G., Carns, M. A., Dennis‐Aren, K., Yeldandi, A. V., Wei, J., & Varga, J. (2019) · Journal of Scleroderma and Related Disorders · doi:10.1177/2397198319865367 · Cited by 107
Singh, R., Kaundal, R. K., Zhao, B., Bouchareb, R., & Lebeche, D. (2021) · Pharmacological Research · doi:10.1016/j.phrs.2020.105414 · Cited by 95
Interleukin-31 promotes fibrosis and T helper 2 polarization in systemic sclerosis
Kuzumi, A., Yoshizaki, A., Matsuda, K. M., Kotani, H., Norimatsu, Y., Fukayama, M., Ebata, S., Fukasawa, T., Yoshizaki‐Ogawa, A., Asano, Y., et al. (2021) · Nature Communications · doi:10.1038/s41467-021-26099-w · Cited by 90
JunB: a paradigm for Jun family in immune response and cancer
Ren, F., Cai, X. T., Yao, Y., & Fang, G.-Y. (2023) · Frontiers in Cellular and Infection Microbiology · doi:10.3389/fcimb.2023.1222265 · Cited by 96
“…no effect on distant metastasis of breast cancer cells, indicating that an altered secretome of JunB-KO CAFs is not the metastatic driver although JunB regulates the proliferation, differentiation and senescence of fi broblasts (Papaioannou et al., 2018; Maity et al., 2021; Wutschka et al., 2021).”
Nalkurthi, C., Schroder, W. A., Melino, M., Irvine, K. M., Nyuydzefe, M., Chen, W., Liu, J., Teng, M. W. L., Hill, G. R., Bertolino, P., et al. (2022) · JHEP Reports · doi:10.1016/j.jhepr.2021.100386 · Cited by 75
“altered functionality of cells of multiple lineages including macrophages.(31,32) Importantly, IL-17 signalling in macrophages drives pSTAT3 and promotes pro-inflammatory cytokine production both in vitro and in vivo.”
BackgroundGao, X., Chan, P. K. S., Lui, G. C.-Y., Hui, D. S. C., Chu, I. M., Sun, X., Tsang, M. S., Chan, B. C.-L., Lam, C. W.-K., & Wong, C. K. (2021) · Cell Death and Disease · doi:10.1038/s41419-020-03283-2 · Cited by 71
Macrophages in Systemic Sclerosis: Novel Insights and Therapeutic Implications
Toledo, D. M., & Pioli, P. A. (2019) · Current Rheumatology Reports · doi:10.1007/s11926-019-0831-z · Cited by 64
Noncoding RNAs: Master Regulator of Fibroblast to Myofibroblast Transition in Fibrosis
Zhang, H., Zhou, Y., Wen, D., & Wang, J. (2023) · International Journal of Molecular Sciences · doi:10.3390/ijms24021801 · Cited by 57
“found that STAT3 can bind to the COL1A2 gene simultaneously with JunB as an enhancer, recruit RNA polymerase to promote COL1A2 expression and regulate fibroblasts to differentiate into myofibroblasts [106].”
BackgroundOh, R. S., Haak, A. J., Smith, K. M. J., Ligresti, G., Choi, K. M., Xie, T., Wang, S., Walters, P. R., Thompson, M. A., Freeman, M. R., et al. (2018) · Journal of Cell Science · doi:10.1242/jcs.209932 · Cited by 56
“These results are consistent with the recent demonstration of an essential role for STAT3 as an enhancer of COL1A2 expression (Papaioannou et al., 2018).”
ResultGonzalez‐Molina, J., Moyano‐Galceran, L., Single, A., Gultekin, O., Alsalhi, S., & Lehti, K. (2022) · Seminars in Cancer Biology · doi:10.1016/j.semcancer.2022.03.012 · Cited by 59
Bisserier, M., Milara, J., Abdeldjebbar, Y., Gubara, S. M., Jones, C. R., Bueno‐Betí, C., Chepurko, E., Kohlbrenner, E., Katz, M. G., Tarzami, S. T., et al. (2019) · Molecular Therapy · doi:10.1016/j.ymthe.2019.11.027 · Cited by 52
Faletti, L. E., Ehl, S. R., & Heeg, M. (2021) · Biomedical Journal · doi:10.1016/j.bj.2021.03.003 · Cited by 49
“[77] Papaioannou I, Xu S, Denton CP, Abraham DJ, Ponticos M.”
BackgroundDieterich, W., Neurath, M. F., & Zopf, Y. (2020) · Scientific Reports · doi:10.1038/s41598-020-60521-5 · Cited by 51
Matsuzaki, S., Pouly, J. L., & Canis, M. J. (2022) · Human Reproduction · doi:10.1093/humrep/deac098 · Cited by 40
Exploiting the STAT3 Nexus in Cancer-Associated Fibroblasts to Improve Cancer Therapy
Allam, A. H., Yakou, M. H., Pang, L., Ernst, M., & Huynh, J. (2021) · Frontiers in Immunology · doi:10.3389/fimmu.2021.767939 · Cited by 42
“COLA12 is essential for collagen deposition by human lung myofibroblasts (40), which highlights the role of STAT3 in collagen deposition.”
BackgroundImmunosuppressive tumor microenvironment and uterine fibroids: Role in collagen synthesis
El-Fattah, E. E. A., Michel, R., & Borahay, M. A. (2023) · Cytokine & Growth Factor Reviews · doi:10.1016/j.cytogfr.2023.10.002 · Cited by 37
Romano, E., Rosa, I., Fioretto, B. S., Matucci‐Cerinic, M., & Manetti, M. (2021) · Life · doi:10.3390/life11070610 · Cited by 40
Xu, Q., Liu, Y., Pan, H., Xu, T., Li, Y., Yuan, J., Li, P., Yao, W., Yan, W., & Ni, C. (2019) · Toxicology · doi:10.1016/j.tox.2019.01.007 · Cited by 32
Type I collagen structure, synthesis, and regulation
Bou–Gharios, G., Abraham, D., & Crombrugghe, B. D. (2019) · Elsevier eBooks · doi:10.1016/b978-0-12-814841-9.00013-0 · Cited by 49
Self-citationFeng, Q., Gu, J., Chen, J., Zheng, W., Pan, H., Xu, X., Deng, C., & Yang, B. (2022) · Experimental Dermatology · doi:10.1111/exd.14623 · Cited by 26
Song, D., Kim, D., Jung, J. W., Nam, S. H., Kim, J. E., Kim, H., Kim, J. H., Pan, C., Kim, S., & Lee, S. E. (2018) · Frontiers in Pharmacology · doi:10.3389/fphar.2018.01337 · Cited by 26
“STAT3 is essential for activation of the COL1A2 enhancer (Papaioannou et al., 2018).”
BackgroundNguyen, X.-X., Renaud, L., & Feghali‐Bostwick, C. A. (2021) · International Journal of Molecular Sciences · doi:10.3390/ijms222212609 · Cited by 23
“In the hIGFBP5 pFBs, Stat3 was upregulated, a signature that leads to lung myofibroblast differentiation and the production of collagen type 1 and ECM [38,39].”
BackgroundThe Role of Pro-fibrotic Myofibroblasts in Systemic Sclerosis: From Origin to Therapeutic Targeting
Romano, E., Rosa, I., Fioretto, B. S., Matucci‐Cerinic, M., & Manetti, M. (2021) · Current Molecular Medicine · doi:10.2174/0929867328666210325102749 · Cited by 26
Elucidating the cellular mechanism for E2-induced dermal fibrosis
Frost, D. B., Savchenko, A., Ogunleye, A. A., Armstrong, M. B., & Feghali‐Bostwick, C. A. (2021) · Arthritis Research & Therapy · doi:10.1186/s13075-021-02441-x · Cited by 19
Hoffman, K. A., Villar, M. J., Poveda, C., Bottazzi, M. E., Hotez, P. J., Tweardy, D. J., & Jones, K. M. (2021) · Frontiers in Cellular and Infection Microbiology · doi:10.3389/fcimb.2021.708325 · Cited by 23
“Critical pro-fibrotic genes upregulated by activated STAT3 include Type I collagen, a key component of fibrosis (Papaioannou et al., 2018).”
BackgroundG Protein-Coupled Receptor Kinase 2 as Novel Therapeutic Target in Fibrotic Diseases
Li, N., Shan, S., Li, X., Chen, T., Meng, Q., Zhang, S., Wang, Z., Zhang, L., Wei, W., & Sun, W. (2022) · Frontiers in Immunology · doi:10.3389/fimmu.2021.822345 · Cited by 19
“Upon activation, STAT3 is involved in fibrosis through enhancing ECM production (50).”
BackgroundPreclinical advances and the immunophysiology of a new therapeutic Chagas disease vaccine
Jones, K. M., Poveda, C., Versteeg, L., Bottazzi, M. E., & Hotez, P. J. (2022) · Expert Review of Vaccines · doi:10.1080/14760584.2022.2093721 · Cited by 18
“(COL1A2), leading to increased production of collagen type 1, a hallmark of fibrosis [165].”
BackgroundPin1 Plays Essential Roles in NASH Development by Modulating Multiple Target Proteins
Inoue, M.-K., Nakatsu, Y., Yamamotoya, T., Hasei, S., Kanamoto, M., Naitou, M., Matsunaga, Y., Sakoda, H., Fujishiro, M., Ono, H., et al. (2019) · Cells · doi:10.3390/cells8121545 · Cited by 16
“Recent studies have shown that the complex of STAT3 and JunB can directly control activation of the COL1A2 enhancer [96,97].”
BackgroundLedesma, S. N. (2025) · Journal of Clinical Medicine · doi:10.3390/jcm14051780 · Cited by 20
“Activation of STAT proteins, such as STAT3, has been implicated in promoting fibroblast proliferation and collagen production, exacerbating fibrotic responses [33].”
Saleh, M. A., Awad, A. M. B., Ibrahim, T. M., & Abu‐Elsaad, N. (2020) · Pharmaceuticals · doi:10.3390/ph13110397 · Cited by 14
“In various experimental and human nephropathies, signal transducer and activator of transcription (STAT3) activation has been reported in the injured kidney, showing a profibrogenic role [18].”
BackgroundJalali, B. M., Likszo, P., & Łukasik, K. (2022) · Biology of Reproduction · doi:10.1093/biolre/ioac163 · Cited by 15
“Alternatively, STAT3 can influence the expression of many genes without directly affecting their transcriptional activity [16, 51].”
BackgroundCurcumin modulates airway remodelling‐contributing genes—the significance of transcription factors
Wieczfińska, J., Sitarek, P., Kowalczyk, T., Rieske, P., & Pawliczak, R. (2021) · Journal of Cellular and Molecular Medicine · doi:10.1111/jcmm.17102 · Cited by 14
Steffen, D., Avey, A. M., Mienaltowski, M. J., & Baar, K. (2023) · The Journal of Physiology · doi:10.1113/jp284393 · Cited by 16
Anti‐fibrotic effect of ciglitazone in HRV‐induced airway remodelling cell model
Wieczfińska, J., & Pawliczak, R. (2023) · Journal of Cellular and Molecular Medicine · doi:10.1111/jcmm.17790 · Cited by 12
Chen, D., Zheng, G., Yang, Q., Luo, L., & Shen, J. (2021) · Respiratory Research · doi:10.1186/s12931-021-01858-x · Cited by 12
“However, the persistent activation of STAT3 induces the overexpression of fibrotic and ECM-associated genes, and finally lead to fibrosis [38, 39].”
BackgroundM2 macrophage infusion ameliorates diabetic glomerulopathy via the JAK2/STAT3 pathway in db/db mice
Gu, Y., Yu, S., Gu, W., Li, B., Xue, J., Liu, J., Zhang, Q., Yin, Y., Zhang, H., Guo, Q., et al. (2024) · Renal Failure · doi:10.1080/0886022x.2024.2378210 · Cited by 12
“Although STAT3 plays a vital role in cell survival and proliferation, persistent activation of STAT3 is associated with various pathological conditions, including inflammation and fibrosis [39,40], and STAT3 induces collagen production [39,41,42].”
BackgroundWieczfińska, J., & Pawliczak, R. (2022) · International Journal of Molecular Sciences · doi:10.3390/ijms23158413 · Cited by 10
“STAT3 is a transcription factor for fibrotic genes such as collagen I and α-SMA [42,54].”
BackgroundPlaisancié, P., Buisson, C., Fouché, E., Martin, P., Noirot, C., Maslo, C., Dupuy, J., Guéraud, F., & Pierre, F. H. F. (2022) · PLoS ONE · doi:10.1371/journal.pone.0273858 · Cited by 9
Dai, X., Zheng, H.-L., Ma, Y.-X., Wang, Y., Wang, M.-Q., Cai, H., Hu, Z., Wan, J., & Zhang, L. (2024) · Frontiers in Bioscience-Landmark · doi:10.31083/j.fbl2902062 · Cited by 10
“High expression levels of COL1A2 require the engagement of a far-upstream enhancer whose activation is strongly dependent on the AP1 factor JunB [43].”
BackgroundMatsuda, M., Fujiwara, Y., Yonezawa, F., Matsuo, K., Ishizu, E., Shimora, H., Shimizu, S., Kitatani, K., Kaibori, Y., Yamagishi, N., et al. (2025) · The Journal of Immunology · doi:10.1093/jimmun/vkaf171 · Cited by 8
Ise, H., Araki, Y., Song, I., & Akatsuka, G. (2022) · Glycobiology · doi:10.1093/glycob/cwac067 · Cited by 7
Hepatic organoids move from adolescence to maturity
Guan, Y., & Peltz, G. (2024) · Liver International · doi:10.1111/liv.15893 · Cited by 6
“Prior in vitro analyses investigating how human myofibroblasts are generated have used cell lines, 40–42 explanted cells or iPSC differentiated FIGURE 2 Top : Production of a multilineage hepatic organoid.”
BackgroundMalik, M., Britten, J., DeAngelis, A., & Catherino, W. H. (2020) · F&S Science · doi:10.1016/j.xfss.2020.07.005 · Cited by 5
Zeng, X., Hu, J., Yan, M., Xie, C., Xu, W., Hu, Q., Feng, J., Gu, Z. C., & Fu, Y. (2021) · Aging · doi:10.18632/aging.203570 · Cited by 2
“JUNB, which is strongly dependent on the AP1 factor, could regulate collagen type 1 and collagen type II in pulmonary fibrosis [29].”
BackgroundIdentification of the molecular mechanism and candidate markers for diabetic nephropathy
Chen, C., Liu, L., & Luo, J. (2022) · Annals of Translational Medicine · doi:10.21037/atm-22-5128 · Cited by 2
“Also, the high expression of COL1A2 promotes the differentiation of fibroblasts (34).”
Pan, H., Zhao, Z., Zhu, Y., Gao, Y., Ruan, H., Huang, Y., Chi, P., & Huang, S. (2024) · Journal of Proteomics · doi:10.1016/j.jprot.2024.105287 · Cited by 1
Kumarasamy, S., Belew, G. D., Portuphy, A. O., Abdolahipour, R., Zaidi, S., Yang, H., Russo, L., Ghanem, S. S., Gohara, A. F., Malgor, R., et al. (2025) · bioRxiv (Cold Spring Harbor Laboratory) · doi:10.1101/2025.11.23.690002 · Cited by 1
“59 The rise of plasma IL6 levels starting at 12 months of age could activate Stat3 in the kidneys of 15-month-old Cc2 –/– mice to contribute to collagen production and cell proliferation, leading to mesangial expansion and thickening of the glomerular basement membrane, as supported by elevated…”
Lee, H.-S., Huang, K., Hua, H.-S., Chen, B.-C., & Lin, C. (2024) · SSRN Electronic Journal · doi:10.2139/ssrn.5020079
JunB orchestrates macrophage-fibroblast crosstalk in silica nanoparticle-induced pulmonary fibrosis
Li, F., Song, D., Meng, J., Tian, J., Li, N., Zheng, Y., Zhang, Z., Yun, X., Li, Z., Sun, H., et al. (2025) · Ecotoxicology and Environmental Safety · doi:10.1016/j.ecoenv.2025.119046
Park, J., Kim, T., Shim, W. S., Hong, S. E., Park, M., Oh, S., Koo, B. K., Lee, D. H., Joo, S. K., Yoo, T., et al. (2026) · Signal Transduction and Targeted Therapy · doi:10.1038/s41392-026-02679-4 · Cited by 2
“27 To investigate the collagen-inducing pathway stimulated by ADAMTS4, LX2 cells were treated with ADAMTS4 in a time-dependent manner, and the phosphorylation of each signaling kinase was evaluated.”
Torok, K. S., & Foeldvari, I. (2026) · Elsevier eBooks · doi:10.1016/b978-0-443-11980-4.00031-3
Immunosenescence in Idiopathic Pulmonary Fibrosis
Xiao, S., Li, Z., Zhang, H., Cai, W., Yu, S., & Song, X. (2026) · Journal of Inflammation Research · doi:10.2147/jir.s586167
Zheng, T., Li, H., Yao, L., Zhang, Y., Feng, L., & Yang, D. (2026) · Cells · doi:10.3390/cells15171624
Cellular signaling meets bacterial infection: the integrative role of STAT3
McCoy, J. R., Weinstein, K. H., Warwick, P. A., & McBride, J. W. (2026) · Frontiers in Cellular and Infection Microbiology · doi:10.3389/fcimb.2026.1826683
“…interact with several transcription factors including JunB, CBP/p300, NCoA/SRC1a, and Crif1 to bind IFN-g activated sequence (GAS) motifs and TTCCC/GGGAA motifs to modulate host transcription (Giraud et al., 2002; Kwon et al., 2008; Yang et al., 2010; Papaioannou et al., 2018; Zhou and Chen, 2021).”
Su, S., Chen, Z., Ye, Y., Yin, W., Li, F., & Liu, A. (2026) · Journal of Clinical and Experimental Hepatology · doi:10.1016/j.jceh.2026.103685
Metadata
- Authors
- Papaioannou, I., Xu, S., Denton, C. P., Abraham, D. J., & Ponticos, M.
- Affiliations
- University College London (GB)
- Corresponding author
- Ponticos, Markella
- Venue
- Molecular Biology of the Cell
- Published
- 2018-01-15
- Volume
- 29
- Issue
- 2
- Pages
- 84-95
- ISSN
- 1059-1524 (ISSN-L)
- 1939-4586
- PMC
- PMC5909935
- OpenAlex
- W2769262718
- Cited by
- 64
- References
- 33
- Citations by year
- 2026: 6 · 2025: 4 · 2024: 5 · 2023: 6 · 2022: 10 · 2021: 14 · 2020: 6 · 2019: 8 · 2018: 5
- FWCI
- 2.29
- Type
- journal article
- Language
- en
- Open access
- green
- www.ncbi.nlm.nih.gov
- Licence
- cc-by-nc-sa
- Locations
- Molecular Biology of the Cell (publishedVersion)
- Europe PMC (PubMed Central) (publishedVersion, cc-by-nc-sa)
- PubMed Central (publishedVersion, cc-by-nc-sa)
- PubMed (publishedVersion)
- UCL Discovery (University College London) (submittedVersion)
- Funders
- Rosetrees Trust (M96-F1)
- Versus Arthritis (19427, 18420)
- Topics
- Life Sciences › Immunology and Microbiology › Immunology › Cytokine Signaling Pathways and Interactions
- Health Sciences › Medicine › Rheumatology › Systemic Sclerosis and Related Diseases
- Life Sciences › Biochemistry, Genetics and Molecular Biology › Molecular Biology › TGF-β signaling in diseases
- Keywords
- STAT3, COL1A2, type I collagen, enhancer activation, JunB, AP-1, myofibroblast differentiation, lung fibroblasts, TGF-beta signaling, post-transcriptional regulation, RNA polymerase recruitment, extracellular matrix remodeling, systemic sclerosis, fibrosis
- MeSH terms
- Cell Differentiation, Cells, Cultured, Enhancer Elements, Genetic, Fibrosis, Gene Expression Regulation, Humans, Lung, Transcription Factors, Signal Transduction, Interleukin-6, Transforming Growth Factor beta, Collagen Type I, STAT3 Transcription Factor, Myofibroblasts
About these checks
Registry, retraction, Cites and statistics results are computed, not judged, with one exception: a printed reference that no index lists is read once by a model before it counts as a citation error. Claims are extracted by a model and kept only when their quote appears verbatim in the text; each cited source is then checked, with a model’s help, for whether it says what the claim relies on. Those verdicts can be wrong — read the claim’s quote and the cited source before relying on one.
Statistics and arithmetic are recomputed, not judged.
Confidence bands are shown only for fields calibrated on our annotated test set. None is calibrated yet, so no band is shown.
What counts as a claim ›How we measure confidence ›How we check this ›
Are you an author, or do you see a problem with this page? Request a review
Data sources
Bibliographic data: Semantic Scholar, OpenAlex, Crossref.
Contains information from the Semantic Scholar Academic Graph Datasets, made available under the ODC Attribution License (ODC-BY 1.0).
Semantic Scholar’s data is described in: Kinney, R., et al. (2023). The Semantic Scholar Open Data Platform. arXiv:2301.10140.
