

Multimodal contrastive learning for spatial gene expression prediction using histology images
Open accessThe DOI matches its Crossref record; 43 of the 44 references it cites were found in a registry or an index.
Abstract
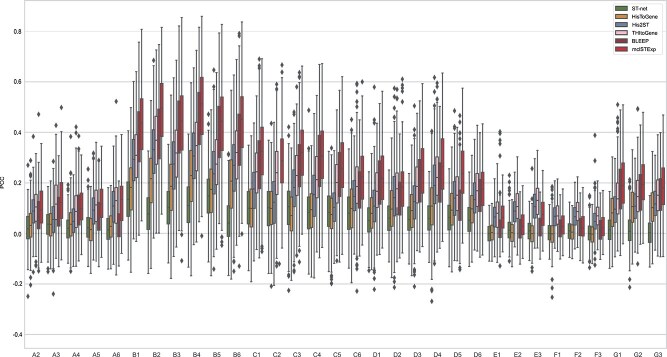
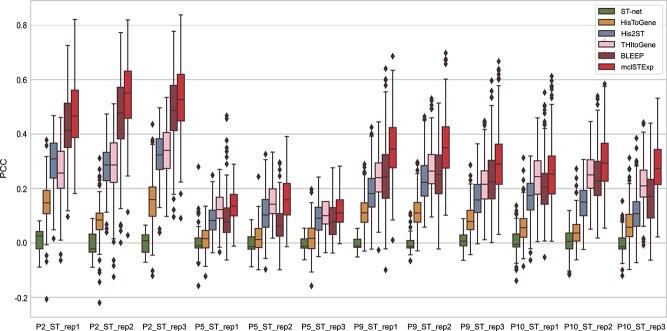
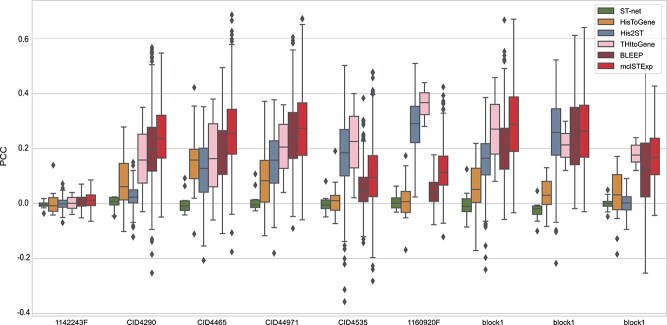
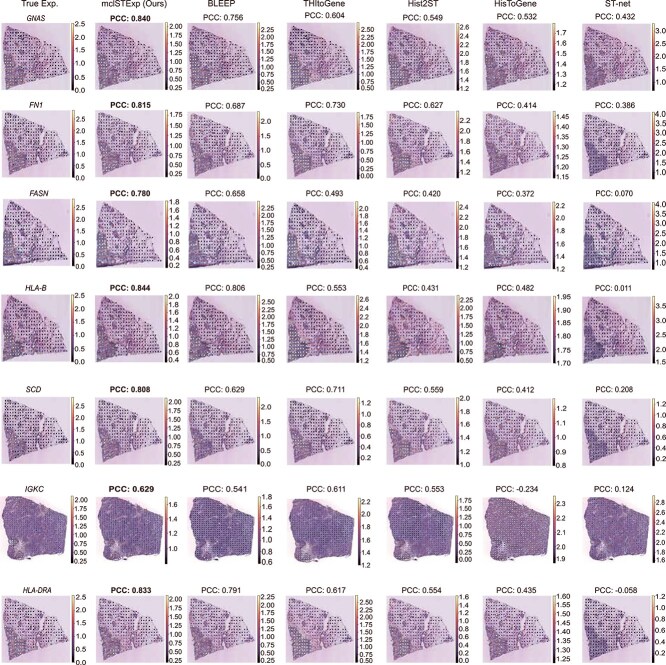
In recent years, the advent of spatial transcriptomics (ST) technology has unlocked unprecedented opportunities for delving into the complexities of gene expression patterns within intricate biological systems. Despite its transformative potential, the prohibitive cost of ST technology remains a significant barrier to its widespread adoption in large-scale studies. An alternative, more cost-effective strategy involves employing artificial intelligence to predict gene expression levels using readily accessible whole-slide images stained with Hematoxylin and Eosin (H&E). However, existing methods have yet to fully capitalize on multimodal information provided by H&E images and ST data with spatial location. In this paper, we propose mclSTExp, a multimodal contrastive learning with Transformer and Densenet-121 encoder for Spatial Transcriptomics Expression prediction. We conceptualize each spot as a “word”, integrating its intrinsic features with spatial context through the self-attention mechanism of a Transformer encoder. This integration is further enriched by incorporating image features via contrastive learning, thereby enhancing the predictive capability of our model. We conducted an extensive evaluation of highly variable genes in two breast cancer datasets and a skin squamous cell carcinoma dataset, and the results demonstrate that mclSTExp exhibits superior performance in predicting spatial gene expression. Moreover, mclSTExp has shown promise in interpreting cancer-specific overexpressed genes, elucidating immune-related genes, and identifying specialized spatial domains annotated by pathologists. Our source code is available at https://github.com/shizhiceng/mclSTExp.
Overview
The claims and statistics of this paper haven’t been checked yet.
Free: it reads the open-access text and checks the first 5 claims that cite a source we can check. Create a free account to check every claim.
Integrity signals
Registry
Cites
Statistics
Figures

Verification
Claims the paper makes
The claims and statistics of this paper haven’t been checked yet.
Free: it reads the open-access text and checks the first 5 claims that cite a source we can check. Create a free account to check every claim.
Claims other papers make about this one
Each is checked against this paper’s own text: does it say what the citing paper says it does?
The source backs part of the claim, not all of it — or backs it for a different population, condition or comparison.
In the citing paper
“mclSTExp integrates image features with spatial context via a Transformer encoder, achieving superior performance in predicting highly variable genes in breast cancer and skin squamous cell carcinoma datasets (Min et al., 2024).”
From Spatial pharmacology of anti-cancer immunomodulators: a comprehensive review (2026) · cites this paper as Min et al., 2024
Experimental — accuracy not yet measuredIn the citing paper
“Several studies have explored predicting gene expression from H&E images using AI models59–62.”
From A visual–omics foundation model to bridge histopathology with spatial transcriptomics (2025) · cites this paper as [62]
Self-check
Percentages, sums and reported differences re-computed from the paper’s own numbers.
The self-check needs the paper’s full text.
Citations
Cites
Deep Residual Learning for Image Recognition
He, K., Zhang, X., Ren, S., & Sun, J. (2016) · 2016 IEEE Conference on Computer Vision and Pattern Recognition (CVPR) · doi:10.1109/cvpr.2016.90 · Cited by 235,474
Densely Connected Convolutional Networks
Huang, G., Liu, Z., Van Der Maaten, L., & Weinberger, K. Q. (2017) · 2017 IEEE Conference on Computer Vision and Pattern Recognition (CVPR) · doi:10.1109/cvpr.2017.243 · Cited by 48,566
Learning Transferable Visual Models From Natural Language Supervision
Radford, A., Kim, J. W., Hallacy, C., Ramesh, A., Goh, G., Agarwal, S., Sastry, G., Askell, A., Mishkin, P., Clark, J., et al. (2021) · arXiv · doi:10.48550/arxiv.2103.00020 · Cited by 15,293
Advances in neural information processing systems 7
(1996) · Computers & Mathematics with Applications · doi:10.1016/s0898-1221(96)90463-0 · Cited by 14,281
A simple framework for contrastive learning of visual representations
Chen, T., Kornblith, S., Norouzi, M., & Hinton, G. (2020) · arXiv · doi:10.48550/arxiv.2002.05709 · Cited by 10,857
Spatiotemporal transcriptomic atlas of mouse organogenesis using DNA nanoball-patterned arrays
Chen, A., Liao, S., Cheng, M., Ma, K., Wu, L., Lai, Y., Qiu, X., Yang, J., Xu, J., Hao, S., et al. (2022) · Cell · doi:10.1016/j.cell.2022.04.003 · Cited by 1,784
A single-cell and spatially resolved atlas of human breast cancers
Wu, S. Z., Al-Eryani, G., Roden, D. L., Junankar, S., Harvey, K., Andersson, A., Thennavan, A., Wang, C., Torpy, J. R., Bartonicek, N., et al. (2021) · Nature Genetics · doi:10.1038/s41588-021-00911-1 · Cited by 1,775
Self-citationExploring tissue architecture using spatial transcriptomics
Rao, A., Barkley, D., França, G. S., & Yanai, I. (2021) · Nature · doi:10.1038/s41586-021-03634-9 · Cited by 1,700
2007 IEEE Conference on Computer Vision and Pattern Recognition
(2007) · doi:10.1109/cvpr12085.2007 · Cited by 1,688
Multimodal Analysis of Composition and Spatial Architecture in Human Squamous Cell Carcinoma
Ji, A. L., Rubin, A. J., Thrane, K., Jiang, S., Reynolds, D. L., Meyers, R. M., Guo, M. G., George, B. M., Mollbrink, A., Bergenstråhle, J., et al. (2020) · Cell · doi:10.1016/j.cell.2020.05.039 · Cited by 1,117 · cited 1×
“• The lower resolution (100 μ m per spot) cSCC dataset [29] contains 12 tissue sections obtained from four patients, with each patient contributing three sections.”
Integrating single-cell and spatial transcriptomics to elucidate intercellular tissue dynamics
Longo, S. K., Guo, M. G., Ji, A. L., & Khavari, P. A. (2021) · Nature Reviews Genetics · doi:10.1038/s41576-021-00370-8 · Cited by 1,059 · cited 1×
“The insights afforded by this technology extend beyond gene expression, offering novel perspectives on cell–cell interactions and molecular signaling pathways within the research domain [4].”
Spatial transcriptomics at subspot resolution with BayesSpace
Zhao, E., Stone, M. R., Ren, X., Guenthoer, J., Smythe, K. S., Pulliam, T., Williams, S. R., Uytingco, C. R., Taylor, S. E. B., Nghiem, P., et al. (2021) · Nature Biotechnology · doi:10.1038/s41587-021-00935-2 · Cited by 1,005
Janesick, A., Shelansky, R., Gottscho, A. D., Wagner, F., Williams, S. R., Rouault, M., Beliakoff, G., Morrison, C. A., Oliveira, M. F., Sicherman, J. T., et al. (2023) · Nature Communications · doi:10.1038/s41467-023-43458-x · Cited by 909
Representation Learning on Graphs with Jumping Knowledge Networks
Xu, K., Li, C., Tian, Y., Sonobe, T., Kawarabayashi, K., & Jegelka, S. (2018) · arXiv (Cornell University) · doi:10.48550/arxiv.1806.03536 · Cited by 891
Dong, K., & Zhang, S. (2022) · Nature Communications · doi:10.1038/s41467-022-29439-6 · Cited by 761
Chen, R. J., Lu, M. Y., Wang, J., Williamson, D. F. K., Rodig, S. J., Lindeman, N. I., & Mahmood, F. (2022) · IEEE Transactions on Medical Imaging · doi:10.1109/tmi.2020.3021387 · Cited by 729
A deep learning model to predict RNA-Seq expression of tumours from whole-slide images
Schmauch, B., Romagnoni, A., Pronier, E., Saillard, C., Maillé, P., Calderaro, J., Kamoun, A., Sefta, M., Toldo, S., Zaslavskiy, M., et al. (2020) · Nature Communications · doi:10.1038/s41467-020-17678-4 · Cited by 533
Spatially resolved transcriptomics and beyond
Crosetto, N., Bienko, M., & van Oudenaarden, A. (2015) · Nature Reviews Genetics · doi:10.1038/nrg3832 · Cited by 509 · cited 1×
“In contrast, whole-slide images (WSIs) [12–14] stained with Hematoxylin and Eosin (H&E) are more readily available, cost-effective, and widely used in clinical practice.”
Integrating spatial gene expression and breast tumour morphology via deep learning
He, B., Bergenstråhle, L., Stenbeck, L., Abid, A., Andersson, A., Borg, Å., Maaskola, J., Lundeberg, J., & Zou, J. (2020) · Nature Biomedical Engineering · doi:10.1038/s41551-020-0578-x · Cited by 507
Artificial intelligence in histopathology: enhancing cancer research and clinical oncology
Shmatko, A., Ghaffari Laleh, N., Gerstung, M., & Kather, J. N. (2022) · Nature Cancer · doi:10.1038/s43018-022-00436-4 · Cited by 446 · cited 1×
“Using H&E images to predict ST gene expression profiles has become a more common and cost-effective research approach [15, 16].”
Expansion sequencing: Spatially precise in situ transcriptomics in intact biological systems
Alon, S., Goodwin, D. R., Sinha, A., Wassie, A. T., Chen, F., Daugharthy, E. R., Bando, Y., Kajita, A., Xue, A. G., Marrett, K., et al. (2021) · Science · doi:10.1126/science.aax2656 · Cited by 419
Cell segmentation in imaging-based spatial transcriptomics
Petukhov, V., Xu, R. J., Soldatov, R. A., Cadinu, P., Khodosevich, K., Moffitt, J. R., & Kharchenko, P. V. (2022) · Nature Biotechnology · doi:10.1038/s41587-021-01044-w · Cited by 412 · cited 1×
“Several methods, such as STnet [21], HisToGene [15], His2ST [22], THItoGene [23], and Bleep [24], have been explored for integrating histopathological images with transcriptomic data.”
Unsupervised spatially embedded deep representation of spatial transcriptomics
Xu, H., Fu, H., Long, Y., Ang, K. S., Sethi, R., Chong, K., Li, M., Uddamvathanak, R., Lee, H. K., Ling, J., et al. (2024) · Genome Medicine · doi:10.1186/s13073-024-01283-x · Cited by 391
Fatty acid synthase (FASN) as a therapeutic target in breast cancer
Menendez, J. A., & Lupu, R. (2017) · Expert Opinion on Therapeutic Targets · doi:10.1080/14728222.2017.1381087 · Cited by 293
Cell clustering for spatial transcriptomics data with graph neural networks
Li, J., Chen, S., Pan, X., Yuan, Y., & Shen, H.-B. (2022) · Nature Computational Science · doi:10.1038/s43588-022-00266-5 · Cited by 230
Inferring super-resolution tissue architecture by integrating spatial transcriptomics with histology
Zhang, D., Schroeder, A., Yan, H., Yang, H., Hu, J., Lee, M. Y. Y., Cho, K. S., Susztak, K., Xu, G. X., Feldman, M. D., et al. (2024) · Nature Biotechnology · doi:10.1038/s41587-023-02019-9 · Cited by 219
Zeng, Y., Wei, Z., Yu, W., Yin, R., Yuan, Y., Li, B., Tang, Z., Lu, Y., & Yang, Y. (2022) · Briefings in Bioinformatics · doi:10.1093/bib/bbac297 · Cited by 211
Spatial transcriptomics: paving the way for tissue-level systems biology
Moor, A. E., & Itzkovitz, S. (2017) · Current Opinion in Biotechnology · doi:10.1016/j.copbio.2017.02.004 · Cited by 160
The adaptive immune system is a major driver of selection for tumor suppressor gene inactivation
Martin, T. D., Patel, R. S., Cook, D. R., Choi, M. Y., Patil, A., Liang, A. C., Li, M. Z., Haigis, K. M., & Elledge, S. J. (2021) · Science · doi:10.1126/science.abg5784 · Cited by 155
From whole-mount to single-cell spatial assessment of gene expression in 3D
Waylen, L. N., Nim, H. T., Martelotto, L. G., & Ramialison, M. (2020) · Communications Biology · doi:10.1038/s42003-020-01341-1 · Cited by 138
Pang, M., Su, K., & Li, M. (2021) · doi:10.1101/2021.11.28.470212 · Cited by 130
THItoGene: a deep learning method for predicting spatial transcriptomics from histological images
Jia, Y., Liu, J., Chen, L., Zhao, T., & Wang, Y. (2023) · Briefings in Bioinformatics · doi:10.1093/bib/bbad464 · Cited by 130
SPACEL: deep learning-based characterization of spatial transcriptome architectures
Xu, H., Wang, S., Fang, M., Luo, S., Chen, C., Wan, S., Wang, R., Tang, M., Xue, T., Li, B., et al. (2023) · Nature Communications · doi:10.1038/s41467-023-43220-3 · Cited by 127
Holder, A. M., Gonzalez-Angulo, A. M., Chen, H., Akçakanat, A., Do, K.-A., Symmans, W. F., Pusztai, L., Hortobágyi, G. N., Mills, G. B., & Meric‐Bernstam, F. (2012) · Breast Cancer Research and Treatment · doi:10.1007/s10549-012-2354-4 · Cited by 119
Deciphering Tumor Ecosystems at Super-Resolution from Spatial Transcriptomics with Tesla
Hu, J., Coleman, K., Zhang, D., Lee, E. B., Kadara, H. N., Wang, L., & Li, M. (2022) · Cell Systems · doi:10.1016/j.cels.2023.03.008 · Cited by 117
Noblejas‐López, M. D. M., Nieto‐Jiménez, C., Morcillo-García, S., Pérez‐Peña, J., Nuncia‐Cantarero, M., Pretel, F. A., Galán‐Moya, E. M., Amir, E., Pandiella, A., Győrffy, B., et al. (2019) · OncoImmunology · doi:10.1080/2162402x.2019.1629780 · Cited by 87
Identification of dysregulated genes in cutaneous squamous cell carcinoma
Dang, C., Gottschling, M., Manning, K., O'Currain, E., Schneider, S., Sterry, W., Stockfleth, E., & Nindl, I. (2006) · Oncology Reports · doi:10.3892/or.16.3.513 · Cited by 77
Jin, X., Zhu, L., Cui, Z., Tang, J., Xie, M., & Ren, G. (2019) · Clinical & Translational Oncology · doi:10.1007/s12094-019-02042-w · Cited by 74
Systematic identification of the key candidate genes in breast cancer stroma
Wang, Y., Xu, H., Zhu, B., Qiu, Z., & Lin, Z. (2018) · Cellular & Molecular Biology Letters · doi:10.1186/s11658-018-0110-4 · Cited by 49
Zhao, C., Xu, Z., Wang, X., Tao, S., MacDonald, W. A., He, K., Poholek, A. C., Chen, K., Huang, H., & Chen, W. (2024) · Briefings in Bioinformatics · doi:10.1093/bib/bbae052 · Cited by 43
Saraiva, D. P., Lopes, S. A., Antunes, A., Salvador, R. M., Borralho, P., Assis, B., Pereira, I. L., Seabra, Z., Negreiros, I., Jacinto, A., et al. (2021) · Cancers · doi:10.3390/cancers13153841 · Cited by 43
Identification of Biomarker for Cutaneous Squamous Cell Carcinoma Using Microarray Data Analysis
Wei, W., Chen, Y., Xu, J., Zhou, Y., Bai, X., Yang, M., & Zhu, J. (2017) · Journal of Cancer · doi:10.7150/jca.21381 · Cited by 28
Prognostic Impact of Immunoglobulin Kappa C (IGKC) in Early Breast Cancer
Schmidt, M., Edlund, K., Hengstler, J. G., Heimes, A.-S., Almstedt, K., Lebrecht, A., Krajnak, S., Battista, M. J., Brenner, W., Hasenburg, A., et al. (2021) · Cancers · doi:10.3390/cancers13143626 · Cited by 26
Research works printed but not linked: 2
- Xie, 2024, Spatially resolved gene expression prediction from histology images via bi-modal contrastive learning, 1
- Dosovitskiy, 2021, An image is worth 16x16 words: transformers for image recognition at scale, 1
Cited by
A visual–omics foundation model to bridge histopathology with spatial transcriptomics
Chen, W., Zhang, P., Tran, T. N., Xiao, Y., Li, S., Shah, V. V., Cheng, H., Brannan, K. W., Youker, K., Lai, L., et al. (2025) · Nature Methods · doi:10.1038/s41592-025-02707-1 · Cited by 118
Machine learning methods for histopathological image analysis: updates in 2024
Komura, D., Ochi, M., & Ishikawa, S. (2025) · Computational and Structural Biotechnology Journal · doi:10.1016/j.csbj.2024.12.033 · Cited by 76
SpaMask: Dual masking graph autoencoder with contrastive learning for spatial transcriptomics
Min, W., Fang, D., Chen, J., & Zhang, S. (2025) · PLoS Computational Biology · doi:10.1371/journal.pcbi.1012881 · Cited by 63
Self-citationDiffusion Generative Modeling for Spatially Resolved Gene Expression Inference from Histology ImagesPreprint
Zhu, S.-C., Zhu, Y., Tao, M., & Qiu, P. (2025) · arXiv (Cornell University) · doi:10.48550/arxiv.2501.15598 · Cited by 49
AI-predicted spatial transcriptomics unlocks breast cancer biomarkers from pathology
Shulman, E. D., Campagnolo, E. M., Lodha, R., Chung, Y., Stemmer, A., Cantore, T., Ru, B., Chang, T., Biswas, S., Dhruba, S. R., et al. (2026) · Cell · doi:10.1016/j.cell.2026.04.023 · Cited by 50
Self-citation
Metadata
- Authors
- Min, W., Shi, Z., Zhang, J., Wan, J., & Wang, C.
- Affiliations
- Yunnan University (CN)
- Zhongnan University of Economics and Law (CN)
- Shenzhen Research Institute of Big Data (CN)
- Corresponding author
- Min, Wenwen
- Venue
- Briefings in Bioinformatics
- Publisher
- Oxford University Press (OUP)
- Published
- 2024-09-23
- Volume
- 25
- Issue
- 6
- ISSN
- 1467-5463 (ISSN-L)
- 1477-4054
- PMC
- PMC11952928
- OpenAlex
- W4403853489
- Cited by
- 90
- References
- 44
- Citations by year
- 2026: 55 · 2025: 26 · 2024: 9
- FWCI
- 12.25
- Type
- journal article
- Language
- en
- Open access
- gold
- doi.org
- Licence
- Locations
- Briefings in Bioinformatics (publishedVersion, cc-by)
- Europe PMC (PubMed Central) (publishedVersion, cc-by)
- PubMed Central (publishedVersion, cc-by)
- PubMed (publishedVersion)
- arXiv (Cornell University) (submittedVersion)
- arXiv (Cornell University)
- Funders
- National Natural Science Foundation of China (62262069)
- Topics
- Life Sciences › Biochemistry, Genetics and Molecular Biology › Molecular Biology › Single-cell and spatial transcriptomics
- Life Sciences › Biochemistry, Genetics and Molecular Biology › Molecular Biology › Gene expression and cancer classification
- Physical Sciences › Computer Science › Artificial Intelligence › AI in cancer detection
- Keywords
- spatial transcriptomics, gene expression prediction, histological images, H&E staining, multimodal contrastive learning, Transformer encoder, DenseNet121, spatial context, breast cancer, cutaneous squamous cell carcinoma, highly variable genes, immune-related genes, spatial domain
- MeSH terms
- Machine Learning, Algorithms, Breast Neoplasms, Female, Humans, Image Processing, Computer-Assisted, Gene Expression Regulation, Neoplastic, Computational Biology, Gene Expression Profiling, Transcriptome
About these checks
Registry, retraction, Cites and statistics results are computed, not judged, with one exception: a printed reference that no index lists is read once by a model before it counts as a citation error. Claims are extracted by a model and kept only when their quote appears verbatim in the text; each cited source is then checked, with a model’s help, for whether it says what the claim relies on. Those verdicts can be wrong — read the claim’s quote and the cited source before relying on one.
Statistics and arithmetic are recomputed, not judged.
Confidence bands are shown only for fields calibrated on our annotated test set. None is calibrated yet, so no band is shown.
What counts as a claim ›How we measure confidence ›How we check this ›
Are you an author, or do you see a problem with this page? Request a review
Data sources
Bibliographic data: Semantic Scholar, OpenAlex, Crossref.
Contains information from the Semantic Scholar Academic Graph Datasets, made available under the ODC Attribution License (ODC-BY 1.0).
Semantic Scholar’s data is described in: Kinney, R., et al. (2023). The Semantic Scholar Open Data Platform. arXiv:2301.10140.
