

Features that define the best ChIP-seq peak calling algorithms
Open accessPublished version of a preprint
The DOI matches its Crossref record; 50 of the 50 references it cites were found in a registry or an index.
Abstract
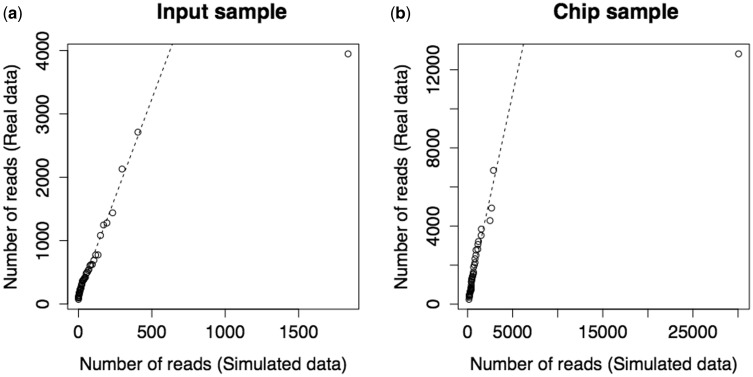
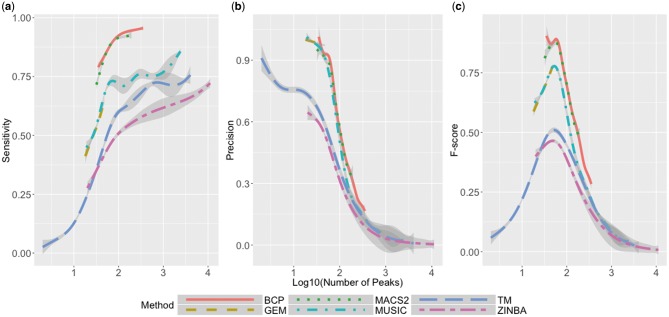
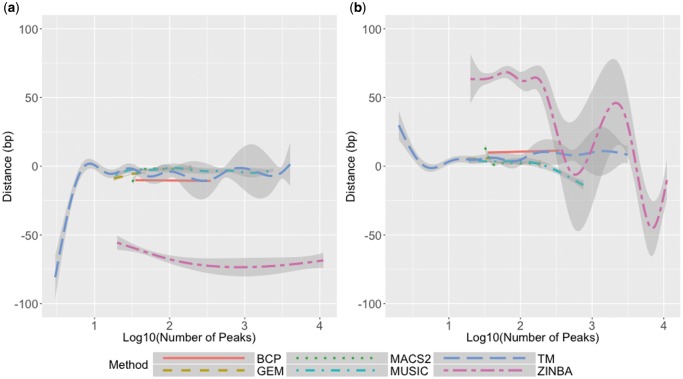
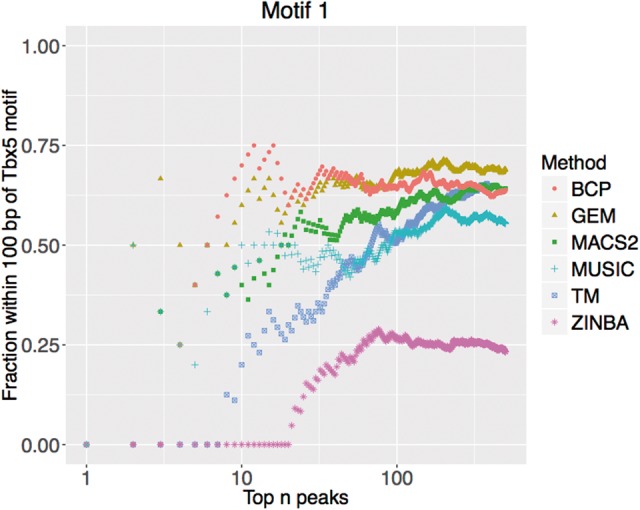
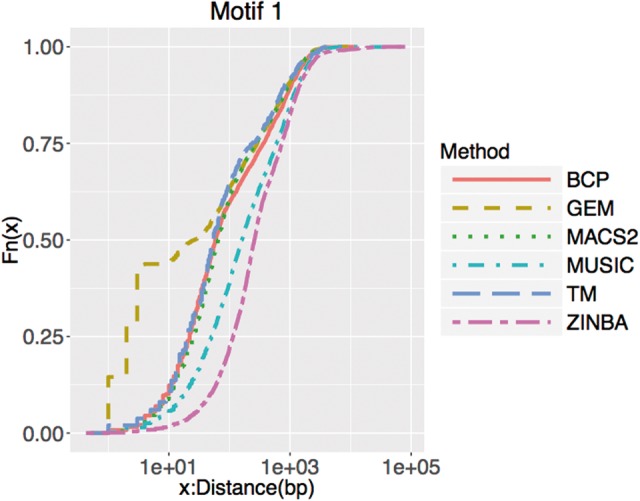
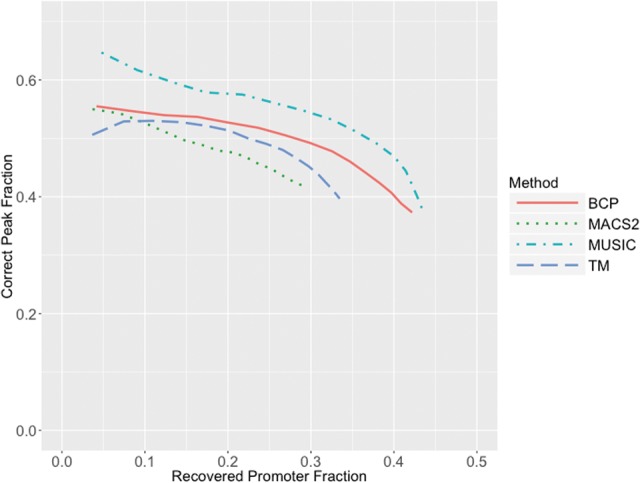
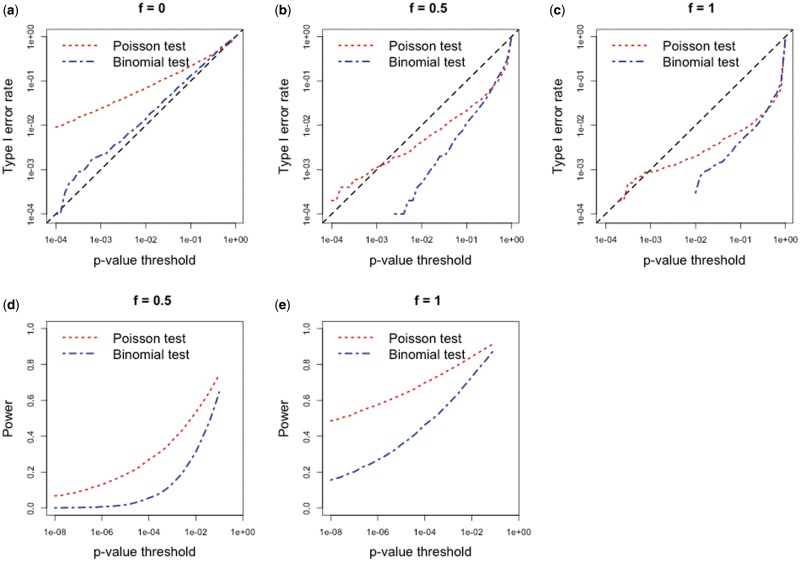
Chromatin immunoprecipitation followed by sequencing (ChIP-seq) is an important tool for studying gene regulatory proteins, such as transcription factors and histones. Peak calling is one of the first steps in the analysis of these data. Peak calling consists of two sub-problems: identifying candidate peaks and testing candidate peaks for statistical significance. We surveyed 30 methods and identified 12 features of the two sub-problems that distinguish methods from each other. We picked six methods GEM, MACS2, MUSIC, BCP, Threshold-based method (TM) and ZINBA] that span this feature space and used a combination of 300 simulated ChIP-seq data sets, 3 real data sets and mathematical analyses to identify features of methods that allow some to perform better than the others. We prove that methods that explicitly combine the signals from ChIP and input samples are less powerful than methods that do not. Methods that use windows of different sizes are more powerful than the ones that do not. For statistical testing of candidate peaks, methods that use a Poisson test to rank their candidate peaks are more powerful than those that use a Binomial test. BCP and MACS2 have the best operating characteristics on simulated transcription factor binding data. GEM has the highest fraction of the top 500 peaks containing the binding motif of the immunoprecipitated factor, with 50% of its peaks within 10 base pairs of a motif. BCP and MUSIC perform best on histone data. These findings provide guidance and rationale for selecting the best peak caller for a given application.
Overview
The claims and statistics of this paper haven’t been checked yet.
Free: it reads the open-access text and checks the first 5 claims that cite a source we can check. Create a free account to check every claim.
Integrity signals
Registry
Cites
Statistics
Figures

Verification
Claims the paper makes
The claims and statistics of this paper haven’t been checked yet.
Free: it reads the open-access text and checks the first 5 claims that cite a source we can check. Create a free account to check every claim.
Claims other papers make about this one
Each is checked against this paper’s own text: does it say what the citing paper says it does?
The cited source says what the claim attributes to it.
In the citing paper
“For peak calling we followed the guidelines described in (Thomas et al., 2016).”
From Targeted Degradation of CTCF Decouples Local Insulation of Chromosome Domains from Genomic Compartmentalization (2017) · cites this paper as Thomas et al., 2016
Self-check
Percentages, sums and reported differences re-computed from the paper’s own numbers.
The self-check needs the paper’s full text.
Citations
Cites
R: A Language and Environment for Statistical Computing
R Core Team (2025) · doi:10.32614/r.manuals · Cited by 352,181
Fast gapped-read alignment with Bowtie 2
Langmead, B., & Salzberg, S. L. (2012) · Nature Methods · doi:10.1038/nmeth.1923 · Cited by 56,400
HTSeq—a Python framework to work with high-throughput sequencing data
Anders, S., Pyl, P. T., & Huber, W. (2015) · Bioinformatics · doi:10.1093/bioinformatics/btu638 · Cited by 21,464
Model-based Analysis of ChIP-Seq (MACS)
Zhang, Y., Liu, T., Meyer, C. A., Eeckhoute, J., Johnson, D. S., Bernstein, B. E., Nusbaum, C., Myers, R. M., Brown, M., Li, W., et al. (2008) · Genome Biology · doi:10.1186/gb-2008-9-9-r137 · Cited by 18,386
Mapping and quantifying mammalian transcriptomes by RNA-Seq
Mortazavi, A., Williams, B. A., McCue, K., Schaeffer, L., & Wold, B. (2008) · Nature Methods · doi:10.1038/nmeth.1226 · Cited by 13,696
Bioconductor: open software development for computational biology and bioinformatics
Gentleman, R. C., Carey, V. J., Bates, D. M., Bolstad, B., Dettling, M., Dudoit, S., Ellis, B., Gautier, L., Ge, Y., Gentry, J., et al. (2004) · Genome Biology · doi:10.1186/gb-2004-5-10-r80 · Cited by 12,172
High-Resolution Profiling of Histone Methylations in the Human Genome
Barski, A., Cuddapah, S., Cui, K., Roh, T.-Y., Schones, D. E., Wang, Z., Wei, G., Chepelev, I., & Zhao, K. (2007) · Cell · doi:10.1016/j.cell.2007.05.009 · Cited by 6,845
Hastie, T., & Tibshirani, R. (1986) · Statistical Science · doi:10.1214/ss/1177013604 · Cited by 3,409
The ENCODE (ENCyclopedia Of DNA Elements) Project
(2004) · Science · doi:10.1126/science.1105136 · Cited by 2,390
ChIP-seq guidelines and practices of the ENCODE and modENCODE consortia
Landt, S. G., Marinov, G. K., Kundaje, A., Kheradpour, P., Pauli, F., Batzoglou, S., Bernstein, B. E., Bickel, P., Brown, J. B., Cayting, P., et al. (2012) · Genome Research · doi:10.1101/gr.136184.111 · Cited by 2,033
The Divergence and Bhattacharyya Distance Measures in Signal Selection
Kailath, T. (1967) · IEEE Transactions on Communications · doi:10.1109/tcom.1967.1089532 · Cited by 1,856
HTSeq – A Python framework to work with high-throughput sequencing dataPreprint
Anders, S., Pyl, P. T., & Huber, W. K. (2014) · bioRxiv (Cold Spring Harbor Laboratory) · doi:10.1101/002824 · Cited by 1,286
Generalized additive models for medical research
Hastie, T., & Tibshirani, R. (1995) · Statistical Methods in Medical Research · doi:10.1177/096228029500400302 · Cited by 1,266
Probability: Theory and Examples
Durrett, R. (2010) · Cambridge University Press eBooks · doi:10.1017/cbo9780511779398 · Cited by 1,251
ChIPpeakAnno: a Bioconductor package to annotate ChIP-seq and ChIP-chip data
Zhu, L. J., Gazin, C., Lawson, N. D., Pagès, H., Lin, S. M., Lapointe, D. S., & Green, M. R. (2010) · BMC Bioinformatics · doi:10.1186/1471-2105-11-237 · Cited by 1,181
A clustering approach for identification of enriched domains from histone modification ChIP-Seq data
Zang, C., Schones, D. E., Zeng, C., Cui, K., Zhao, K., & Peng, W. (2009) · Bioinformatics · doi:10.1093/bioinformatics/btp340 · Cited by 1,057
Chromatin accessibility pre-determines glucocorticoid receptor binding patterns
John, S., Sabo, P. J., Thurman, R. E., Sung, M.-H., Biddie, S. C., Johnson, T. A., Hager, G. L., & Stamatoyannopoulos, J. A. (2011) · Nature Genetics · doi:10.1038/ng.759 · Cited by 954
Design and analysis of ChIP-seq experiments for DNA-binding proteins
Kharchenko, P. V., Tolstorukov, M. Y., & Park, P. J. (2008) · Nature Biotechnology · doi:10.1038/nbt.1508 · Cited by 916
An integrated software system for analyzing ChIP-chip and ChIP-seq data
Ji, H., Jiang, H., Ma, W., Johnson, D. S., Myers, R. M., & Wong, W. H. (2008) · Nature Biotechnology · doi:10.1038/nbt.1505 · Cited by 716
Genome-wide analysis of transcription factor binding sites based on ChIP-Seq data
Valouev, A., Johnson, D. S., Sundquist, A., Medina, C., Anton, E., Batzoglou, S., Myers, R. M., & Sidow, A. (2008) · Nature Methods · doi:10.1038/nmeth.1246 · Cited by 695
Differential chromatin marking of introns and expressed exons by H3K36me3
Kolasinska-Zwierz, P., Down, T., Latorre, I., Liu, T., Liu, X. S., & Ahringer, J. (2009) · Nature Genetics · doi:10.1038/ng.322 · Cited by 671
PeakSeq enables systematic scoring of ChIP-seq experiments relative to controls
Rozowsky, J., Euskirchen, G., Auerbach, R. K., Zhang, Z. D., Gibson, T., Bjornson, R., Carriero, N., Snyder, M., & Gerstein, M. B. (2009) · Nature Biotechnology · doi:10.1038/nbt.1518 · Cited by 561
Genome-wide identification of in vivo protein-DNA binding sites from ChIP-Seq data
Jothi, R., Cuddapah, S., Barski, A., Cui, K., & Zhao, K. (2008) · Nucleic Acids Research · doi:10.1093/nar/gkn488 · Cited by 539
F-Seq: a feature density estimator for high-throughput sequence tags
Boyle, A. P., Guinney, J., Crawford, G. E., & Furey, T. S. (2008) · Bioinformatics · doi:10.1093/bioinformatics/btn480 · Cited by 363 · cited 2×
“[4] disagree about the ranking of Spatial clustering approach for the Identification of ChIP-Enriched Regions (SICER) [8], F-seq [9] and Model-based Analysis for ChIP-Seq (MACS) [10].”
BackgroundHe, A., Kong, S. W., Ma, Q., & Pu, W. T. (2011) · Proceedings of the National Academy of Sciences · doi:10.1073/pnas.1016959108 · Cited by 357
Guo, Y., Mahony, S., & Gifford, D. K. (2012) · PLoS Computational Biology · doi:10.1371/journal.pcbi.1002638 · Cited by 303
Evaluation of Algorithm Performance in ChIP-Seq Peak Detection
Wilbanks, E. G., & Facciotti, M. T. (2010) · PLoS ONE · doi:10.1371/journal.pone.0011471 · Cited by 285 · cited 5×
“We will again use the Bhattacharyya distance as a measure of the ability to distinguish between the two distributions in Equations (2) and (3).”
MethodInfluentialFejes, A. P., Robertson, G., Bilenky, M., Varhol, R., Bainbridge, M., & Jones, S. J. M. (2008) · Bioinformatics · doi:10.1093/bioinformatics/btn305 · Cited by 272
Luna-Zurita, L., Stirnimann, C. U., Glatt, S., Kaynak, B. L., Thomas, S., Baudin, F., Samee, M. A. H., He, D., Small, E. M., Mileikovsky, M., et al. (2016) · Cell · doi:10.1016/j.cell.2016.01.004 · Cited by 207
Rhee, H. S., & Pugh, B. F. (2012) · Current Protocols in Molecular Biology · doi:10.1002/0471142727.mb2124s100 · Cited by 195
Rashid, N. U., Giresi, P. G., Ibrahim, J. G., Sun, W., & Lieb, J. D. (2011) · Genome Biology · doi:10.1186/gb-2011-12-7-r67 · Cited by 181
Identifying dispersed epigenomic domains from ChIP-Seq data
Song, Q., & Smith, A. D. (2011) · Bioinformatics · doi:10.1093/bioinformatics/btr030 · Cited by 158
BayesPeak: Bayesian analysis of ChIP-seq data
Spyrou, C., Stark, R., Lynch, A. G., & Tavaré, S. (2009) · BMC Bioinformatics · doi:10.1186/1471-2105-10-299 · Cited by 153
Xu, H., Wei, C.-L., Lin, F., & Sung, W.-K. (2008) · Bioinformatics · doi:10.1093/bioinformatics/btn402 · Cited by 147
HPeak: an HMM-based algorithm for defining read-enriched regions in ChIP-Seq data
Qin, Z. S., Yu, J., Shen, J., Maher, C. A., Hu, M., Sundaram, S. K., Yu, J., & Chinnaiyan, A. M. (2010) · BMC Bioinformatics · doi:10.1186/1471-2105-11-369 · Cited by 137
A signal–noise model for significance analysis of ChIP-seq with negative control
Xu, H., Handoko, L., Wei, X., Ye, C., Sheng, J., Wei, C.-L., Lin, F., & Sung, W.-K. (2010) · Bioinformatics · doi:10.1093/bioinformatics/btq128 · Cited by 134
Laajala, T. D., Raghav, S., Tuomela, S., Lahesmaa, R., Aittokallio, T., & Elo, L. L. (2009) · BMC Genomics · doi:10.1186/1471-2164-10-618 · Cited by 119 · cited 2×
“Using Equation (1) and the mean and variances for the Poisson and Skellam distributions, which is true because by definition the Poisson parameters k 1 and k 0 are positive.”
MethodBlahnik, K. R., Dou, L., O'Geen, H., McPhillips, T., Xu, X., Cao, A. R., Iyengar, S., Nicolet, C. M., Ludäscher, B., Korf, I., et al. (2010) · Nucleic Acids Research · doi:10.1093/nar/gkp1012 · Cited by 118
GeneTrack—a genomic data processing and visualization framework
Albert, I., Wachi, S., Jiang, C., & Pugh, B. F. (2008) · Bioinformatics · doi:10.1093/bioinformatics/btn119 · Cited by 103
Modeling ChIP Sequencing In Silico with Applications
Zhang, Z. D., Rozowsky, J., Snyder, M., Chang, J., & Gerstein, M. (2008) · PLoS Computational Biology · doi:10.1371/journal.pcbi.1000158 · Cited by 98
Rye, M. B., Sætrom, P., & Drabløs, F. (2010) · Nucleic Acids Research · doi:10.1093/nar/gkq1187 · Cited by 88
A Comparison of Peak Callers Used for DNase-Seq Data
Koohy, H., Down, T. A., Spivakov, M., & Hubbard, T. (2014) · PLoS ONE · doi:10.1371/journal.pone.0096303 · Cited by 87 · cited 2×
“There have been efforts to benchmark peak calling methods [1–5].”
BackgroundXing, H., Mo, Y., Liao, W., & Zhang, M. Q. (2012) · PLoS Computational Biology · doi:10.1371/journal.pcbi.1002613 · Cited by 68
Harmanci, A., Rozowsky, J., & Gerstein, M. (2014) · Genome Biology · doi:10.1186/preaccept-9116006401338101 · Cited by 68 · cited 3×
“[7] present an estimate of the spectrum of peak lengths associated with a transcription factor and different histone marks including H3K36me3 and H3K4me3.”
BackgroundPicking ChIP-seq peak detectors for analyzing chromatin modification experiments
Micsinai, M., Parisi, F., Strino, F., Asp, P., Dynlacht, B. D., & Kluger, Y. (2012) · Nucleic Acids Research · doi:10.1093/nar/gks048 · Cited by 66 · cited 2×
“[4] disagree about the ranking of Spatial clustering approach for the Identification of ChIP-Enriched Regions (SICER) [8], F-seq [9] and Model-based Analysis for ChIP-Seq (MACS) [10].”
BackgroundRapid innovation in ChIP-seq peak-calling algorithms is outdistancing benchmarking efforts
Szalkowski, A. M., & Schmid, C. D. (2010) · Briefings in Bioinformatics · doi:10.1093/bib/bbq068 · Cited by 59 · cited 1×
“These have the advantage of being independent evaluations, but they have also been limited in scope and sometimes provide conflicting advice owing to differences in numbers and widths of peaks evaluated [6].”
BackgroundShape-based peak identification for ChIP-Seq
Hower, V., Evans, S. N., & Pachter, L. (2011) · BMC Bioinformatics · doi:10.1186/1471-2105-12-15 · Cited by 53
W-ChIPeaks: a comprehensive web application tool for processing ChIP-chip and ChIP-seq data
Lan, X., Bonneville, R., Apostolos, J., Wu, W., & Jin, V. X. (2010) · Bioinformatics · doi:10.1093/bioinformatics/btq669 · Cited by 46
ChIPseqR: analysis of ChIP-seq experiments
Humburg, P., Helliwell, C. A., Bulger, D. W., & Stone, G. (2011) · BMC Bioinformatics · doi:10.1186/1471-2105-12-39 · Cited by 25
PolyaPeak: Detecting Transcription Factor Binding Sites from ChIP-seq Using Peak Shape Information
Wu, H., & Ji, H. (2014) · PLoS ONE · doi:10.1371/journal.pone.0089694 · Cited by 14
Research works printed but not linked: 2
- Bhattachayya A. On a measure of divergence between two statistical population defined by their population distributions. Bull Cal Math Soc 1943; 35: 99– 109.
- Durrett R. Probability Theories and Examples. Duxbury Press, 1996.
Cited by
HiGlass: web-based visual exploration and analysis of genome interaction maps
Kerpedjiev, P., Abdennur, N., Lekschas, F., McCallum, C., Dinkla, K., Strobelt, H., Luber, J. M., Ouellette, S. B., Azhir, A., Kumar, N., et al. (2018) · Genome Biology · doi:10.1186/s13059-018-1486-1 · Cited by 2,453
“In the case of ChIP-seq data, for example, peak callers identify regions where proteins bind (Thomas et al. 2017) and an analyst would verify that the regions contain an elevated number of read counts relative to the surrounding regions.”
BackgroundNora, E. P., Goloborodko, A., Valton, A.-L., Gibcus, J. H., Uebersohn, A., Abdennur, N., Dekker, J., Mirny, L. A., & Bruneau, B. G. (2017) · Cell · doi:10.1016/j.cell.2017.05.004 · Cited by 1,709
“For peak calling we followed the guidelines described in (Thomas et al., 2016).”
Peak calling by Sparse Enrichment Analysis for CUT&RUN chromatin profiling
Meers, M. P., Tenenbaum, D., & Henikoff, S. (2019) · Epigenetics & Chromatin · doi:10.1186/s13072-019-0287-4 · Cited by 556
“Such algorithms frequently employ Poisson or negative binomial models of global and local read distributions to derive statistical measures of signal enrichment over background, and extensive efforts have been dedicated to evaluating the merits of such design choices [8].”
BackgroundFrom reads to insight: a hitchhiker’s guide to ATAC-seq data analysis
Yan, F., Powell, D. R., Curtis, D. J., & Wong, N. C. (2020) · Genome Biology · doi:10.1186/s13059-020-1929-3 · Cited by 473
“A similar process has been comprehensively reviewed for ChIP-seq [58, 59] and DNase-seq [60].”
MethodMethods for ChIP-seq analysis: A practical workflow and advanced applications
Nakato, R., & Sakata, T. (2021) · Methods · doi:10.1016/j.ymeth.2020.03.005 · Cited by 267
Metadata
- Authors
- Thomas, R., Thomas, S., Holloway, A. K., & Pollard, K. S.
- Affiliations
- Gladstone Institutes (US)
- Corresponding author
- Thomas, Reuben
- Venue
- Briefings in Bioinformatics
- Publisher
- Oxford University Press (OUP)
- Published
- 2016-05-11
- Volume
- 18
- Issue
- 3
- Pages
- bbw035
- ISSN
- 1467-5463 (ISSN-L)
- 1477-4054
- PMC
- PMC5429005
- OpenAlex
- W2385696187
- Cited by
- 112
- References
- 49
- Citations by year
- 2026: 2 · 2025: 8 · 2024: 5 · 2023: 10 · 2022: 13 · 2021: 20 · 2020: 15 · 2019: 15 · 2018: 12 · 2017: 10 · 2016: 2
- FWCI
- 6.72
- Type
- journal article
- Language
- en
- Open access
- hybrid
- doi.org
- Licence
- cc-by-nc
- Locations
- Briefings in Bioinformatics (publishedVersion, cc-by-nc)
- bioRxiv (Cold Spring Harbor Laboratory) (acceptedVersion, cc-by-nc-nd)
- Europe PMC (PubMed Central) (publishedVersion, cc-by-nc)
- PubMed Central (publishedVersion, cc-by-nc)
- PubMed (publishedVersion)
- eScholarship (California Digital Library) (submittedVersion)
- Funders
- Gladstone Institutes
- National Heart, Lung, and Blood Institute (HL098179, UM1HL098179, P01HL089707, HL089707, U01HL098179)
- Topics
- Life Sciences › Biochemistry, Genetics and Molecular Biology › Molecular Biology › Genomics and Chromatin Dynamics
- Life Sciences › Biochemistry, Genetics and Molecular Biology › Molecular Biology › Genomics and Phylogenetic Studies
- Life Sciences › Biochemistry, Genetics and Molecular Biology › Molecular Biology › Bioinformatics and Genomic Networks
- Keywords
- ChIP-seq, peak calling, statistical significance testing, binomial test, transcription factor binding, histone modifications, MACS2, gems, BCP
- MeSH terms
- Algorithms, Binding Sites, Histones, Transcription Factors, Sequence Analysis, DNA, Oligonucleotide Array Sequence Analysis, Chromatin Immunoprecipitation, High-Throughput Nucleotide Sequencing
About these checks
Registry, retraction, Cites and statistics results are computed, not judged, with one exception: a printed reference that no index lists is read once by a model before it counts as a citation error. Claims are extracted by a model and kept only when their quote appears verbatim in the text; each cited source is then checked, with a model’s help, for whether it says what the claim relies on. Those verdicts can be wrong — read the claim’s quote and the cited source before relying on one.
Statistics and arithmetic are recomputed, not judged.
Confidence bands are shown only for fields calibrated on our annotated test set. None is calibrated yet, so no band is shown.
What counts as a claim ›How we measure confidence ›How we check this ›
Are you an author, or do you see a problem with this page? Request a review
Data sources
Bibliographic data: Semantic Scholar, OpenAlex, Crossref.
Contains information from the Semantic Scholar Academic Graph Datasets, made available under the ODC Attribution License (ODC-BY 1.0).
Semantic Scholar’s data is described in: Kinney, R., et al. (2023). The Semantic Scholar Open Data Platform. arXiv:2301.10140.
