Cited by 280Neuroscience and Neuropharmacology ResearchNeural dynamics and brain functionMemory and Neural Mechanisms

The DOI matches its Crossref record; 76 of the 77 references it cites were found in a registry or an index.

Dendritic and Axonal Architecture of Individual Pyramidal Neurons across Layers of Adult Human Neocortex

Open access

Abstract

The size and shape of dendrites and axons are strong determinants of neuronal information processing. Our knowledge on neuronal structure and function is primarily based on brains of laboratory animals. Whether it translates to human is not known since quantitative data on "full" human neuronal morphologies are lacking. Here, we obtained human brain tissue during resection surgery and reconstructed basal and apical dendrites and axons of individual neurons across all cortical layers in temporal cortex (Brodmann area 21). Importantly, morphologies did not correlate to etiology, disease severity, or disease duration. Next, we show that human L(ayer) 2 and L3 pyramidal neurons have 3-fold larger dendritic length and increased branch complexity with longer segments compared with temporal cortex neurons from macaque and mouse. Unsupervised cluster analysis classified 88% of human L2 and L3 neurons into human-specific clusters distinct from mouse and macaque neurons. Computational modeling of passive electrical properties to assess the functional impact of large dendrites indicates stronger signal attenuation of electrical inputs compared with mouse. We thus provide a quantitative analysis of "full" human neuron morphologies and present direct evidence that human neurons are not "scaled-up" versions of rodent or macaque neurons, but have unique structural and functional properties.

Overview

The claims and statistics of this paper haven’t been checked yet.

Run the check — free, no account needed. It reads the open-access text and checks the sources it cites.

A few free checks a day · papers already verified open instantly · results are public

Integrity signals

Registry

Crossref · 10.1093/cercor/bhv188

Cites

76 of 76 references verified0 citation errors · 0 not checkable

Statistics

Figures

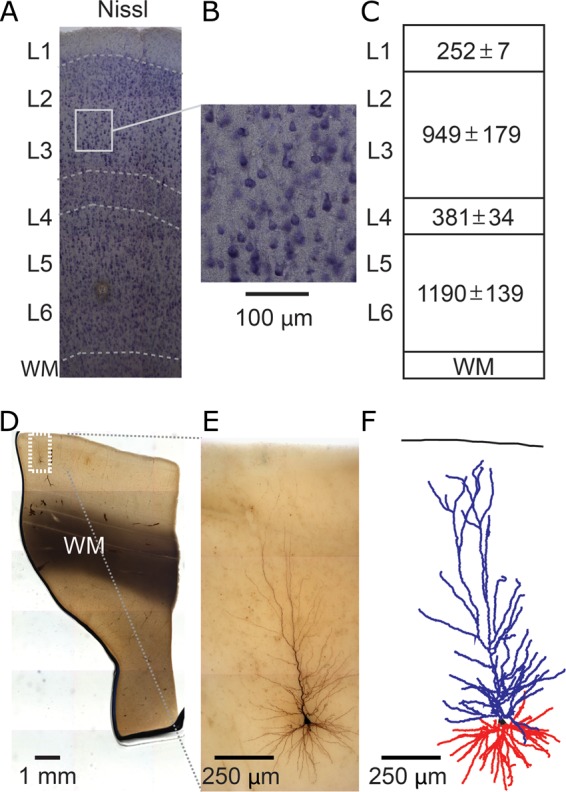
Figure 1. 3D reconstruction of single-cell dendritic morphology in human temporal cortex. (A,B) Nissl staining to reveal layer boundaries (WM, white matter; L, layer). (C) Cortical layer dimensions (in µm ± standard deviation, n = 5). (D) Low-magnification view of biocytin-filled neuron. (E) High-magnification view of same neuron in D. (F) Example 3D dendritic reconstruction of neuron shown in D and E. Apical dendrite in blue, basal dendrites in red.
Figure 1. 3D reconstruction of single-cell dendritic morphology in human temporal cortex. (A,B) Nissl staining to reveal layer boundaries (WM, white matter; L, layer). (C) Cortical layer dimensions (in µm ± standard deviation, n = 5). (D) Low-magnification view of biocytin-filled neuron. (E) High-magnification view of same neuron in D. (F) Example 3D dendritic reconstruction of neuron shown in D and E. Apical dendrite in blue, basal dendrites in red.CC BY-NC · PubMed Central
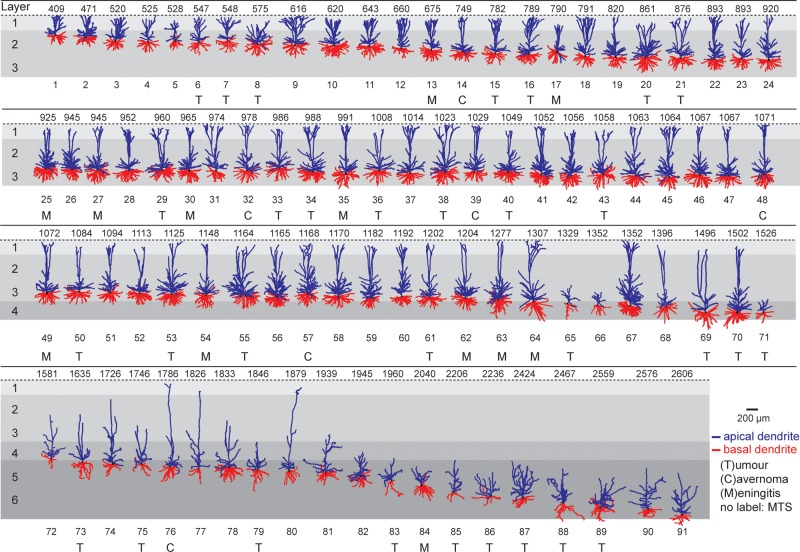
Figure 2. Dendrite gallery of human temporal cortex neurons. Representation of 91 3D reconstructed apical and basal dendrites of human temporal cortex (Brodmann area 21) arranged along somatic depth with respect to pial surface. Capitals (T, C, M) indicate that tissue was obtained from patients with subcortical tumor, cavarnoma, or meningitis. First row indicates depth in µm. Apical dendrite in blue, basal dendrite in red. Neurons not labeled originate from patients with mesiotemporal sclerosis (MTS).
Figure 2. Dendrite gallery of human temporal cortex neurons. Representation of 91 3D reconstructed apical and basal dendrites of human temporal cortex (Brodmann area 21) arranged along somatic depth with respect to pial surface. Capitals (T, C, M) indicate that tissue was obtained from patients with subcortical tumor, cavarnoma, or meningitis. First row indicates depth in µm. Apical dendrite in blue, basal dendrite in red. Neurons not labeled originate from patients with mesiotemporal sclerosis (MTS).CC BY-NC · PubMed Central
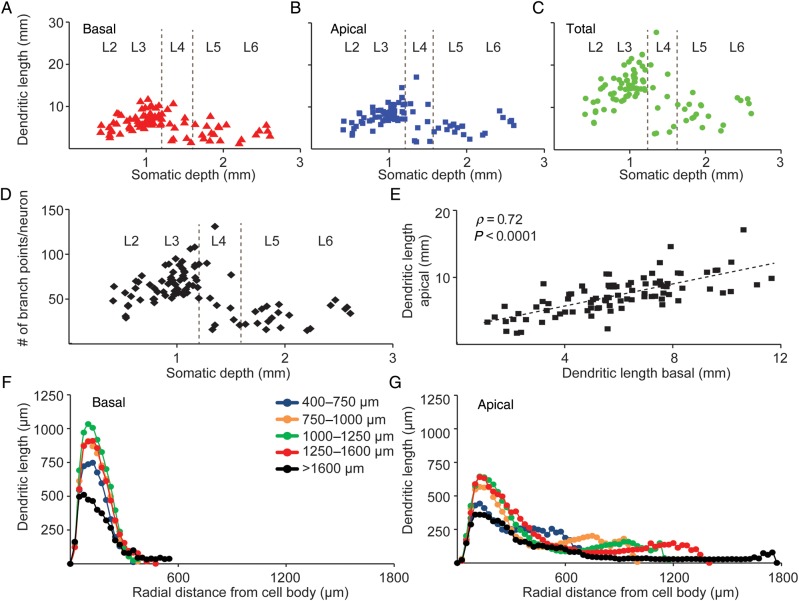
Figure 3. Layer-specific dendrite properties of human temporal cortex neurons. (A) Change in basal dendrite length of 91 human temporal cortex neurons with respect to layers and somatic depth. (B) Change in apical dendrite length with respect to layers and somatic depth. (C) Change in total dendrite length with respect to layers and somatic depth. (D) Change in number of branch points per neuron, for both apical and basal dendrites combined, with respect to layers and somatic depth. (E) Correlation between apical and basal dendrite length of 91 human temporal cortex neurons (Pearson's correlation coefficient r = 0.71, P < 0.0001). (F) Sholl analysis of 91 human temporal cortex basal dendrites, grouped into different depth bins, illustrating change in mean dendritic length with increasing radial distance from cell body. (G) Sholl analysis of apical dendrite with neurons grouped into different depth bins illustrating change in mean dendritic length with increasing radial distance from cell body.
Figure 3. Layer-specific dendrite properties of human temporal cortex neurons. (A) Change in basal dendrite length of 91 human temporal cortex neurons with respect to layers and somatic depth. (B) Change in apical dendrite length with respect to layers and somatic depth. (C) Change in total dendrite length with respect to layers and somatic depth. (D) Change in number of branch points per neuron, for both apical and basal dendrites combined, with respect to layers and somatic depth. (E) Correlation between apical and basal dendrite length of 91 human temporal cortex neurons (Pearson's correlation coefficient r = 0.71, P < 0.0001). (F) Sholl analysis of 91 human temporal cortex basal dendrites, grouped into different depth bins, illustrating change in mean dendritic length with increasing radial distance from cell body. (G) Sholl analysis of apical dendrite with neurons grouped into different depth bins illustrating change in mean dendritic length with increasing radial distance from cell body.CC BY-NC · PubMed Central
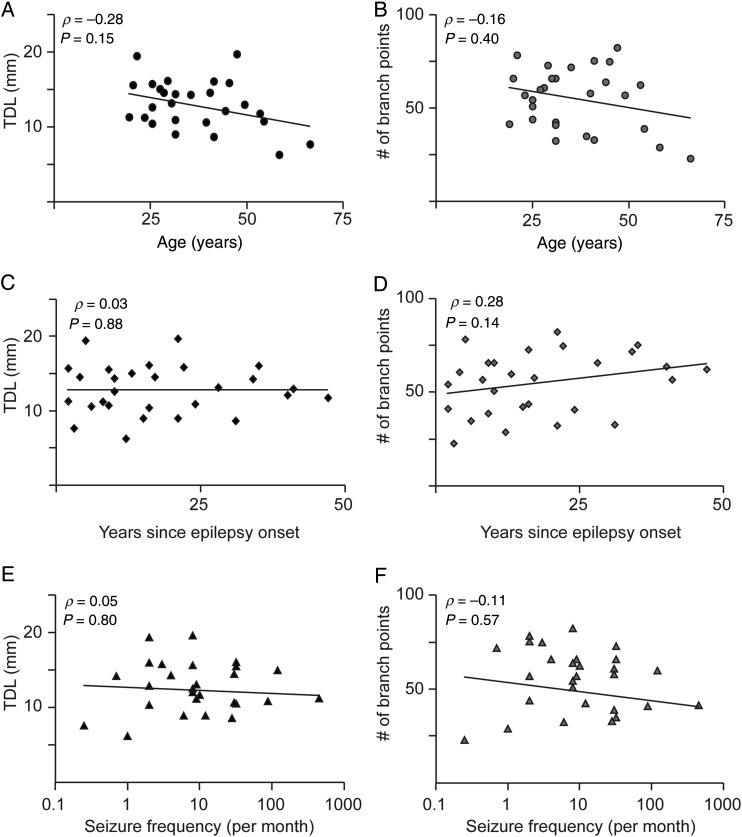
Figure 4. Disease history does not affect total dendritic length and number of branch points. (A) Correlation of total dendritic length with respect to age. Each point in the scatterplot represents the median value for a single patient (B) Correlation of number of branch points versus age. (C,D) Correlation for TDL and number of branch points, respectively, to years since epilepsy onset. (E,F) Correlation for TDL and number of branch points, respectively, to seizure frequency. Spearman's ρ and P-value are indicated within figure panels, respectively.
Figure 4. Disease history does not affect total dendritic length and number of branch points. (A) Correlation of total dendritic length with respect to age. Each point in the scatterplot represents the median value for a single patient (B) Correlation of number of branch points versus age. (C,D) Correlation for TDL and number of branch points, respectively, to years since epilepsy onset. (E,F) Correlation for TDL and number of branch points, respectively, to seizure frequency. Spearman's ρ and P-value are indicated within figure panels, respectively.CC BY-NC · PubMed Central
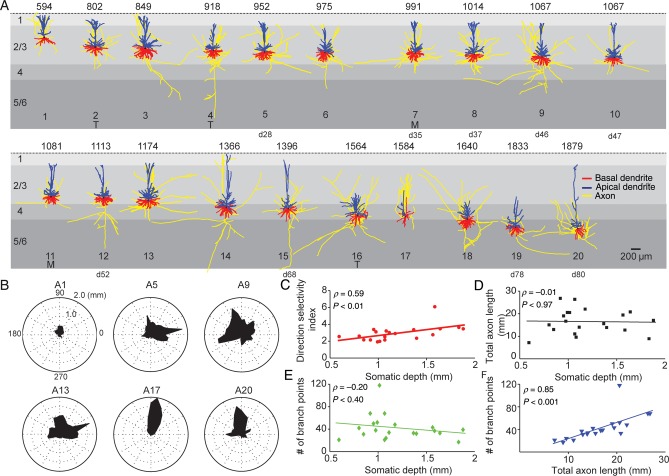
Figure 5. Axon gallery and layer-specific axonal properties of human temporal cortex neurons. (A) Representation of 20 3D reconstructed axons with apical and basal dendrites of human temporal cortex neurons arranged with respect to somatic depth. First row indicates somatic depth in µm. Last row indicates ID of the same reconstruction in dendrite gallery if present in both. Axons in yellow, apical dendrites in blue, basal dendrites in red. Capitals (T, M) indicate that tissue was obtained from patients with subcortical tumor or meningitis. Neurons that are also present in the dendrite gallery are indicated by cell number (for instance, cell #5 in axon gallery is cell 28 in dendrite gallery). (B) Polar plots of 6 example axonal reconstructions illustrating radial orientation of axons with respect to cell body. Top row indicates ID within axon gallery. (C) Dependence of direction selectivity index of axons with respect of somatic depth. (D) Dependence of total axon length with respect to depth. (E) Dependence of number of axonal branch points with respect to depth. (F) Correlation between total axonal length and number of axonal branch points.
Figure 5. Axon gallery and layer-specific axonal properties of human temporal cortex neurons. (A) Representation of 20 3D reconstructed axons with apical and basal dendrites of human temporal cortex neurons arranged with respect to somatic depth. First row indicates somatic depth in µm. Last row indicates ID of the same reconstruction in dendrite gallery if present in both. Axons in yellow, apical dendrites in blue, basal dendrites in red. Capitals (T, M) indicate that tissue was obtained from patients with subcortical tumor or meningitis. Neurons that are also present in the dendrite gallery are indicated by cell number (for instance, cell #5 in axon gallery is cell 28 in dendrite gallery). (B) Polar plots of 6 example axonal reconstructions illustrating radial orientation of axons with respect to cell body. Top row indicates ID within axon gallery. (C) Dependence of direction selectivity index of axons with respect of somatic depth. (D) Dependence of total axon length with respect to depth. (E) Dependence of number of axonal branch points with respect to depth. (F) Correlation between total axonal length and number of axonal branch points.CC BY-NC · PubMed Central
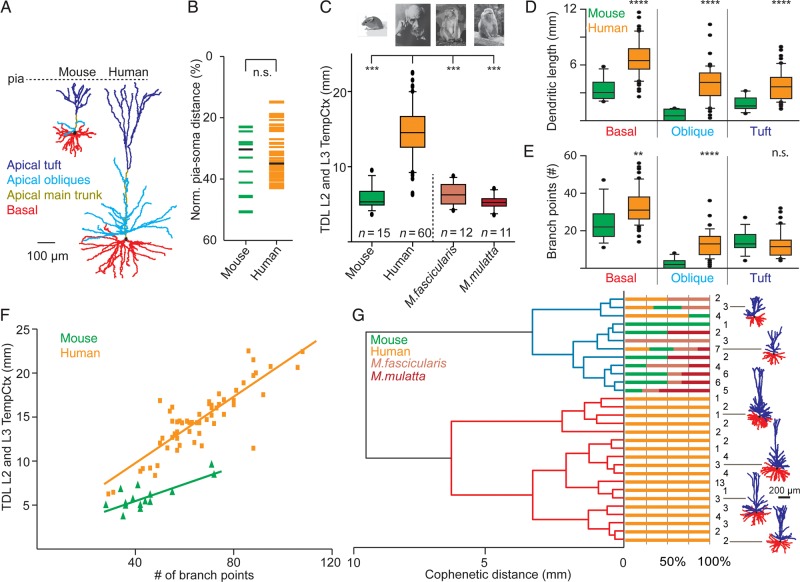
Figure 6. Comparison of dendritic complexity in human, monkey, and mouse L2 and L3 temporal cortex neurons. (A) Representative example 3D dendritic reconstructions of one mouse and human temporal cortex neuron. Apical main trunk in dark yellow, apical oblique dendrites in light blue, apical tuft in dark blue, basal dendrites in red, respectively. (B) Normalized pia-soma depth of individual L2 and L3 neurons from mouse and human temporal cortex. (C) Comparison of total dendritic length (TDL) between L2 and L3 temporal cortex neurons of mouse, human, M. fascicularis, and M. mulatta. (D) Comparison of basal, apical oblique, and apical tuft length between mouse and human temporal cortex neurons. (E) Number of branch points for mouse and human L2 and L3 temporal cortex neurons for basal, apical oblique, and apical tuft. (F) Correlation between number of branch points and TDL of human and mouse L2 and L3 temporal cortex neurons. (G) Dendrogram based on hierarchical agglomerative clustering of mouse, human, M. fascicularis, and M. mulatta L2 and L3 temporal cortex neurons. Neurons were grouped into 2 clusters indicated by blue and red dendrograms based on TDL. Note isolation of 88% of human neurons into unique red cluster.
Figure 6. Comparison of dendritic complexity in human, monkey, and mouse L2 and L3 temporal cortex neurons. (A) Representative example 3D dendritic reconstructions of one mouse and human temporal cortex neuron. Apical main trunk in dark yellow, apical oblique dendrites in light blue, apical tuft in dark blue, basal dendrites in red, respectively. (B) Normalized pia-soma depth of individual L2 and L3 neurons from mouse and human temporal cortex. (C) Comparison of total dendritic length (TDL) between L2 and L3 temporal cortex neurons of mouse, human, M. fascicularis, and M. mulatta. (D) Comparison of basal, apical oblique, and apical tuft length between mouse and human temporal cortex neurons. (E) Number of branch points for mouse and human L2 and L3 temporal cortex neurons for basal, apical oblique, and apical tuft. (F) Correlation between number of branch points and TDL of human and mouse L2 and L3 temporal cortex neurons. (G) Dendrogram based on hierarchical agglomerative clustering of mouse, human, M. fascicularis, and M. mulatta L2 and L3 temporal cortex neurons. Neurons were grouped into 2 clusters indicated by blue and red dendrograms based on TDL. Note isolation of 88% of human neurons into unique red cluster.CC BY-NC · PubMed Central
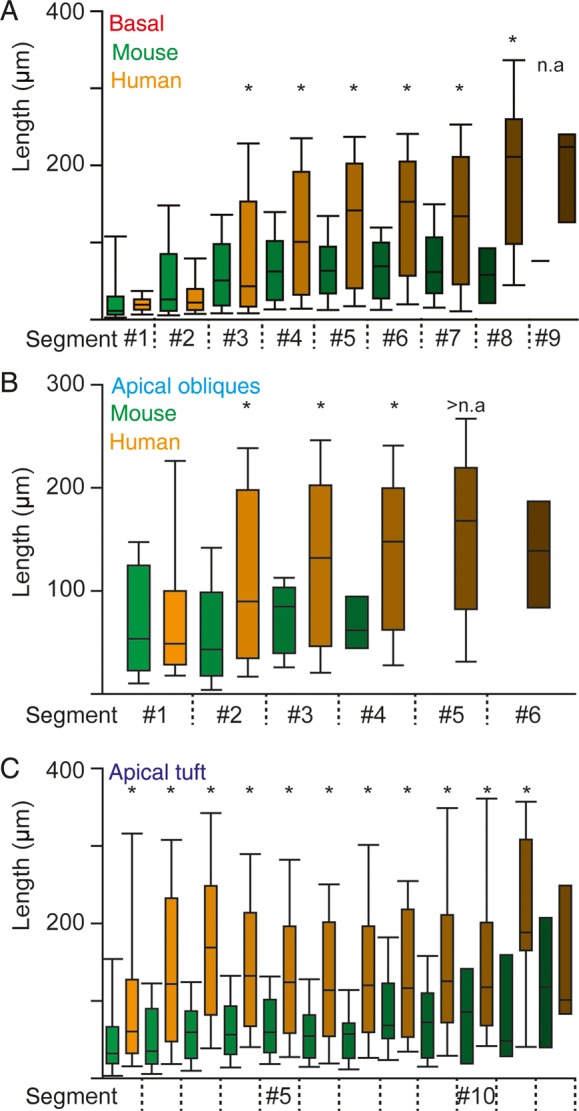
Figure 7. Elongated segments of basal, apical oblique and apical tuft dendrites in human neurons (A) Change in segment length of basal dendrites with distance from the soma of L2 and L3 neurons. Asterisks indicate statistical difference for human versus mouse (MLM statistics, see Materials and Methods) (B) Analogous to A for apical oblique dendrites. (C) Analogous to A for apical tuft dendrites.
Figure 7. Elongated segments of basal, apical oblique and apical tuft dendrites in human neurons (A) Change in segment length of basal dendrites with distance from the soma of L2 and L3 neurons. Asterisks indicate statistical difference for human versus mouse (MLM statistics, see Materials and Methods) (B) Analogous to A for apical oblique dendrites. (C) Analogous to A for apical tuft dendrites.CC BY-NC · PubMed Central
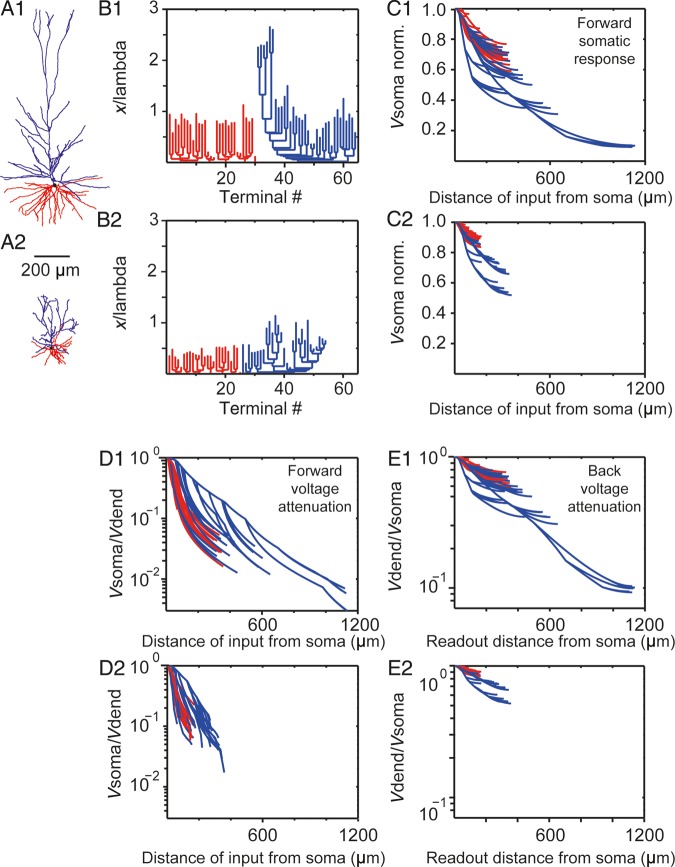
Figure 8. Electrotonic structure and voltage attenuation in human versus mouse L2 and L3 pyramidal cells. (A1, A2) Morphology of human and mouse temporal cortex example neurons, respectively. Red denotes basal tree whereas blue the apical tree, respectively. (B1, B2) Dendrogram in cable units for the neurons in A1 and A2, respectively. In both cases, Rm = 15 000 Ωcm2 and Ri = 150 Ωcm. (C1, C2) Normalized soma voltage resulting from steady-state current injection in the corresponding dendritic sites for the example neurons in A1, A2, respectively. Each line represents a path from the soma to a dendritic terminal. Note the 1.5-fold increase in the average voltage attenuation for the human versus the mouse cell and the enhance attenuation from the distal apical tuft in the human neuron. (D1, D2) Steady voltage attenuation from the dendrites (Vdend) to the soma (Vsoma) for the neurons in A1, A2, respectively. Note the 2.5-fold increase in the average attenuation for the human versus the mouse neuron. (E1, E2) Steady-state voltage attenuation from the soma to the dendrites for the neurons in A1, A2, respectively.
Figure 8. Electrotonic structure and voltage attenuation in human versus mouse L2 and L3 pyramidal cells. (A1, A2) Morphology of human and mouse temporal cortex example neurons, respectively. Red denotes basal tree whereas blue the apical tree, respectively. (B1, B2) Dendrogram in cable units for the neurons in A1 and A2, respectively. In both cases, Rm = 15 000 Ωcm2 and Ri = 150 Ωcm. (C1, C2) Normalized soma voltage resulting from steady-state current injection in the corresponding dendritic sites for the example neurons in A1, A2, respectively. Each line represents a path from the soma to a dendritic terminal. Note the 1.5-fold increase in the average voltage attenuation for the human versus the mouse cell and the enhance attenuation from the distal apical tuft in the human neuron. (D1, D2) Steady voltage attenuation from the dendrites (Vdend) to the soma (Vsoma) for the neurons in A1, A2, respectively. Note the 2.5-fold increase in the average attenuation for the human versus the mouse neuron. (E1, E2) Steady-state voltage attenuation from the soma to the dendrites for the neurons in A1, A2, respectively.CC BY-NC · PubMed Central

Verification

Claims the paper makes

The claims and statistics of this paper haven’t been checked yet.

Run the check — free, no account needed. It reads the open-access text and checks the sources it cites.

A few free checks a day · papers already verified open instantly · results are public

Claims other papers make about this one

Each is checked against this paper’s own text: does it say what the citing paper says it does?

Self-check

Percentages, sums and reported differences re-computed from the paper’s own numbers.

The self-check needs the paper’s full text.

Citations

Cites

Show all 77 references

Cited by

Sorted by citations

See all 280

Metadata

Authors
Mohan, H., Verhoog, M. B., Doreswamy, K. K., Eyal, G., Aardse, R., Lodder, B. N., Goriounova, N. A., Asamoah, B., B. Brakspear, A. B. C., Groot, C., van der Sluis, S., Testa-Silva, G., Obermayer, J., Boudewijns, Z. S. R. M., Narayanan, R. T., Baayen, J. C., Segev, I., Mansvelder, H. D., & de Kock, C. P. J.
Affiliations
  • Vrije Universiteit Amsterdam (NL)
  • Hebrew University of Jerusalem (IL)
  • Amsterdam UMC Location Vrije Universiteit Amsterdam (NL)
Venue
Cerebral Cortex
Published
2015-08-28
Volume
25
Issue
12
Pages
4839-4853
ISSN
  • 1047-3211 (ISSN-L)
  • 1460-2199
OpenAlex
W1938051493
Cited by
280
References
77
Citations by year
2026: 26 · 2025: 42 · 2024: 34 · 2023: 28 · 2022: 30 · 2021: 28 · 2020: 29 · 2019: 23 · 2018: 21 · 2017: 9 · 2016: 9
FWCI
5.97
Type
journal article
Language
en
Open access
Licence
cc-by-nc
Locations
  • Cerebral Cortex (publishedVersion, cc-by-nc)
  • Europe PMC (PubMed Central) (publishedVersion, cc-by-nc)
  • PubMed Central (publishedVersion, cc-by-nc)
  • PubMed (publishedVersion)
  • Amsterdam UMC (VU Amsterdam) - Institutional Repository (publishedVersion)
  • VU Research Portal (publishedVersion, other-oa)
  • Pure Amsterdam UMC (acceptedVersion, other-oa)
  • Data Archiving and Networked Services (DANS) (submittedVersion, other-oa)
  • Data Archiving and Networked Services (DANS) (submittedVersion)
Funders
  • Netherlands Scientific Organization (VIDI-452-12-014)
  • Hersenstichting Nederland (2010(1)-09)
  • Center for Neurogenomics and Cognitive Research
  • Neuroscience Campus Amsterdam
  • VU University Amsterdam
  • Human Brain Project
  • Netherlands Organization for Scientific Research (917.76.360, 912.06.148, 604102)
Topics
  • Life Sciences › Neuroscience › Cellular and Molecular Neuroscience › Neuroscience and Neuropharmacology Research
  • Life Sciences › Neuroscience › Cognitive Neuroscience › Neural dynamics and brain function
  • Life Sciences › Neuroscience › Cognitive Neuroscience › Memory and Neural Mechanisms
Keywords
human neocortex, pyramidal neurons, dendritic morphology, axon morphology, cortical layers, temporal cortex, dendritic length, dendritic branching, passive electrical properties, signal attenuation, cross-species comparison
MeSH terms
Adult, Aged, Animals, Axons, Dendrites, Epilepsy, Female, Humans, Macaca fascicularis, Macaca mulatta, Male, Mice, Inbred C57BL, Middle Aged, Species Specificity, Temporal Lobe, Cluster Analysis, Pyramidal Cells, Neocortex, Mice, Young Adult

About these checks

Registry, retraction, Cites and statistics results are computed, not judged, with one exception: a printed reference that no index lists is read once by a model before it counts as a citation error. Claims are extracted by a model and kept only when their quote appears verbatim in the text; each cited source is then checked, with a model’s help, for whether it says what the claim relies on. Those verdicts can be wrong — read the claim’s quote and the cited source before relying on one.

Statistics and arithmetic are recomputed, not judged.

Confidence bands are shown only for fields calibrated on our annotated test set. None is calibrated yet, so no band is shown.

What counts as a claim ›How we measure confidence ›How we check this ›

Are you an author, or do you see a problem with this page? Request a review