

The DOI matches its Crossref record; 90 of the 90 references it cites were found in a registry or an index.
Cortical Foxp2 Supports Behavioral Flexibility and Developmental Dopamine D1 Receptor Expression
Published version of a preprint
Abstract
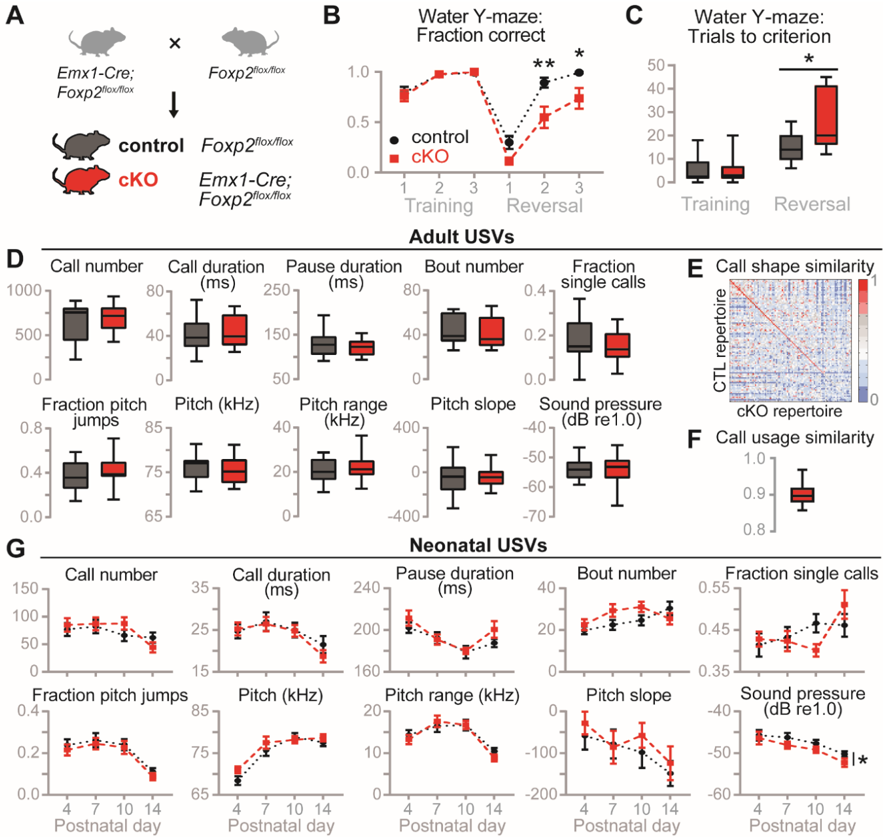
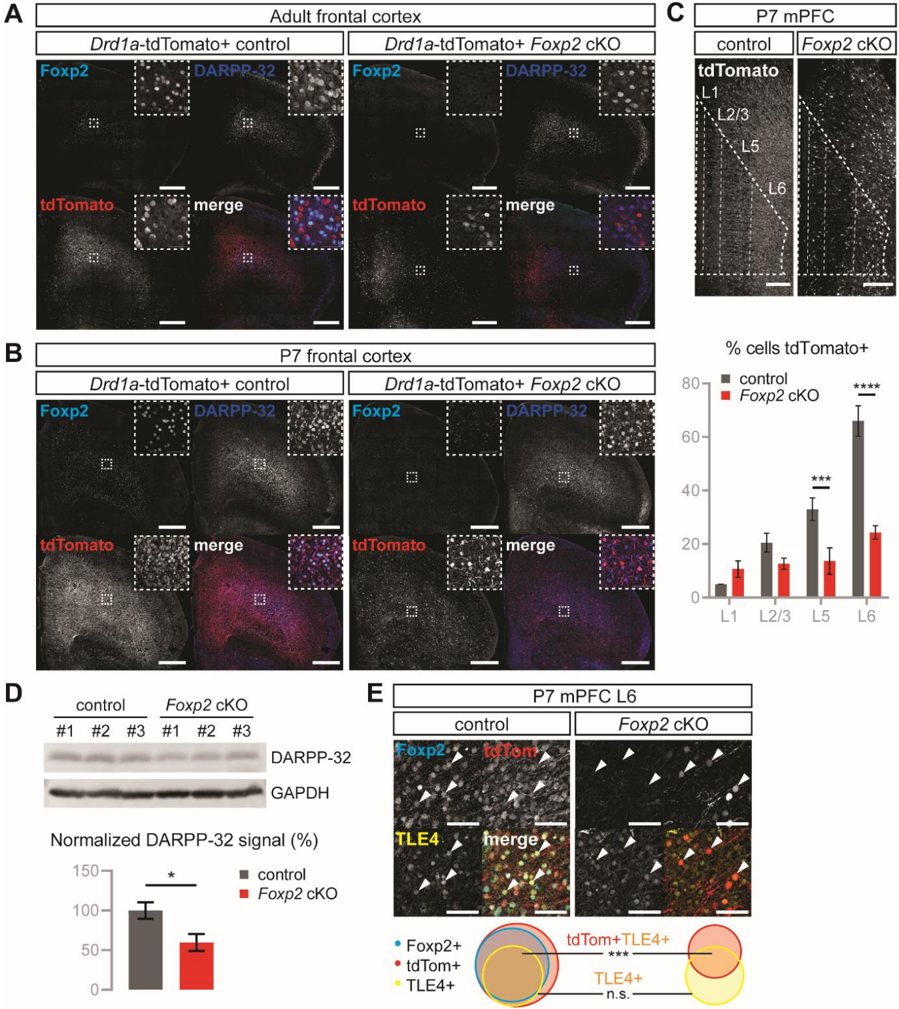
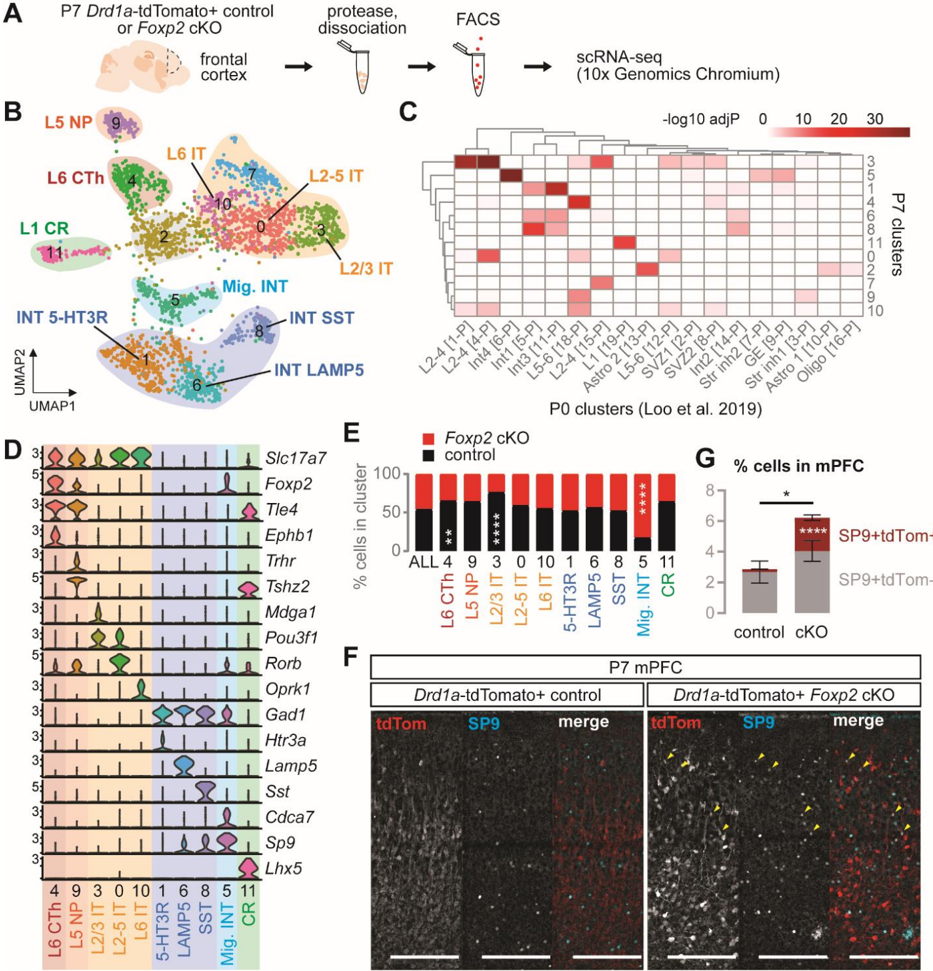
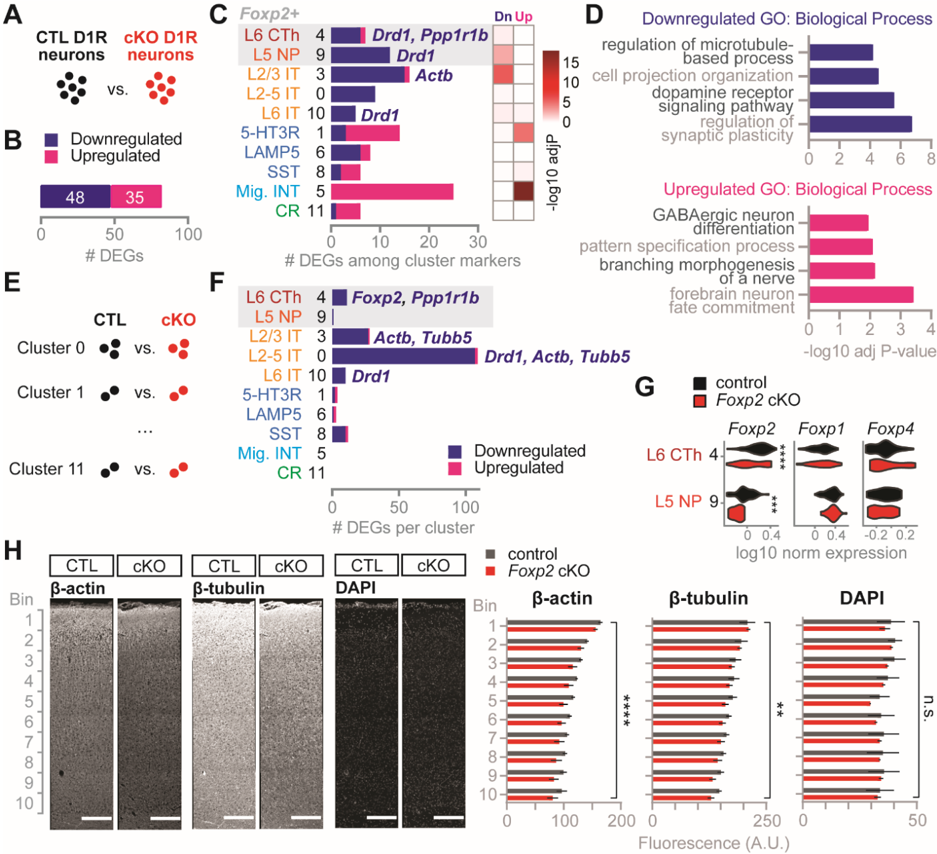
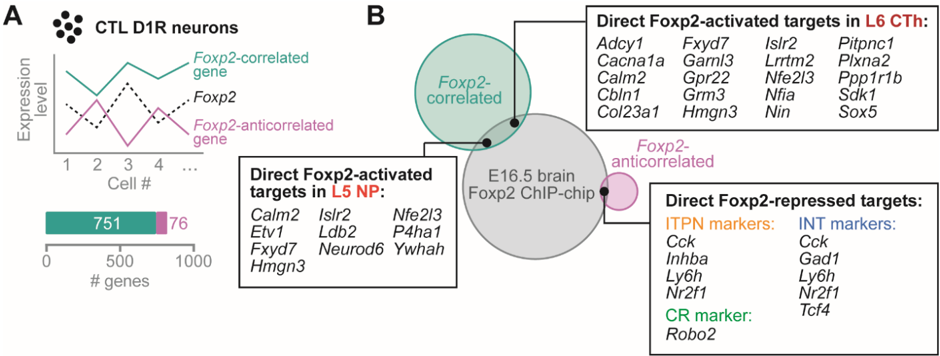
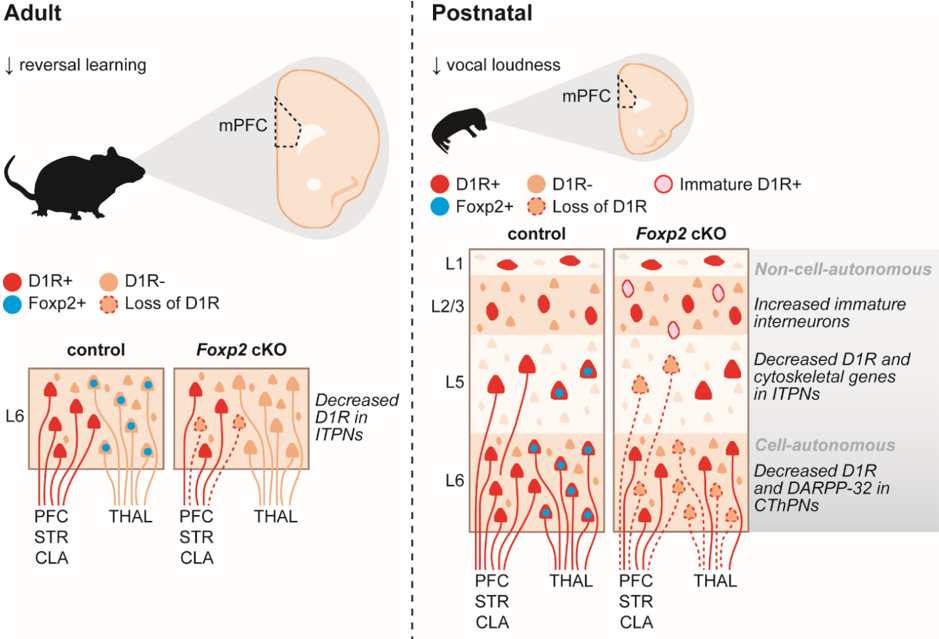
Genetic studies have associated FOXP2 variation with speech and language disorders and other neurodevelopmental disorders (NDDs) involving pathology of the cortex. In this brain region, FoxP2 is expressed from development into adulthood, but little is known about its downstream molecular and behavioral functions. Here, we characterized cortex-specific Foxp2 conditional knockout mice and found a major deficit in reversal learning, a form of behavioral flexibility. In contrast, they showed normal activity levels, anxiety, and vocalizations, save for a slight decrease in neonatal call loudness. These behavioral phenotypes were accompanied by decreased cortical dopamine D1 receptor (D1R) expression at neonatal and adult stages, while general cortical development remained unaffected. Finally, using single-cell transcriptomics, we identified at least five excitatory and three inhibitory D1R-expressing cell types in neonatal frontal cortex, and we found changes in D1R cell type composition and gene expression upon cortical Foxp2 deletion. Strikingly, these alterations included non-cell-autonomous changes in upper layer neurons and interneurons. Together, these data support a role for Foxp2 in the development of dopamine-modulated cortical circuits and behaviors relevant to NDDs.
Overview
The claims and statistics of this paper haven’t been checked yet.
Run the check — free, no account needed. It reads the open-access text and checks the sources it cites.
Integrity signals
Registry
Cites
Statistics
Figures
Verification
Claims the paper makes
The claims and statistics of this paper haven’t been checked yet.
Run the check — free, no account needed. It reads the open-access text and checks the sources it cites.
Claims other papers make about this one
Each is checked against this paper’s own text: does it say what the citing paper says it does?
In the citing paper
“Mechanistic studies have shown FoxP2 to regulate genes that contribute to neurite outgrowth and NN formation (51), and to influence dopamine-modulated cortical circuits (54) in the mouse brain.”
From Behavior-related gene regulatory networks: A new level of organization in the brain (2020) · cites this paper as [54]
Self-check
Percentages, sums and reported differences re-computed from the paper’s own numbers.
The self-check needs the paper’s full text.
Citations
Cites
STAR: ultrafast universal RNA-seq aligner
Dobin, A., Davis, C. A., Schlesinger, F., Drenkow, J., Zaleski, C., Jha, S., Batut, P., Chaisson, M., & Gingeras, T. R. (2013) · Bioinformatics · doi:10.1093/bioinformatics/bts635 · Cited by 51,709
featureCounts: an efficient general purpose program for assigning sequence reads to genomic features
Liao, Y., Smyth, G. K., & Shi, W. (2014) · Bioinformatics · doi:10.1093/bioinformatics/btt656 · Cited by 27,219
Integrating single-cell transcriptomic data across different conditions, technologies, and species
Butler, A., Hoffman, P., Smibert, P., Papalexi, E., & Satija, R. (2018) · Nature Biotechnology · doi:10.1038/nbt.4096 · Cited by 13,174
The Human Genome Browser at UCSC
Kent, W. J., Sugnet, C. W., Furey, T. S., Roskin, K. M., Pringle, T. H., Zahler, A. M., & Haussler, A. D. (2002) · Genome Research · doi:10.1101/gr.229102 · Cited by 10,400
Massively parallel digital transcriptional profiling of single cells
Zheng, G. X. Y., Terry, J. M., Belgrader, P., Ryvkin, P., Bent, Z. W., Wilson, R., Ziraldo, S. B., Wheeler, T. D., McDermott, G. P., Zhu, J., et al. (2017) · Nature Communications · doi:10.1038/ncomms14049 · Cited by 7,353
REVIGO summarizes and visualizes long lists of gene ontology terms
Supek, F., Bošnjak, M., Škunca, N., & Šmuc, T. (2011) · PLoS ONE · doi:10.1371/journal.pone.0021800 · Cited by 6,264
Stress signalling pathways that impair prefrontal cortex structure and function
Arnsten, A. F. T. (2009) · Nature Reviews Neuroscience · doi:10.1038/nrn2648 · Cited by 3,299
ToppGene Suite for gene list enrichment analysis and candidate gene prioritization
Chen, J., Bardes, E. E., Aronow, B. J., & Jegga, A. G. (2009) · Nucleic Acids Research · doi:10.1093/nar/gkp427 · Cited by 2,952
Satterstrom, F. K., Kosmicki, J. A., Wang, J., Breen, M. S., De Rubeis, S., An, J.-Y., Peng, M., Collins, R., Grove, J., Klei, L., et al. (2020) · Cell · doi:10.1016/j.cell.2019.12.036 · Cited by 2,321
ADHD Working Group of the Psychiatric Genomics Consortium (PGC), Demontis, D., Early Lifecourse & Genetic Epidemiology (EAGLE) Consortium, 23andMe Research Team, Walters, R. K., Martin, J., Mattheisen, M., Als, T. D., Agerbo, E., Baldursson, G., et al. (2019) · Nature Genetics · doi:10.1038/s41588-018-0269-7 · Cited by 2,203
Research works printed but not linked: 2
- Andrews, 2010, Fastqc: a quality control tool for high throughput sequence data
- Morgan, 2017, Genereviews((r))Foxp2-related speech and language disorders
Cited by
Confronting false discoveries in single-cell differential expression
Squair, J. W., Gautier, M., Kathe, C., Anderson, M. A., James, N. D., Hutson, T. H., Hudelle, R., Qaiser, T., Matson, K. J. E., Barraud, Q., et al. (2021) · doi:10.1101/2021.03.12.435024 · Cited by 1,086
Behavior-related gene regulatory networks: A new level of organization in the brain
Sinha, S., Jones, B. M., Traniello, I. M., Bukhari, S. A., Halfon, M. S., Hofmann, H. A., Huang, S., Katz, P. S., Keagy, J., Lynch, V. J., et al. (2020) · Proceedings of the National Academy of Sciences · doi:10.1073/pnas.1921625117 · Cited by 85
Matho, K. S., Huilgol, D., Galbavy, W., He, M., Kim, G., An, X., Lu, J., Wu, P., Di Bella, D. J., Shetty, A. S., et al. (2020) · doi:10.1101/2020.04.22.054064 · Cited by 20
Metadata
- Authors
- Co, M., Hickey, S. L., Kulkarni, A., Harper, M., & Konopka, G.
- Affiliations
- Department of Neuroscience, University of Texas Southwestern Medical Center, Dallas, TX, USA
- ORCID
- Konopka, Genevieve
- Venue
- Cerebral Cortex
- Publisher
- Oxford University Press (OUP)
- Published
- 2019-11-11
- Volume
- 30
- Issue
- 3
- Pages
- 1855-1870
- ISSN
- 1047-3211
- 1460-2199
- Cited by
- 48
- References
- 90
- Language
- en
- Licence
- academic.oup.com/journals/pages/open_access/funder_policies/chorus/standard_publication_model (vor)
- Funders
- National Institutes of Health (T32GM109776, TL1TR001104, DC014702, DC016340, MH102603)
- Autism Science Foundation (REG 15-002)
- Simons Foundation (SFARI 573689, 401220)
- James S. McDonnell Foundation (220020467)
- Silicon Valley Community Foundation (HCA-A-1704-01747)
About these checks
Registry, retraction, Cites and statistics results are computed, not judged, with one exception: a printed reference that no index lists is read once by a model before it counts as a citation error. Claims are extracted by a model and kept only when their quote appears verbatim in the text; each cited source is then checked, with a model’s help, for whether it says what the claim relies on. Those verdicts can be wrong — read the claim’s quote and the cited source before relying on one.
Statistics and arithmetic are recomputed, not judged.
Confidence bands are shown only for fields calibrated on our annotated test set. None is calibrated yet, so no band is shown.
What counts as a claim ›How we measure confidence ›How we check this ›
Are you an author, or do you see a problem with this page? Request a review
How to cite
Cite CoChat for the checks on this page, and the paper for its own findings.
- This page
- CoChat. (2026). Citation check: Cortical Foxp2 Supports Behavioral Flexibility and Developmental Dopamine D1 Receptor Expression. https://app.cochat.ai/papers/10.1093/cercor/bhz209
- The paper
- Co, M., Hickey, S. L., Kulkarni, A., Harper, M., & Konopka, G. (2020). Cortical Foxp2 Supports Behavioral Flexibility and Developmental Dopamine D1 Receptor Expression. Cerebral Cortex. https://doi.org/10.1093/cercor/bhz209
Data sources
Bibliographic data: Semantic Scholar, OpenAlex, Crossref.
Contains information from the Semantic Scholar Academic Graph Datasets, made available under the ODC Attribution License (ODC-BY 1.0).
Semantic Scholar’s data is described in: Kinney, R., et al. (2023). The Semantic Scholar Open Data Platform. arXiv:2301.10140.
