

The DOI matches its Crossref record; 31 of the 32 references it cites were found in a registry or an index.
Effect Size Guidelines, Sample Size Calculations, and Statistical Power in Gerontology
Open accessAbstract
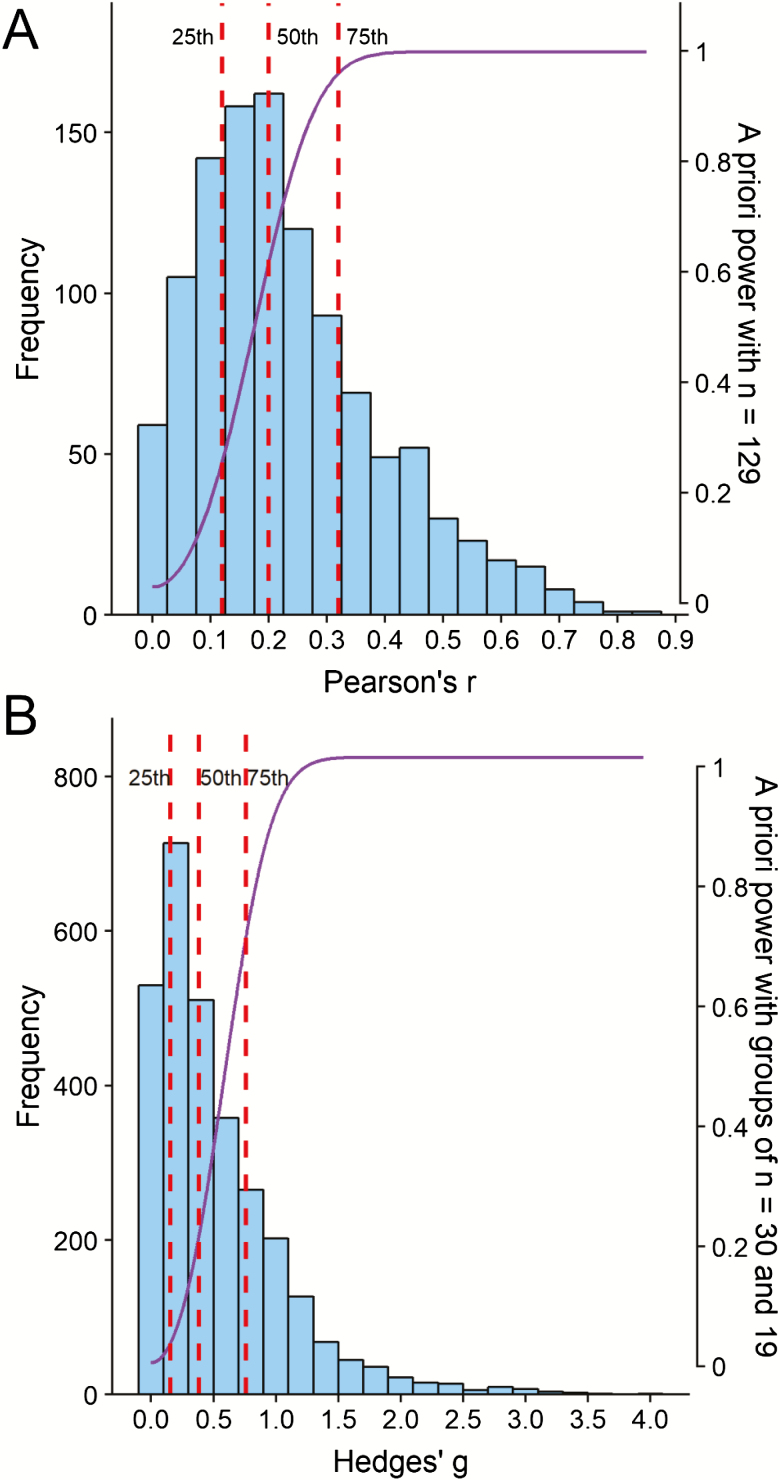
Background and Objectives: Researchers typically use Cohen’s guidelines of Pearson’s r = .10, .30, and .50, and Cohen’s d = 0.20, 0.50, and 0.80 to interpret observed effect sizes as small, medium, or large, respectively. However, these guidelines were not based on quantitative estimates and are only recommended if field-specific estimates are unknown. This study investigated the distribution of effect sizes in both individual differences research and group differences research in gerontology to provide estimates of effect sizes in the field. Research Design and Methods: Effect sizes (Pearson’s r, Cohen’s d, and Hedges’ g) were extracted from meta-analyses published in 10 top-ranked gerontology journals. The 25th, 50th, and 75th percentile ranks were calculated for Pearson’s r (individual differences) and Cohen’s d or Hedges’ g (group differences) values as indicators of small, medium, and large effects. A priori power analyses were conducted for sample size calculations given the observed effect size estimates. Results: Effect sizes of Pearson’s r = .12, .20, and .32 for individual differences research and Hedges’ g = 0.16, 0.38, and 0.76 for group differences research were interpreted as small, medium, and large effects in gerontology. Discussion and Implications: Cohen’s guidelines appear to overestimate effect sizes in gerontology. Researchers are encouraged to use Pearson’s r = .10, .20, and .30, and Cohen’s d or Hedges’ g = 0.15, 0.40, and 0.75 to interpret small, medium, and large effects in gerontology, and recruit larger samples.
Overview
The claims and statistics of this paper haven’t been checked yet.
Run the check — free, no account needed. It reads the open-access text and checks the sources it cites.
Integrity signals
Registry
Cites
Statistics
Figures
Verification
Claims the paper makes
The claims and statistics of this paper haven’t been checked yet.
Run the check — free, no account needed. It reads the open-access text and checks the sources it cites.
Claims other papers make about this one
Each is checked against this paper’s own text: does it say what the citing paper says it does?
The source backs part of the claim, not all of it — or backs it for a different population, condition or comparison.
In the citing paper
“placing it in a comparable range to other brief to medium-term attachment-based interventions, e.g., VIPP-SD (overall combined effect size r = 0.23, medium effect size; [13]).”
From Optimizing parenting and child outcomes following parent–child interaction therapy – toddler: a randomized controlled trial (2024) · cites this paper as [13]
Experimental — accuracy not yet measured
Self-check
Percentages, sums and reported differences re-computed from the paper’s own numbers.
The self-check needs the paper’s full text.
Citations
Cites
R: A Language and Environment for Statistical Computing
R Core Team (2000) · doi:10.32614/r.manuals · Cited by 355,893
Statistical Power Analysis for the Behavioral Sciences
Muller, K. E., & Cohen, J. (1989) · Technometrics · doi:10.2307/1270020 · Cited by 99,603
Statistical power analysis for the behavioral sciences
Cohen, J. (1990) · Computers Environment and Urban Systems · doi:10.1016/0198-9715(90)90050-4 · Cited by 65,417
Conducting Meta-Analyses in R with the metafor Package
Viechtbauer, W. (2010) · Journal of Statistical Software · doi:10.18637/jss.v036.i03 · Cited by 20,464
Duval, S., & Tweedie, R. (2000) · Biometrics · doi:10.1111/j.0006-341x.2000.00455.x · Cited by 14,099
Lakens, D. (2013) · Frontiers in Psychology · doi:10.3389/fpsyg.2013.00863 · Cited by 10,303
Cohen, J. (1992) · Psychological Bulletin · doi:10.1037//0033-2909.112.1.155 · Cited by 8,771
Power failure: why small sample size undermines the reliability of neuroscience
Button, K. S., Ioannidis, J. P. A., Mokrysz, C., Nosek, B. A., Flint, J., Robinson, E. S. J., & Munafò, M. R. (2013) · Nature Reviews Neuroscience · doi:10.1038/nrn3475 · Cited by 7,641
Simmons, J. P., Nelson, L. D., & Simonsohn, U. (2011) · Psychological Science · doi:10.1177/0956797611417632 · Cited by 6,567
Effect size guidelines for individual differences researchers
Gignac, G. E., & Szodorai, E. T. (2016) · Personality and Individual Differences · doi:10.1016/j.paid.2016.06.069 · Cited by 2,860
Statistical methods in psychology journals: Guidelines and explanations.
Wilkinson, L., & Task Force on Statistical Inference (1999) · American Psychologist · doi:10.1037/0003-066x.54.8.594 · Cited by 2,791
Peters, J. L., Sutton, A. J., Jones, D. R., Abrams, K. R., & Rushton, L. (2008) · Journal of Clinical Epidemiology · doi:10.1016/j.jclinepi.2007.11.010 · Cited by 2,053
(2011) · Cited by 2,025
The statistical power of abnormal-social psychological research: A review.
Cohen, J. (1962) · The Journal of Abnormal and Social Psychology · doi:10.1037/h0045186 · Cited by 1,824
Why Most Discovered True Associations Are Inflated
Ioannidis, J. P. A. (2008) · Epidemiology · doi:10.1097/ede.0b013e31818131e7 · Cited by 1,495
Interpreting the magnitudes of correlation coefficients.
Hemphill, J. F. (2003) · American Psychologist · doi:10.1037/0003-066x.58.1.78 · Cited by 1,237
The rules of the game called psychological science
Bakker, M., van Dijk, A., & Wicherts, J. M. (2012) · Perspectives on Psychological Science · doi:10.1177/1745691612459060 · Cited by 800
Schäfer, T., & Schwarz, M. A. (2019) · Frontiers in Psychology · doi:10.3389/fpsyg.2019.00813 · Cited by 774
Szucs, D., & Ioannidis, J. P. A. (2017) · PLOS Biology · doi:10.1371/journal.pbio.2000797 · Cited by 761
p -Curve and Effect Size: Correcting for Publication Bias Using Only Significant Results
Simonsohn, U., Nelson, L. D., & Simmons, J. P. (2014) · Perspectives on Psychological Science · doi:10.1177/1745691614553988 · Cited by 717
Maxwell, S. E. (2004) · Psychological Methods · doi:10.1037/1082-989x.9.2.147 · Cited by 655
Ferguson, C. J., & Heene, M. (2012) · Perspectives on Psychological Science · doi:10.1177/1745691612459059 · Cited by 603
Meta-analysis using effect size distributions of only statistically significant studies.
van Assen, M. A. L. M., van Aert, R. C. M., & Wicherts, J. M. (2015) · Psychological Methods · doi:10.1037/met0000025 · Cited by 265
van Aert, R. C. M., Wicherts, J. M., & van Assen, M. A. L. M. (2016) · Perspectives on Psychological Science · doi:10.1177/1745691616650874 · Cited by 219
Low statistical power in biomedical science: a review of three human research domains
Dumas-Mallet, E., Button, K. S., Boraud, T., Gonon, F., & Munafò, M. R. (2017) · Royal Society Open Science · doi:10.1098/rsos.160254 · Cited by 208
Statistical considerations for reporting and planning heart rate variability case‐control studies
Quintana, D. S. (2017) · Psychophysiology · doi:10.1111/psyp.12798 · Cited by 192
Brydges, C. R., & Bielak, A. A. M. (2019) · The Journals of Gerontology Series B · doi:10.1093/geronb/gbz033 · Cited by 32
Self-citationStatistical Power Analysis: Implications for Researchers, Planners, and Practitioners in Gerontology
Levenson, R. L. (1980) · The Gerontologist · doi:10.1093/geront/20.4.494 · Cited by 16
Renkewitz, F., & Keiner, M. (2018) · PsyArXiv (OSF Preprints) · doi:10.31234/osf.io/w94ep · Cited by 15
Pruchno, R. A., Bowers, B. J., Castle, N. G., Gonyea, J. G., Kivnick, H. Q., Meeks, S., & Williamson, J. B. (2015) · The Gerontologist · doi:10.1093/geront/gnv141 · Cited by 13
Planning for the Future of Psychological Research on Aging
Isaacowitz, D. M. (2017) · The Journals of Gerontology Series B · doi:10.1093/geronb/gbx142 · Cited by 13
Research works printed but not linked: 1
- Morey, 2016, Why most of psychology is unfalsifiable
Cited by
Sorted by citations
Effect size guidelines for cross-lagged effects.
Orth, U., Meier, L. L., Bühler, J. L., Dapp, L. C., Krauss, S., Messerli, D., & Robins, R. W. (2022) · Psychological Methods · doi:10.1037/met0000499 · Cited by 780
Evaluation of a decided sample size in machine learning applications
Rajput, D., Wang, W.-J., & Chen, C.-C. (2023) · BMC Bioinformatics · doi:10.1186/s12859-023-05156-9 · Cited by 411
Age Advantages in Emotional Experience Persist Even Under Threat From the COVID-19 Pandemic
Carstensen, L. L., Shavit, Y. Z., & Barnes, J. T. (2020) · Psychological Science · doi:10.1177/0956797620967261 · Cited by 299
Powering population health research: Considerations for plausible and actionable effect sizes
Matthay, E. C., Hagan, E., Gottlieb, L. M., Tan, M. L., Vlahov, D., Adler, N. E., & Glymour, M. M. (2021) · SSM - Population Health · doi:10.1016/j.ssmph.2021.100789 · Cited by 199
Sturm, G., Karan, K. R., Monzel, A. S., Santhanam, B., Taivassalo, T., Bris, C., Ware, S. A., Cross, M., Towheed, A., Higgins‐Chen, A., et al. (2023) · Communications Biology · doi:10.1038/s42003-022-04303-x · Cited by 150
Metadata
- Authors
- Brydges, C. R.
- Affiliations
- Colorado State University (US)
- Corresponding author
- Brydges, Christopher R
- Venue
- Innovation in Aging
- Publisher
- Oxford University Press (OUP)
- Published
- 2019-08-01
- Volume
- 3
- Issue
- 4
- Pages
- igz036-igz036
- ISSN
- 2399-5300 (ISSN-L)
- PMC
- PMC6736231
- OpenAlex
- W2972140183
- Cited by
- 826
- References
- 32
- Citations by year
- 2026: 212 · 2025: 212 · 2024: 168 · 2023: 90 · 2022: 68 · 2021: 56 · 2020: 18 · 2019: 1
- FWCI
- 23.92
- Type
- journal article
- Language
- en
- Open access
- gold
- doi.org
- Licence
- Locations
- Innovation in Aging (publishedVersion, cc-by)
- PubMed Central (publishedVersion, cc-by)
- PubMed (publishedVersion)
- Topics
- Social Sciences › Decision Sciences › Statistics, Probability and Uncertainty › Meta-analysis and systematic reviews
- Social Sciences › Psychology › Experimental and Cognitive Psychology › Psychology Research and Bibliometrics
- Physical Sciences › Mathematics › Statistics and Probability › Statistical Methods in Epidemiology
- Keywords
- effect size interpretation, Cohen's d, Hedges' g, Pearson correlation, sample size determination, statistical power, gerontology, individual differences, group differences, meta-analysis, effect size distribution, aging research
About these checks
Registry, retraction, Cites and statistics results are computed, not judged, with one exception: a printed reference that no index lists is read once by a model before it counts as a citation error. Claims are extracted by a model and kept only when their quote appears verbatim in the text; each cited source is then checked, with a model’s help, for whether it says what the claim relies on. Those verdicts can be wrong — read the claim’s quote and the cited source before relying on one.
Statistics and arithmetic are recomputed, not judged.
Confidence bands are shown only for fields calibrated on our annotated test set. None is calibrated yet, so no band is shown.
What counts as a claim ›How we measure confidence ›How we check this ›
Are you an author, or do you see a problem with this page? Request a review
