

The DOI matches its Crossref record; 61 of the 61 references it cites were found in a registry or an index.
Isolation of MECP2-null Rett Syndrome patient hiPS cells and isogenic controls through X-chromosome inactivation
Open accessAbstract
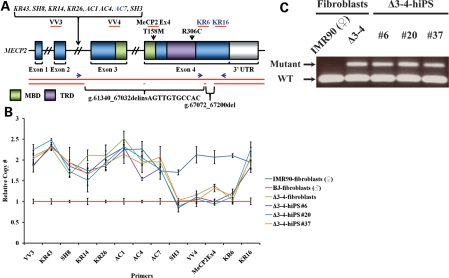
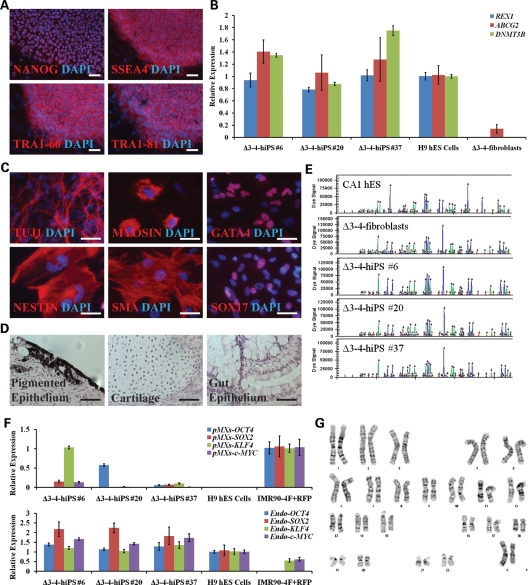
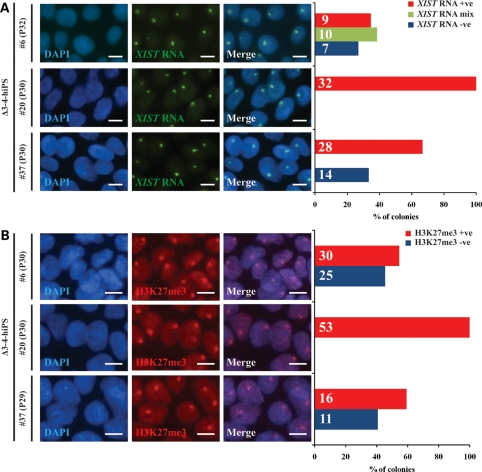
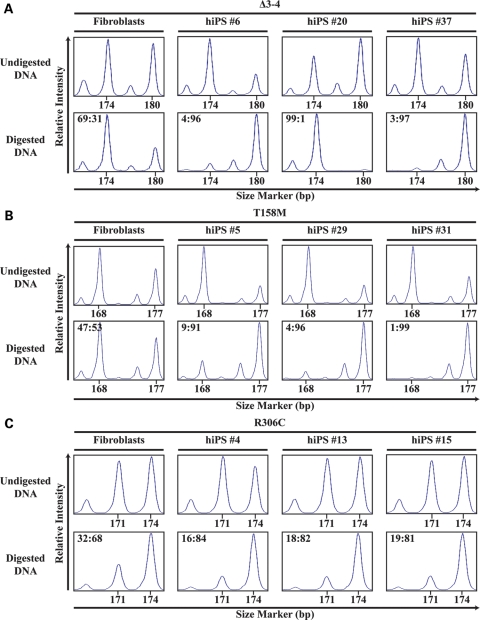
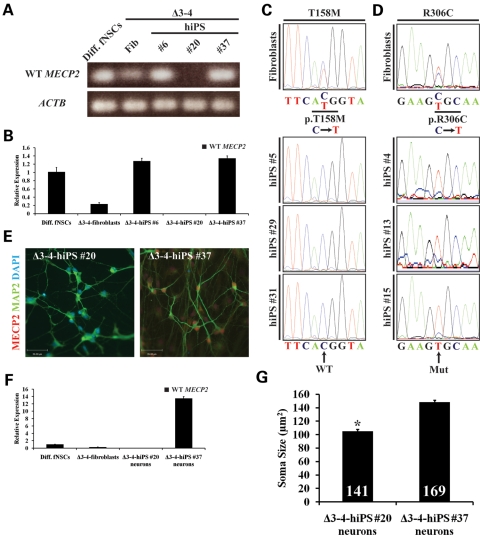
Rett syndrome (RTT) is a neurodevelopmental autism spectrum disorder that affects girls due primarily to mutations in the gene encoding methyl-CpG binding protein 2 (MECP2). The majority of RTT patients carry missense and nonsense mutations leading to a hypomorphic MECP2, while null mutations leading to the complete absence of a functional protein are rare. MECP2 is an X-linked gene subject to random X-chromosome inactivation resulting in mosaic expression of mutant MECP2. The lack of human brain tissue motivates the need for alternative human cellular models to study RTT. Here we report the characterization of a MECP2 mutation in a classic female RTT patient involving rearrangements that remove exons 3 and 4 creating a functionally null mutation. To generate human neuron models of RTT, we isolated human induced pluripotent stem (hiPS) cells from RTT patient fibroblasts. RTT-hiPS cells retained the MECP2 mutation, are pluripotent and fully reprogrammed, and retained an inactive X-chromosome in a nonrandom pattern. Taking advantage of the latter characteristic, we obtained a pair of isogenic wild-type and mutant MECP2 expressing RTT-hiPS cell lines that retained this MECP2 expression pattern upon differentiation into neurons. Phenotypic analysis of mutant RTT-hiPS cell-derived neurons demonstrated a reduction in soma size compared with the isogenic control RTT-hiPS cell-derived neurons from the same RTT patient. Analysis of isogenic control and mutant hiPS cell-derived neurons represents a promising source for understanding the pathogenesis of RTT and the role of MECP2 in human neurons.
Overview
The claims and statistics of this paper haven’t been checked yet.
Run the check — free, no account needed. It reads the open-access text and checks the sources it cites.
Integrity signals
Registry
Cites
Statistics
Figures
Verification
Claims the paper makes
The claims and statistics of this paper haven’t been checked yet.
Run the check — free, no account needed. It reads the open-access text and checks the sources it cites.
Claims other papers make about this one
Each is checked against this paper’s own text: does it say what the citing paper says it does?
In the citing paper
“As a proof-of-principle, several recent studies have now shown that hiPSC-derived neurons from patients with psychiatric disorders exhibit significant aberrations in neuronal connectivity, synapse maturation, and synaptic function compared with those of healthy controls (Brennand et al., 2011; Cheung et al., 2011; Marchetto et al., 2010; Pasca et al., 2011).”
From CNVs: Harbingers of a Rare Variant Revolution in Psychiatric Genetics (2012) · cites this paper as Cheung et al., 2011
Self-check
Percentages, sums and reported differences re-computed from the paper’s own numbers.
The self-check needs the paper’s full text.
Citations
Cites
Induction of Pluripotent Stem Cells from Adult Human Fibroblasts by Defined Factors
Takahashi, K., Tanabe, K., Ohnuki, M., Narita, M., Ichisaka, T., Tomoda, K., & Yamanaka, S. (2007) · Cell · doi:10.1016/j.cell.2007.11.019 · Cited by 20,221
Induced Pluripotent Stem Cell Lines Derived from Human Somatic Cells
Yu, J., Vodyanik, M. A., Smuga-Otto, K., Antosiewicz-Bourget, J., Frane, J. L., Tian, S., Nie, J., Jonsdottir, G. A., Ruotti, V., Stewart, R., et al. (2007) · Science · doi:10.1126/science.1151526 · Cited by 10,310
Rett syndrome is caused by mutations in X-linked MECP2, encoding methyl-CpG-binding protein 2
Amir, R. E., Van den Veyver, I. B., Wan, M., Tran, C. Q., Francke, U., & Zoghbi, H. Y. (1999) · Nature Genetics · doi:10.1038/13810 · Cited by 4,990
Nan, X., Ng, H.-H., Johnson, C. A., Laherty, C. D., Turner, B. M., Eisenman, R. N., & Bird, A. (1998) · Nature · doi:10.1038/30764 · Cited by 3,440
Reprogramming of human somatic cells to pluripotency with defined factors
Park, I.-H., Zhao, R., West, J. A., Yabuuchi, A., Huo, H., Ince, T. A., Lerou, P. H., Lensch, M. W., & Daley, G. Q. (2008) · Nature · doi:10.1038/nature06534 · Cited by 2,436
Disease-Specific Induced Pluripotent Stem Cells.
Park, I.-H., Arora, N., Huo, H., Maherali, N., Ahfeldt, T., Shimamura, A., Lensch, M. W., Cowan, C., Hochedlinger, K., & Daley, G. Q. (2008) · Cell · doi:10.1016/j.cell.2008.07.041 · Cited by 2,196 · cited 1×
“D3–4-hiPS cells were fully reprogrammed, as retroviral transgenes were largely silenced and have simultaneously reactivated the endogenous loci of the reprogramming factors similar to previously published patient-specific hiPS cell lines (29,31,32) (Fig.”
ResultDimos, J. T., Rodolfa, K. T., Niakan, K. K., Weisenthal, L. M., Mitsumoto, H., Chung, W. K., Croft, G. F., Saphier, G., Leibel, R. L., Goland, R., et al. (2008) · Science · doi:10.1126/science.1158799 · Cited by 2,019
MeCP2, a Key Contributor to Neurological Disease, Activates and Represses Transcription
Chahrour, M., Jung, S. Y., Shaw, C., Zhou, X., Wong, S. T. C., Qin, J., & Zoghbi, H. Y. (2008) · Science · doi:10.1126/science.1153252 · Cited by 1,823
Maherali, N., Sridharan, R., Xie, W., Utikal, J., Eminli, S., Arnold, K., Stadtfeld, M., Yachechko, R., Tchieu, J., Jaenisch, R., et al. (2007) · Cell stem cell · doi:10.1016/j.stem.2007.05.014 · Cited by 1,725
A mouse Mecp2-null mutation causes neurological symptoms that mimic Rett syndrome
Guy, J., Hendrich, B., Holmes, M., Martin, J. E., & Bird, A. (2001) · Nature Genetics · doi:10.1038/85899 · Cited by 1,558
Cited by
Sorted by citations
CNVs: Harbingers of a Rare Variant Revolution in Psychiatric Genetics
Malhotra, D., & Sebat, J. (2012) · Cell · doi:10.1016/j.cell.2012.02.039 · Cited by 854
Neurodevelopmental model of schizophrenia: update 2012
Rapoport, J. L., Giedd, J. N., & Gogtay, N. (2012) · Molecular Psychiatry · doi:10.1038/mp.2012.23 · Cited by 790
Induced pluripotent stem cells: the new patient?
Bellin, M., Marchetto, M. C., Gage, F. H., & Mummery, C. L. (2012) · Nature Reviews Molecular Cell Biology · doi:10.1038/nrm3448 · Cited by 454
Genetic and Epigenetic Variations in iPSCs: Potential Causes and Implications for Application
Liang, G., & Zhang, Y. (2013) · Cell stem cell · doi:10.1016/j.stem.2013.07.001 · Cited by 383
Erosion of Dosage Compensation Impacts Human iPSC Disease Modeling
Mekhoubad, S., Bock, C., de Boer, A. S., Kiskinis, E., Meissner, A., & Eggan, K. C. (2012) · Cell stem cell · doi:10.1016/j.stem.2012.02.014 · Cited by 366
Metadata
- Authors
- Cheung, A. Y. L., Horvath, L. M., Grafodatskaya, D., Pasceri, P., Weksberg, R., Hotta, A., Carrel, L., & Ellis, J.
- Affiliations
- University of Toronto (CA)
- Pennsylvania State University (US)
- Hospital for Sick Children (CA)
- Biologie du Développement et Cellules Souches (FR)
- Corresponding author
- Ellis, James
- Venue
- Human Molecular Genetics
- Publisher
- Oxford University Press (OUP)
- Published
- 2011-03-03
- Volume
- 20
- Issue
- 11
- Pages
- 2103-2115
- ISSN
- 0964-6906 (ISSN-L)
- 1460-2083
- PMC
- PMC3090191
- OpenAlex
- W2103756619
- Cited by
- 271
- References
- 61
- Citations by year
- 2026: 3 · 2025: 6 · 2024: 13 · 2023: 15 · 2022: 5 · 2021: 3 · 2020: 21 · 2019: 15 · 2018: 19 · 2017: 19 · 2016: 20 · 2015: 30 · 2014: 19 · 2013: 24 · 2012: 42
- FWCI
- 20.35
- Type
- journal article
- Language
- en
- Open access
- hybrid
- doi.org
- Licence
- cc-by-nc
- Locations
- Human Molecular Genetics (publishedVersion, cc-by-nc)
- PubMed Central (publishedVersion, cc-by-nc)
- PubMed (publishedVersion)
- Funders
- Canadian Institutes of Health Research (RMF92090, 94505_1, MOP102649)
- Eunice Kennedy Shriver National Institute of Child Health and Human Development (HD056452, R01HD056452)
- Topics
- Life Sciences › Biochemistry, Genetics and Molecular Biology › Genetics › Genetics and Neurodevelopmental Disorders
- Life Sciences › Biochemistry, Genetics and Molecular Biology › Molecular Biology › Pluripotent Stem Cells Research
- Health Sciences › Medicine › Ophthalmology › Retinal Development and Disorders
- Keywords
- Rett syndrome, MeCP2, X chromosome inactivation, induced pluripotent stem cells, isogenic cell lines, fibroblast reprogramming, neurodevelopmental disorders, autism spectrum disorder
- MeSH terms
- Brain, Cell Differentiation, Cell Line, Chromosome Mapping, Exons, Female, Gene Expression Regulation, Genotype, Humans, Immunohistochemistry, Karyotyping, Male, Mutation, Neurons, Phenotype, Rett Syndrome, DNA Fingerprinting, Chromosomes, Human, X, X Chromosome Inactivation, Genes, X-Linked, Methyl-CpG-Binding Protein 2, Induced Pluripotent Stem Cells
About these checks
Registry, retraction, Cites and statistics results are computed, not judged, with one exception: a printed reference that no index lists is read once by a model before it counts as a citation error. Claims are extracted by a model and kept only when their quote appears verbatim in the text; each cited source is then checked, with a model’s help, for whether it says what the claim relies on. Those verdicts can be wrong — read the claim’s quote and the cited source before relying on one.
Statistics and arithmetic are recomputed, not judged.
Confidence bands are shown only for fields calibrated on our annotated test set. None is calibrated yet, so no band is shown.
What counts as a claim ›How we measure confidence ›How we check this ›
Are you an author, or do you see a problem with this page? Request a review
