Cited by 76

The DOI matches its Crossref record; 9 of the 9 references it cites were found in a registry or an index.

Small Extracellular Vesicles in Rat Serum Contain Astrocyte-Derived Protein Biomarkers of Repetitive Stress

Gómez-Molina, Cristóbal, Sandoval, Mauricio, Henzi, Roberto, Ramírez, Juan Pablo, Varas-Godoy, Manuel, Luarte, Alejandro, Lafourcade, Carlos Andres, Lopez-Verrilli, Alejandra, Smalla, Karl-Heinz, Kaehne, Thilo, Wyneken, Ursula·2019·International Journal of Neuropsychopharmacology

Overview

The claims and statistics of this paper haven’t been checked yet.

Run the check — free, no account needed. It reads the open-access text and checks the sources it cites.

A few free checks a day · papers already verified open instantly · results are public

Integrity signals

Registry

Crossref · 10.1093/ijnp/pyy098

Cites

9 of 9 references verified0 citation errors · 0 not checkable

Statistics

Figures

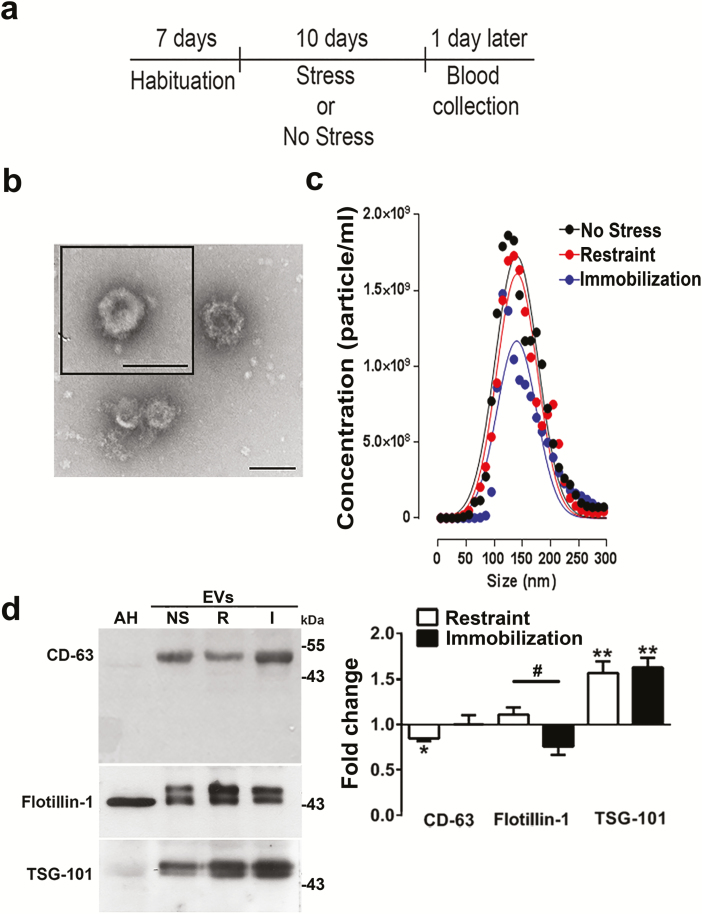
Figure 1. Characterization of small extracellular vesicles (sEVs). (a) Experimental design: rats were habituated in their home cages for 7 days. Then, stress by restraint or immobilization or no stress was applied for 10 days. (b) Images of sEVs obtained by electron microscopy. Bar scale = 100 nm. (c) sEV size and concentration detected by the nanoparticle tracking analysis in 4 to 6 independent samples per animal group. (d) Western blots and (e) the corresponding densitometric quantification of changes in the content of the indicated proteins in the experimental conditions: no stress (NS), restraint (R), or immobilization (I). Equal amounts of proteins were loaded per lane (including astrocyte homogenates, AH). The data represent mean ± SEM. n = 10 for CD-63, n = 8 and 5 for flotillin after restraint and immobilization, respectively; n = 7 for TSG-101. #P < .05 in the Mann-Whitney test (used to compare pairs of data, i.e., restraint vs immobilization). *P < .05, **P < .01 in a Wilcoxon-signed rank test (to compare with a hypothetical value of 0 (no change).
Figure 1. Characterization of small extracellular vesicles (sEVs). (a) Experimental design: rats were habituated in their home cages for 7 days. Then, stress by restraint or immobilization or no stress was applied for 10 days. (b) Images of sEVs obtained by electron microscopy. Bar scale = 100 nm. (c) sEV size and concentration detected by the nanoparticle tracking analysis in 4 to 6 independent samples per animal group. (d) Western blots and (e) the corresponding densitometric quantification of changes in the content of the indicated proteins in the experimental conditions: no stress (NS), restraint (R), or immobilization (I). Equal amounts of proteins were loaded per lane (including astrocyte homogenates, AH). The data represent mean ± SEM. n = 10 for CD-63, n = 8 and 5 for flotillin after restraint and immobilization, respectively; n = 7 for TSG-101. #P < .05 in the Mann-Whitney test (used to compare pairs of data, i.e., restraint vs immobilization). *P < .05, **P < .01 in a Wilcoxon-signed rank test (to compare with a hypothetical value of 0 (no change).CC BY-NC · PubMed Central
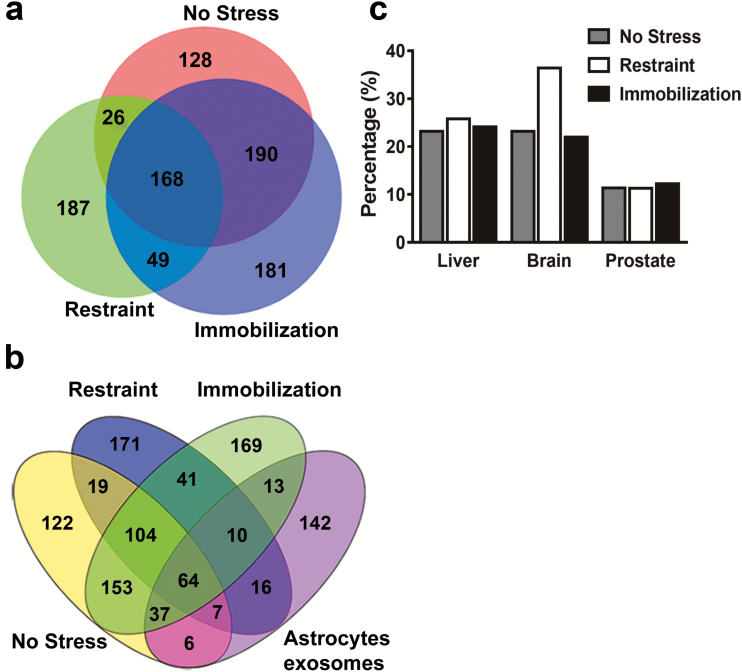
Figure 2. Proteomic analysis of extracellular vesicles (EVs) show that after restraint, proteins that are expressed in the brain are increased. (a) Venn analysis of the identified proteins in the experimental conditions. (b) Venn analysis of the identified proteins including the proteome of astrocyte small extracellular vesicles (sEVs). (c) The percentage of expression of the identified proteins in different body organs is shown (obtained with DAVID Bioinformatics Resources 6.8 [NIAID, NIH]).
Figure 2. Proteomic analysis of extracellular vesicles (EVs) show that after restraint, proteins that are expressed in the brain are increased. (a) Venn analysis of the identified proteins in the experimental conditions. (b) Venn analysis of the identified proteins including the proteome of astrocyte small extracellular vesicles (sEVs). (c) The percentage of expression of the identified proteins in different body organs is shown (obtained with DAVID Bioinformatics Resources 6.8 [NIAID, NIH]).CC BY-NC · PubMed Central
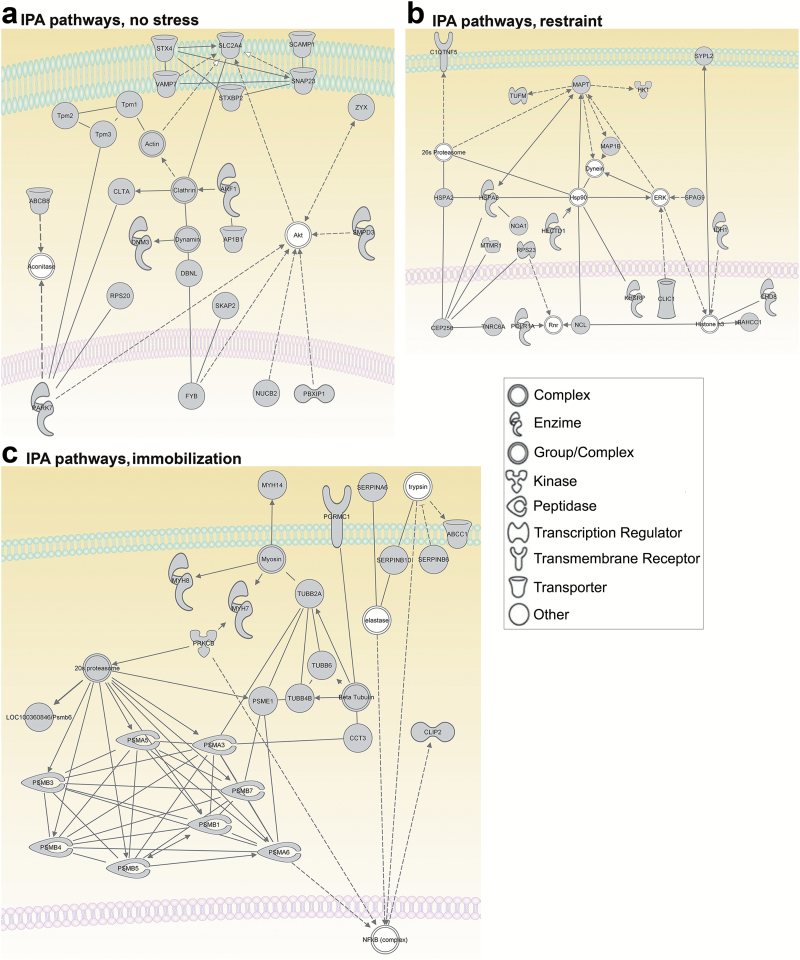
Figure 3. Network analysis of proteins identified exclusively in one of the experimental conditions (no stress, restraint, or immobilization). Dotted lines indicate indirect interactions; solid lines represent direct interactions between proteins. (a) Network analysis of the proteins identified uniquely in the small extracellular vesicles (sEVs) of the no stress group indicated the convergence of survival pathways/cell protection and intracellular trafficking. ABCB8, ATP-binding cassette, subfamily B (MDR/TAP), member 8; aconitase, aconitate hydratase; actin, G-actin; Akt, AKT1/2/3; AP1B1, adaptor protein complex AP-1, β 1 subunit; ARF1, ADP-ribosylation factor 1; CLTA, clathrin, light chain A; DBNL, drebrin-like protein; DNM3, dynamin 3; dynamin, dynamin GTPase; FYB, FYN binding protein; NUCB2, nucleobindin 2; PARK7, parkinson protein 7; PBXIP1, pre-B-cell leukemia transcription factor interacting protein 1; RPS20, ribosomal protein S20; SCAMP1, secretory carrier membrane protein 1; SKAP2, src kinase associated phosphoprotein 2; SLC2A4, solute carrier family 2 (facilitated glucose transporter), member 4; SMPD3, sphingomyelin phosphodiesterase 3; SNAP23, synaptosomal-associated protein 23; STX4, syntaxin 4; STXBP2, syntaxin binding protein 2; Tpm1, tropomyosin 1α; Tpm2, tropomyosin 2β; Tpm3, tropomyosin 3; VAMP7, vesicle-associated membrane protein 7; ZYX, zyxin. (b) Network analysis of proteins identified uniquely in the sEVs after restraint indicated proteins related to cellular stress responses. 26 s Proteasome, Proteasome; BAHCC1, BAH domain and coiled-coil containing 1; C1QTNF5, C1q and tumor necrosis factor related protein 5; CEP250, centrosomal protein 2; CHD8, chromodomain helicase DNA binding protein 8; CLIC1, chloride intracellular channel 1; ERK, p42/44 MAPK; HECTD1, HECT domain-containing E3 ubiquitin protein ligase 1; Histone h3, Histone H3B; HK1, hexokinase 1; Hsp90, Heat shock protein 90 kDa; HSPA2, heat shock 70 kDa protein 2; HSPA8, Heat Shock 70kD Protein 8; IDH1, isocitrate dehydrogenase 1; KHSRP, KH-type splicing regulatory protein; MAP1B, microtubule-associated protein 1B; MAPT, microtubule-associated protein tau; MTMR1, Myotubularin Related Protein 1; NCL, nucleolin; NOA1, nitric oxide associated 1; POLR1A, polymerase (RNA) I polypeptide A; Rnr, 47S Pre-rRNA, Ribosomal; RPS23, ribosomal protein S23; SPAG9, sperm associated antigen 9; SYPL2, synaptophysin-like 2; TNRC6A, trinucleotide repeat containing 6A; TUFM, Tu translation elongation factor. (c) Network analysis of the proteins identified uniquely in the sEVs after immobilization paradigm indicated protein components related to cancer and hematological and immunological diseases. 20 S proteasome, 20 S Core Complex; ABCC1, ATP-binding cassette, subfamily C (CFTR/MRP); CCT3:, chaperonin-containing TCP1, subunit 3 (gamma); CLIP2, CAP-GLY domain-containing linker protein 2; elastase, serine elastase; OC100360846/Psmb6, proteasome subunit β 6; MYH14, myosin, heavy chain 14; MYH7, beta cardiac myosin heavy chain; MYH8, myosin, heavy chain 8; NFkB (complex), transcription factor nuclear factor κ b; PGRMC1, progesterone receptor membrane component 1; PRKCB, protein kinase C β II; PSMA3, proteasome subunit α 3; PSMA5, proteasome subunit α 5; PSMA6, proteasome subunit α 6; PSMB1, proteasome subunit β 1; PSMB3, proteasome subunit β 3; PSMB4, proteasome subunit β 3; PSMB5, poteasome subunit β 5; PSMB7, proteasome subunit β 7; PSME1, Proteasome activator pa28 α subunit; SERPINA6, Corticosteroid-binding globulin, serine (or cysteine) peptidase inhibitor; SERPINB10, serine (or cysteine) peptidase inhibitor, clade B; SERPINB6, serine (or cysteine) peptidase inhibitor, clade B, member 6; TUBB2A, tubulin, β 2A; TUBB4B, tubulin, β 4B; TUBB6, tubulin, β 6.
Figure 3. Network analysis of proteins identified exclusively in one of the experimental conditions (no stress, restraint, or immobilization). Dotted lines indicate indirect interactions; solid lines represent direct interactions between proteins. (a) Network analysis of the proteins identified uniquely in the small extracellular vesicles (sEVs) of the no stress group indicated the convergence of survival pathways/cell protection and intracellular trafficking. ABCB8, ATP-binding cassette, subfamily B (MDR/TAP), member 8; aconitase, aconitate hydratase; actin, G-actin; Akt, AKT1/2/3; AP1B1, adaptor protein complex AP-1, β 1 subunit; ARF1, ADP-ribosylation factor 1; CLTA, clathrin, light chain A; DBNL, drebrin-like protein; DNM3, dynamin 3; dynamin, dynamin GTPase; FYB, FYN binding protein; NUCB2, nucleobindin 2; PARK7, parkinson protein 7; PBXIP1, pre-B-cell leukemia transcription factor interacting protein 1; RPS20, ribosomal protein S20; SCAMP1, secretory carrier membrane protein 1; SKAP2, src kinase associated phosphoprotein 2; SLC2A4, solute carrier family 2 (facilitated glucose transporter), member 4; SMPD3, sphingomyelin phosphodiesterase 3; SNAP23, synaptosomal-associated protein 23; STX4, syntaxin 4; STXBP2, syntaxin binding protein 2; Tpm1, tropomyosin 1α; Tpm2, tropomyosin 2β; Tpm3, tropomyosin 3; VAMP7, vesicle-associated membrane protein 7; ZYX, zyxin. (b) Network analysis of proteins identified uniquely in the sEVs after restraint indicated proteins related to cellular stress responses. 26 s Proteasome, Proteasome; BAHCC1, BAH domain and coiled-coil containing 1; C1QTNF5, C1q and tumor necrosis factor related protein 5; CEP250, centrosomal protein 2; CHD8, chromodomain helicase DNA binding protein 8; CLIC1, chloride intracellular channel 1; ERK, p42/44 MAPK; HECTD1, HECT domain-containing E3 ubiquitin protein ligase 1; Histone h3, Histone H3B; HK1, hexokinase 1; Hsp90, Heat shock protein 90 kDa; HSPA2, heat shock 70 kDa protein 2; HSPA8, Heat Shock 70kD Protein 8; IDH1, isocitrate dehydrogenase 1; KHSRP, KH-type splicing regulatory protein; MAP1B, microtubule-associated protein 1B; MAPT, microtubule-associated protein tau; MTMR1, Myotubularin Related Protein 1; NCL, nucleolin; NOA1, nitric oxide associated 1; POLR1A, polymerase (RNA) I polypeptide A; Rnr, 47S Pre-rRNA, Ribosomal; RPS23, ribosomal protein S23; SPAG9, sperm associated antigen 9; SYPL2, synaptophysin-like 2; TNRC6A, trinucleotide repeat containing 6A; TUFM, Tu translation elongation factor. (c) Network analysis of the proteins identified uniquely in the sEVs after immobilization paradigm indicated protein components related to cancer and hematological and immunological diseases. 20 S proteasome, 20 S Core Complex; ABCC1, ATP-binding cassette, subfamily C (CFTR/MRP); CCT3:, chaperonin-containing TCP1, subunit 3 (gamma); CLIP2, CAP-GLY domain-containing linker protein 2; elastase, serine elastase; OC100360846/Psmb6, proteasome subunit β 6; MYH14, myosin, heavy chain 14; MYH7, beta cardiac myosin heavy chain; MYH8, myosin, heavy chain 8; NFkB (complex), transcription factor nuclear factor κ b; PGRMC1, progesterone receptor membrane component 1; PRKCB, protein kinase C β II; PSMA3, proteasome subunit α 3; PSMA5, proteasome subunit α 5; PSMA6, proteasome subunit α 6; PSMB1, proteasome subunit β 1; PSMB3, proteasome subunit β 3; PSMB4, proteasome subunit β 3; PSMB5, poteasome subunit β 5; PSMB7, proteasome subunit β 7; PSME1, Proteasome activator pa28 α subunit; SERPINA6, Corticosteroid-binding globulin, serine (or cysteine) peptidase inhibitor; SERPINB10, serine (or cysteine) peptidase inhibitor, clade B; SERPINB6, serine (or cysteine) peptidase inhibitor, clade B, member 6; TUBB2A, tubulin, β 2A; TUBB4B, tubulin, β 4B; TUBB6, tubulin, β 6.CC BY-NC · PubMed Central
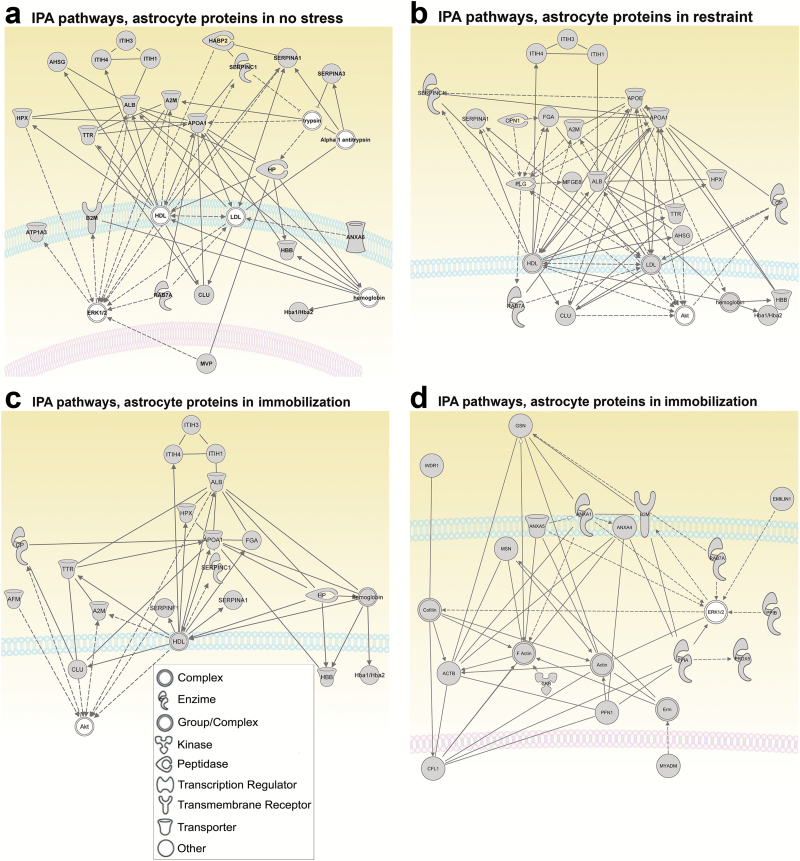
Figure 4. Network analysis of proteins in serum small extracellular vesicles (sEVs) and in astrocyte sEVs. Dotted lines indicate indirect interactions; solid lines represent direct interaction between proteins. (a) Network analysis of proteins obtained from serum sEVs of no stress group also present in astrocytes sEVs indicated protein components related to metabolic disease, endocrine system disorders, and gastrointestinal disease. A2 M, Alpha-2-microglobulin; AHSG, alpha-2-HS-GLYCOPROTEIN; ALB, Albumin 1; Alpha 1 antitrypsin, Alpha 1 antitrypsin; ANXA6, Annexin VI; APOA1, apolipoprotein A-I; ATP1A3, Na+/K+ ATPase alpha3; B2 M, beta-2-MICROGLOBULIN; CLU, clusterin; ERK1/2, p42/44 MAPK; HABP2, hyaluronic acid binding protein 2; Hba1/Hba2, hemoglobin, α 1, hemoglobin, α 2; HBB, Beta-globin; HDL, high-density lipoprotein; HP, haptoglobin; HPX, hemopexin; ITIH1, inter-alpha trypsin inhibitor, heavy chain 1; ITIH3, inter-alpha trypsin inhibitor, heavy chain 3; ITIH4, inter-alpha trypsin inhibitor, heavy chain 4; LDL, low-density lipoprotein; MVP, major vault protein; RAB7A, member RAS oncogene family, RAB7A; SERPINA1, serine (or cysteine) peptidase inhibitor, clade A; SERPINA3, serine (or cysteine) peptidase inhibitor, clade A, member 3 M; SERPINC1, serine (or cysteine) peptidase inhibitor, clade C, member 1; TTR, Transthyretin isomer 1. (b) Network analysis of the proteins obtained from serum sEVs after restraint also present in astrocytic sEVs indicating the protein components related to metabolic disease, neurological disease, and psychological disorders. A2 M, alpha-2-macroglobulin; AHSG, alpha-2-HS-GLYCOPROTEIN; Akt, AKT1/2/3; ALB, Albumin 1; APOA1, apolipoprotein A-I; APOE, Apolipoprotein E; CLU, clusterin; CP, ceruloplasmin; CPN1, carboxypeptidase N; FGA, Fibrinogen A α; Hba1/Hba2, hemoglobin, α 1, hemoglobin, α 2; HBB, Beta-globin; HDL, high-density lipoprotein; HPX, hemopexin; ITIH1, inter-alpha trypsin inhibitor, heavy chain 1; ITIH3, inter-alpha trypsin inhibitor, heavy chain 3; ITIH4, inter-alpha trypsin inhibitor, heavy chain 4; LDL, low-density lipoprotein; MFGE8, milk fat globule-EGF factor 8 protein; PLG, plasminogen; RAB7A, member RAS oncogene family, RAB7A; SERPINA1, serine (or cysteine) peptidase inhibitor, clade A; SERPINC1, serine (or cysteine) peptidase inhibitor, clade C, member 1; TTR, Transthyretin isomer 1. (c) Network analysis of the proteins obtained from the serum sEVs after immobilization paradigm also present in astrocytic sEVs. Network related to neurological and metabolic diseases. A2 M, alpha-2-macroglobulin; AFM, serum albumin, α-Alb; Akt, AKT1/2/3; ALB, albumin 1; APOA1, apolipoprotein A-I; CLU, clusterin; CP, ceruloplasmin; FGA, alpha-fibrinogen; Hba1/Hba2, hemoglobin, α 1, hemoglobin, α 2; HBB, Beta-globin; HDL, high-density lipoprotein; hemoglobin, hemoglobin; HP, haptoglobin; HPX, hemopexin; ITIH1, inter-alpha trypsin inhibitor, heavy chain 1; ITIH3, inter-alpha trypsin inhibitor, heavy chain 3; ITIH4, inter-alpha trypsin inhibitor, heavy chain 4; SERPINA1, serine (or cysteine) peptidase inhibitor, clade A, member 1; SERPINC1, serine (or cysteine) peptidase inhibitor, clade C; SERPINF1, serine (or cysteine) peptidase inhibitor, clade F, member 1; TTR, transthyretin isomer 1. (d) Network related to inflammatory response. ACTB, actin β; Actin, G-actin; ANXA1, annexin A1; ANXA4, annexin A4; ANXA5, annexin A5; B2 M, beta-2-MICROGLOBULIN; CFL1, cofilin 1; CKB, Creatine kinase b chain; Cofilin; EMILIN1, elastin microfibril interfacer 1; ERK1/2, p42/44 MAPK; Erm; F Actin, Filamentous actin; GSN, Gelsolin; MSN, moesin; MYADM, myeloid-associated differentiation marker; PFN1, profilin 1; PPIA, peptidylprolyl isomerase A; PPIB, peptidylprolyl isomerase B; PRDX5, Peroxiredoxin 5; RAB7A, member RAS oncogene family, RAB7A; WDR1, WD repeat domain 1.
Figure 4. Network analysis of proteins in serum small extracellular vesicles (sEVs) and in astrocyte sEVs. Dotted lines indicate indirect interactions; solid lines represent direct interaction between proteins. (a) Network analysis of proteins obtained from serum sEVs of no stress group also present in astrocytes sEVs indicated protein components related to metabolic disease, endocrine system disorders, and gastrointestinal disease. A2 M, Alpha-2-microglobulin; AHSG, alpha-2-HS-GLYCOPROTEIN; ALB, Albumin 1; Alpha 1 antitrypsin, Alpha 1 antitrypsin; ANXA6, Annexin VI; APOA1, apolipoprotein A-I; ATP1A3, Na+/K+ ATPase alpha3; B2 M, beta-2-MICROGLOBULIN; CLU, clusterin; ERK1/2, p42/44 MAPK; HABP2, hyaluronic acid binding protein 2; Hba1/Hba2, hemoglobin, α 1, hemoglobin, α 2; HBB, Beta-globin; HDL, high-density lipoprotein; HP, haptoglobin; HPX, hemopexin; ITIH1, inter-alpha trypsin inhibitor, heavy chain 1; ITIH3, inter-alpha trypsin inhibitor, heavy chain 3; ITIH4, inter-alpha trypsin inhibitor, heavy chain 4; LDL, low-density lipoprotein; MVP, major vault protein; RAB7A, member RAS oncogene family, RAB7A; SERPINA1, serine (or cysteine) peptidase inhibitor, clade A; SERPINA3, serine (or cysteine) peptidase inhibitor, clade A, member 3 M; SERPINC1, serine (or cysteine) peptidase inhibitor, clade C, member 1; TTR, Transthyretin isomer 1. (b) Network analysis of the proteins obtained from serum sEVs after restraint also present in astrocytic sEVs indicating the protein components related to metabolic disease, neurological disease, and psychological disorders. A2 M, alpha-2-macroglobulin; AHSG, alpha-2-HS-GLYCOPROTEIN; Akt, AKT1/2/3; ALB, Albumin 1; APOA1, apolipoprotein A-I; APOE, Apolipoprotein E; CLU, clusterin; CP, ceruloplasmin; CPN1, carboxypeptidase N; FGA, Fibrinogen A α; Hba1/Hba2, hemoglobin, α 1, hemoglobin, α 2; HBB, Beta-globin; HDL, high-density lipoprotein; HPX, hemopexin; ITIH1, inter-alpha trypsin inhibitor, heavy chain 1; ITIH3, inter-alpha trypsin inhibitor, heavy chain 3; ITIH4, inter-alpha trypsin inhibitor, heavy chain 4; LDL, low-density lipoprotein; MFGE8, milk fat globule-EGF factor 8 protein; PLG, plasminogen; RAB7A, member RAS oncogene family, RAB7A; SERPINA1, serine (or cysteine) peptidase inhibitor, clade A; SERPINC1, serine (or cysteine) peptidase inhibitor, clade C, member 1; TTR, Transthyretin isomer 1. (c) Network analysis of the proteins obtained from the serum sEVs after immobilization paradigm also present in astrocytic sEVs. Network related to neurological and metabolic diseases. A2 M, alpha-2-macroglobulin; AFM, serum albumin, α-Alb; Akt, AKT1/2/3; ALB, albumin 1; APOA1, apolipoprotein A-I; CLU, clusterin; CP, ceruloplasmin; FGA, alpha-fibrinogen; Hba1/Hba2, hemoglobin, α 1, hemoglobin, α 2; HBB, Beta-globin; HDL, high-density lipoprotein; hemoglobin, hemoglobin; HP, haptoglobin; HPX, hemopexin; ITIH1, inter-alpha trypsin inhibitor, heavy chain 1; ITIH3, inter-alpha trypsin inhibitor, heavy chain 3; ITIH4, inter-alpha trypsin inhibitor, heavy chain 4; SERPINA1, serine (or cysteine) peptidase inhibitor, clade A, member 1; SERPINC1, serine (or cysteine) peptidase inhibitor, clade C; SERPINF1, serine (or cysteine) peptidase inhibitor, clade F, member 1; TTR, transthyretin isomer 1. (d) Network related to inflammatory response. ACTB, actin β; Actin, G-actin; ANXA1, annexin A1; ANXA4, annexin A4; ANXA5, annexin A5; B2 M, beta-2-MICROGLOBULIN; CFL1, cofilin 1; CKB, Creatine kinase b chain; Cofilin; EMILIN1, elastin microfibril interfacer 1; ERK1/2, p42/44 MAPK; Erm; F Actin, Filamentous actin; GSN, Gelsolin; MSN, moesin; MYADM, myeloid-associated differentiation marker; PFN1, profilin 1; PPIA, peptidylprolyl isomerase A; PPIB, peptidylprolyl isomerase B; PRDX5, Peroxiredoxin 5; RAB7A, member RAS oncogene family, RAB7A; WDR1, WD repeat domain 1.CC BY-NC · PubMed Central
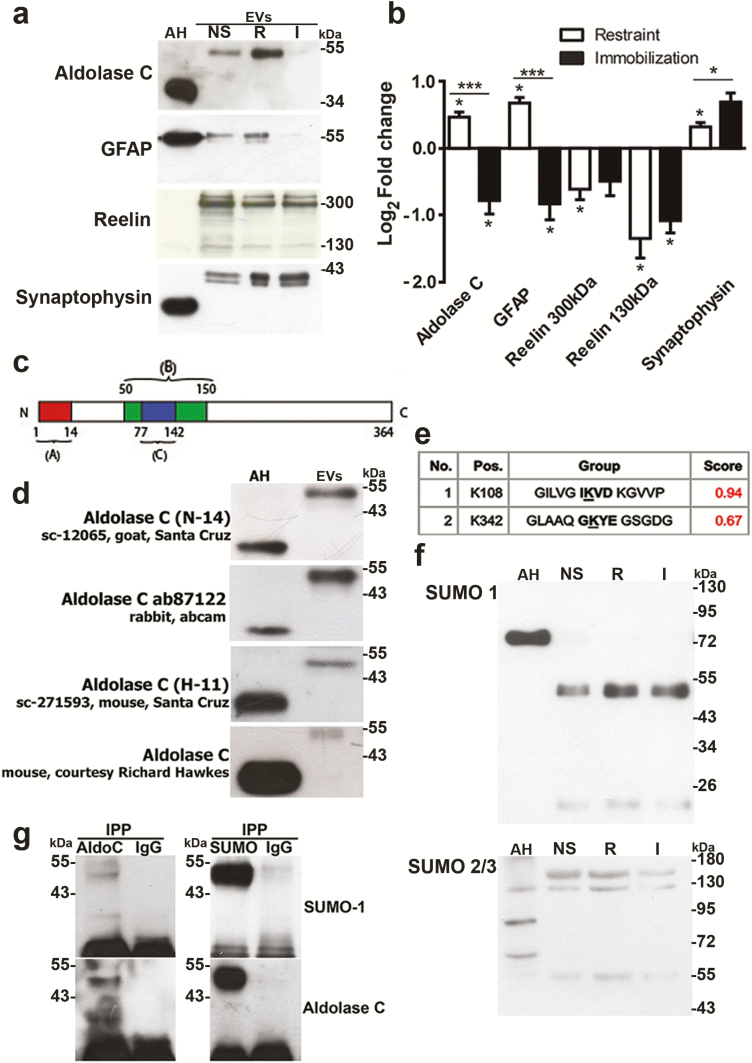
Figure 5. Proteins expressed in astrocytes (aldolase C and glial fibrillary acid protein [GFAP]) are differentially present in small extracellular vesicles (sEVs) obtained after restraint or immobilization. (a) Representative western blots of the indicated proteins and (b) corresponding densitometric quantification. (c) Representation of the antigenic peptides that were used for generation of the Santa Cruz antibodies (A and C), while B indicates the antigenic peptide that was used for the generation of the Abcam antibody. Finally, a monoclonal antibody generated against a crude homogenate of cerebellum and electrosensory lateral line lobe from a weakly electric fish was used (gift from Dr. Richard Hawkes, University of Calgary). (d) Western blots of aldolase C using antibodies of the different sources and directed against different antigenic peptides in the protein. (e) Possible small ubiquitin-like modifier (SUMO)ylating residues of aldolase C are indicated. (f) Western blots of sEVs using anti-SUMO antibodies. (g) Western blots of immunoprecipitated aldolase C (left) and SUMO (right) using SUMO antibody (upper) or aldolase C antibody (lower). The IgG lane indicates the respective control conditions. AH, astrocyte homogenates; I, stress by immobilization; NS, no stress; R, stress by restraint. N = 5–7; #P < .05; ##P < .0 in Mann-Whitney tests (to compare pairs of data, i.e., restraint vs immobilization); *P < .05 in a Wilcoxon-signed rank test (to compare fold changes with a hypothetical value of 1 (no change).
Figure 5. Proteins expressed in astrocytes (aldolase C and glial fibrillary acid protein [GFAP]) are differentially present in small extracellular vesicles (sEVs) obtained after restraint or immobilization. (a) Representative western blots of the indicated proteins and (b) corresponding densitometric quantification. (c) Representation of the antigenic peptides that were used for generation of the Santa Cruz antibodies (A and C), while B indicates the antigenic peptide that was used for the generation of the Abcam antibody. Finally, a monoclonal antibody generated against a crude homogenate of cerebellum and electrosensory lateral line lobe from a weakly electric fish was used (gift from Dr. Richard Hawkes, University of Calgary). (d) Western blots of aldolase C using antibodies of the different sources and directed against different antigenic peptides in the protein. (e) Possible small ubiquitin-like modifier (SUMO)ylating residues of aldolase C are indicated. (f) Western blots of sEVs using anti-SUMO antibodies. (g) Western blots of immunoprecipitated aldolase C (left) and SUMO (right) using SUMO antibody (upper) or aldolase C antibody (lower). The IgG lane indicates the respective control conditions. AH, astrocyte homogenates; I, stress by immobilization; NS, no stress; R, stress by restraint. N = 5–7; #P < .05; ##P < .0 in Mann-Whitney tests (to compare pairs of data, i.e., restraint vs immobilization); *P < .05 in a Wilcoxon-signed rank test (to compare fold changes with a hypothetical value of 1 (no change).CC BY-NC · PubMed Central
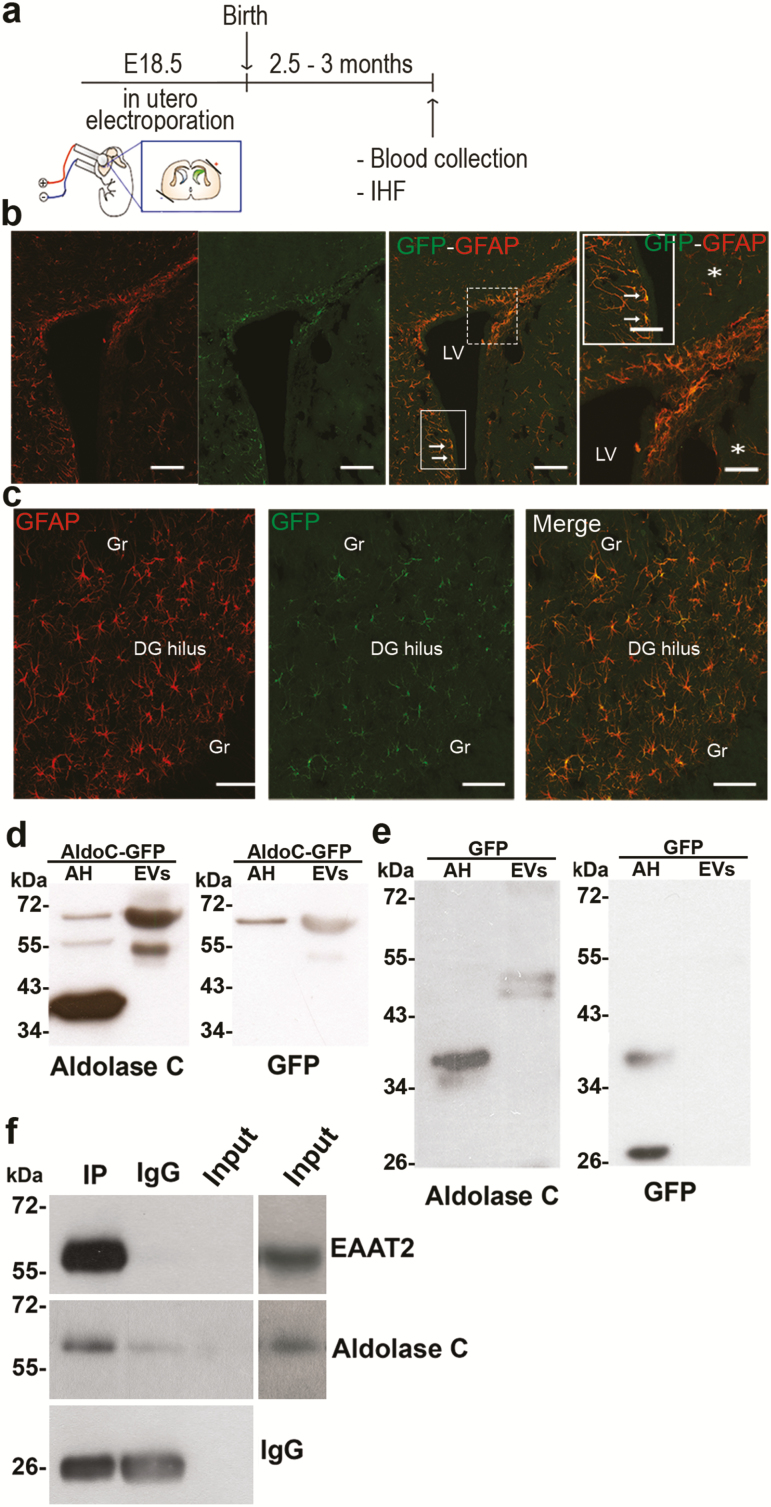
Figure 6. Aldolase C tagged with green fluorescent protein (C-GFP) expressed in forebrain astrocytes is detected in extracellular vesicles (EVs) isolated from the blood. (a) Scheme of the in utero electroporation. Forebrain astrocytes were transduced by in utero electroporation with aldolase C-GFP or GFP. Plasmids were injected into the left lateral ventricle on embryonic day 18.5. The orientation of the electrodes used to apply the voltage pulse is shown. (b) Immunohistofluorescent detection of glial fibrillary acid protein (GFAP) and GFP in coronal brain slices indicated that cells positive for both proteins were detected in the borders of the lateral ventricles (LV, indicated by arrows), and (c) in the hilus of the dentate gyrus (DG). Gr, granule cells. (d) Aldolase C (left) or GFP (right) was detected in astrocyte homogenates (AH) electroporated with aldolase C-GFP or in sEVs isolated from the serum of these animals. Note that in the sEVs, the modified form of aldolase C was detected (~ 55 kDa), as well as the recombinant protein (~ 70 kDa), which was also visible with the GFP antibody. (e) Aldolase C (left) or GFP (right) was detected in the astrocyte homogenates (AH) that were electroporated with GFP or in extracellular vesicles (sEVs) isolated from the serum of these animals. Note that in sEVs, the modified form of aldolase C was detected (~ 55 kDa), while in these animals, no GFP could be detected in the EVs. Observations were conducted in n = 5 independent animal groups (n = 4 rats per group for blood collection). (f) EVs bearing the glial glutamate transporter EAAT2 in their membrane are enriched in aldolase C. EVs were immunoisolated in nondenaturating conditions with an antibody directed against an extracellular epitope of EAAT2. The input lane was loaded with 8% of the EVs used for the precipitation procedure (i.e., 20 µg). Note that EAAT2 can only be detected in the input after overexposure of the same blot (right lanes), revealing a huge enrichment of EAAT2-bearing vesicles in the isolated material that in turn also contains higher aldolase C levels compared with the input EVs.
Figure 6. Aldolase C tagged with green fluorescent protein (C-GFP) expressed in forebrain astrocytes is detected in extracellular vesicles (EVs) isolated from the blood. (a) Scheme of the in utero electroporation. Forebrain astrocytes were transduced by in utero electroporation with aldolase C-GFP or GFP. Plasmids were injected into the left lateral ventricle on embryonic day 18.5. The orientation of the electrodes used to apply the voltage pulse is shown. (b) Immunohistofluorescent detection of glial fibrillary acid protein (GFAP) and GFP in coronal brain slices indicated that cells positive for both proteins were detected in the borders of the lateral ventricles (LV, indicated by arrows), and (c) in the hilus of the dentate gyrus (DG). Gr, granule cells. (d) Aldolase C (left) or GFP (right) was detected in astrocyte homogenates (AH) electroporated with aldolase C-GFP or in sEVs isolated from the serum of these animals. Note that in the sEVs, the modified form of aldolase C was detected (~ 55 kDa), as well as the recombinant protein (~ 70 kDa), which was also visible with the GFP antibody. (e) Aldolase C (left) or GFP (right) was detected in the astrocyte homogenates (AH) that were electroporated with GFP or in extracellular vesicles (sEVs) isolated from the serum of these animals. Note that in sEVs, the modified form of aldolase C was detected (~ 55 kDa), while in these animals, no GFP could be detected in the EVs. Observations were conducted in n = 5 independent animal groups (n = 4 rats per group for blood collection). (f) EVs bearing the glial glutamate transporter EAAT2 in their membrane are enriched in aldolase C. EVs were immunoisolated in nondenaturating conditions with an antibody directed against an extracellular epitope of EAAT2. The input lane was loaded with 8% of the EVs used for the precipitation procedure (i.e., 20 µg). Note that EAAT2 can only be detected in the input after overexposure of the same blot (right lanes), revealing a huge enrichment of EAAT2-bearing vesicles in the isolated material that in turn also contains higher aldolase C levels compared with the input EVs.CC BY-NC · PubMed Central

Verification

Claims the paper makes

The claims and statistics of this paper haven’t been checked yet.

Run the check — free, no account needed. It reads the open-access text and checks the sources it cites.

A few free checks a day · papers already verified open instantly · results are public

Claims other papers make about this one

Each is checked against this paper’s own text: does it say what the citing paper says it does?

Self-check

Percentages, sums and reported differences re-computed from the paper’s own numbers.

The self-check needs the paper’s full text.

Citations

Cites

Show all 9 references

Research works printed but not linked: 50

  1. Akil, 2018, Treatment resistant depression: a multi-scale, systems biology approach, Neurosci Biobehav Rev, 84, 272, 10.1016/j.neubiorev.2017.08.019 · DOI
  2. Ampuero, 2015, Two chronic stress models based on movement restriction in rats respond selectively to antidepressant drugs: aldolase C as a potential biomarker, Int J Neuropsychopharmacol, 18, pyv038, 10.1093/ijnp/pyv038 · DOI
  3. Aydın, 2018, Thioredoxin is not a marker for treatment-resistance depression but associated with cognitive function: an rTMS study, Prog Neuropsychopharmacol Biol Psychiatry, 80, 322, 10.1016/j.pnpbp.2017.04.025 · DOI
  4. Bruni, 1998, Ependymal development, proliferation, and functions: a review, Microsc Res Tech, 41, 2, 10.1002/(SICI)1097-0029(19980401)41:1<2::AID-JEMT2>3.0.CO;2-Z · DOI
  5. Cai, 2017, Proteome-wide mapping of endogenous SUMOylation sites in mouse testis, Mol Cell Proteomics, 16, 717, 10.1074/mcp.M116.062125 · DOI
  6. Cai, 2017, Exosomal mir-7 mediates bystander autophagy in lung after focal brain irradiation in mice, Int J Biol Sci, 13, 1287, 10.7150/ijbs.18890 · DOI
  7. Carboni, 2015, The contribution of proteomic studies in humans, animal models, and after antidepressant treatments to investigate the molecular neurobiology of major depression, Proteomics Clin Appl, 9, 889, 10.1002/prca.201400139 · DOI
  8. Cattaneo, 2016, Absolute measurements of macrophage migration inhibitory factor and interleukin-1-beta mRNA levels accurately predict treatment response in depressed patients, Int J Neuropsychopharmacol, 19, 10.1093/ijnp/pyw045 · DOI
  9. Caviedes, 2017, BDNF/NF-κb signaling in the neurobiology of depression, Curr Pharm Des, 23, 3154, 10.2174/1381612823666170111141915 · DOI
  10. Colombo, 2014, Biogenesis, secretion, and intercellular interactions of exosomes and other extracellular vesicles, Annu Rev Cell Dev Biol, 30, 255, 10.1146/annurev-cellbio-101512-122326 · DOI · Paper page
  11. Comte, 2012, Regional differences in human ependymal and subventricular zone cytoarchitecture are unchanged in neuropsychiatric disease, Dev Neurosci, 34, 299, 10.1159/000338600 · DOI
  12. Corena-McLeod, 2013, New model of action for mood stabilizers: phosphoproteome from rat pre-frontal cortex synaptoneurosomal preparations, PLoS One, 8, e52147, 10.1371/journal.pone.0052147 · DOI
  13. Couch, 2017, Circulating endothelial cell-derived extracellular vesicles mediate the acute phase response and sickness behaviour associated with CNS inflammation, Sci Rep, 7, 9574, 10.1038/s41598-017-09710-3 · DOI
  14. Chen, 2012, A method for stable transgenesis of radial glia lineage in rat neocortex by piggybac mediated transposition, J Neurosci Methods, 207, 172, 10.1016/j.jneumeth.2012.03.016 · DOI
  15. Darcet, 2016, Cognitive dysfunction in major depressive disorder. A translational review in animal models of the disease, Pharmaceuticals (Basel), 9, 10.3390/ph9010009 · DOI
  16. Detka, 2015, Brain glucose metabolism in an animal model of depression, Neuroscience, 295, 198, 10.1016/j.neuroscience.2015.03.046 · DOI
  17. Girach, 2013, RIM1α sumoylation is required for fast synaptic vesicle exocytosis, Cell Rep, 5, 1294, 10.1016/j.celrep.2013.10.039 · DOI
  18. Głombik, 2015, Maternal stress predicts altered biogenesis and the profile of mitochondrial proteins in the frontal cortex and hippocampus of adult offspring rats, Psychoneuroendocrinology, 60, 151, 10.1016/j.psyneuen.2015.06.015 · DOI
  19. Głombik, 2017, Evaluation of the effectiveness of chronic antidepressant drug treatments in the hippocampal mitochondria - A proteomic study in an animal model of depression, Prog Neuropsychopharmacol Biol Psychiatry, 78, 51, 10.1016/j.pnpbp.2017.05.014 · DOI
  20. Goetzl, 2018, High complement levels in astrocyte-derived exosomes of alzheimer disease, Ann Neurol, 83, 544, 10.1002/ana.25172 · DOI
  21. Hazelton, 2018, Exacerbation of acute traumatic brain injury by circulating extracellular vesicles, J Neurotrauma, 35, 639, 10.1089/neu.2017.5049 · DOI
  22. Kahne, 2016, Proteome rearrangements after auditory learning: high-resolution profiling of synapse-enriched protein fractions from mouse brain, J Neurochem, 138, 124, 10.1111/jnc.13636 · DOI
  23. Kolodziej, 2016, High resolution quantitative synaptic proteome profiling of mouse brain regions after auditory discrimination learning, J Vis Exp, 10.3791/54992 · DOI
  24. Koo, 2010, Nuclear factor-kappab is a critical mediator of stress-impaired neurogenesis and depressive behavior, Proc Natl Acad Sci U S A, 107, 2669, 10.1073/pnas.0910658107 · DOI · Paper page
  25. Krishnan, 2010, Linking molecules to mood: new insight into the biology of depression, Am J Psychiatry, 167, 1305, 10.1176/appi.ajp.2009.10030434 · DOI
  26. Kunadt, 2015, Extracellular vesicle sorting of α-synuclein is regulated by sumoylation, Acta Neuropathol, 129, 695, 10.1007/s00401-015-1408-1 · DOI
  27. Lener, 2015, In pursuit of neuroimaging biomarkers to guide treatment selection in major depressive disorder: a review of the literature, Ann N Y Acad Sci, 1344, 50, 10.1111/nyas.12759 · DOI
  28. Licinio, 2009, Novel sequence variations in the brain-derived neurotrophic factor gene and association with major depression and antidepressant treatment response, Arch Gen Psychiatry, 66, 488, 10.1001/archgenpsychiatry.2009.38 · DOI
  29. Lin, 2014, Influence of 5-HTR2A genetic polymorphisms on the efficacy of antidepressants in the treatment of major depressive disorder: a meta-analysis, J Affect Disord, 168, 430, 10.1016/j.jad.2014.06.012 · DOI
  30. LoTurco, 2009, New and improved tools for in utero electroporation studies of developing cerebral cortex, Cereb Cortex, 19, i120, 10.1093/cercor/bhp033 · DOI
  31. Lv, 2016, The establishment of the objective diagnostic markers and personalized medical intervention in patients with major depressive disorder: rationale and protocol, BMC Psychiatry, 16, 240, 10.1186/s12888-016-0953-z · DOI
  32. Maffioletti, 2016, Peripheral whole blood microRNA alterations in major depression and bipolar disorder, J Affect Disord, 200, 250, 10.1016/j.jad.2016.04.021 · DOI · Paper page
  33. Matsuzaki, 2015, SUMO1 affects synaptic function, spine density and memory, Sci Rep, 5, 10730, 10.1038/srep10730 · DOI
  34. Mustapic, 2017, Plasma extracellular vesicles enriched for neuronal origin: A potential window into brain pathologic processes, Front Neurosci, 11, 278, 10.3389/fnins.2017.00278 · DOI · Paper page
  35. Park, 2009, C1Q tumor necrosis factor alpha-related protein isoform 5 is increased in mitochondrial DNA-depleted myocytes and activates AMP-activated protein kinase, J Biol Chem, 284, 27780, 10.1074/jbc.M109.005611 · DOI
  36. Paul, 2016, Appearance of claudin-5+ leukocytes in the central nervous system during neuroinflammation: a novel role for endothelial-derived extracellular vesicles, J Neuroinflammation, 13, 292, 10.1186/s12974-016-0755-8 · DOI
  37. Pegtel, 2014, Extracellular vesicles as modulators of cell-to-cell communication in the healthy and diseased brain, Philos Trans R Soc Lond B Biol Sci, 369, 10.1098/rstb.2013.0516 · DOI · Paper page
  38. Regenold, 2012, Mitochondrial detachment of hexokinase 1 in mood and psychotic disorders: implications for brain energy metabolism and neurotrophic signaling, J Psychiatr Res, 46, 95, 10.1016/j.jpsychires.2011.09.018 · DOI
  39. Sandoval, 2013, The glycolytic enzyme aldolase C is up-regulated in rat forebrain microsomes and in the cerebrospinal fluid after repetitive fluoxetine treatment, Brain Res, 1520, 1, 10.1016/j.brainres.2013.04.049 · DOI
  40. Shao, 2012, Protein typing of circulating microvesicles allows real-time monitoring of glioblastoma therapy, Nat Med, 18, 1835, 10.1038/nm.2994 · DOI
  41. Sillitoe, 2005, Conservation of the architecture of the anterior lobe vermis of the cerebellum across mammalian species, Prog Brain Res, 148, 283, 10.1016/S0079-6123(04)48022-4 · DOI
  42. Sokolova, 2011, Characterisation of exosomes derived from human cells by nanoparticle tracking analysis and scanning electron microscopy, Colloids Surf B Biointerfaces, 87, 146, 10.1016/j.colsurfb.2011.05.013 · DOI
  43. Théry, 2006, Isolation and characterization of exosomes from cell culture supernatants and biological fluids, Curr Protoc Cell Biol, Chapter 3, Unit 3.22
  44. Ventimiglia, 2016, Biogenesis and function of T cell-derived exosomes, Front Cell Dev Biol, 4, 84, 10.3389/fcell.2016.00084 · DOI
  45. Villarroya-Beltri, 2014, Sorting it out: regulation of exosome loading, Semin Cancer Biol, 28, 3, 10.1016/j.semcancer.2014.04.009 · DOI
  46. Vizcaíno, 2016, 2016 update of the PRIDE database and its related tools, Nucleic Acids Res, 44, D447, 10.1093/nar/gkv1145 · DOI
  47. Weckmann, 2017, Ketamine’s antidepressant effect is mediated by energy metabolism and antioxidant defense system, Sci Rep, 7, 15788, 10.1038/s41598-017-16183-x · DOI
  48. Whittle, 2011, Changes in brain protein expression are linked to magnesium restriction-induced depression-like behavior, Amino Acids, 40, 1231, 10.1007/s00726-010-0758-1 · DOI
  49. Willis, 2017, A refined bead-free method to identify astrocytic exosomes in primary glial cultures and blood plasma, Front Neurosci, 11, 335, 10.3389/fnins.2017.00335 · DOI
  50. Xue, 2006, SUMOsp: a web server for sumoylation site prediction, Nucleic Acids Res, 34, W254, 10.1093/nar/gkl207 · DOI

Cited by

Sorted by citations

Metadata

Authors
Gómez-Molina, C., Sandoval, M., Henzi, R., Ramírez, J. P., Varas-Godoy, M., Luarte, A., Lafourcade, C. A., Lopez-Verrilli, A., Smalla, K.-H., Kaehne, T., & Wyneken, U.
Affiliations
  • Centro de Investigación Biomédica, Universidad de los Andes, Chile
  • Leibniz Institute for Neurobiology, Magdeburg, Germany
  • Otto-von-Guericke University, Magdeburg, Germany
Venue
International Journal of Neuropsychopharmacology
Published
2018-12-08
Volume
22
Issue
3
Pages
232-246
ISSN
  • 1461-1457
  • 1469-5111
Cited by
76
References
9
Language
en
Funders
Chilean government

About these checks

Registry, retraction, Cites and statistics results are computed, not judged, with one exception: a printed reference that no index lists is read once by a model before it counts as a citation error. Claims are extracted by a model and kept only when their quote appears verbatim in the text; each cited source is then checked, with a model’s help, for whether it says what the claim relies on. Those verdicts can be wrong — read the claim’s quote and the cited source before relying on one.

Statistics and arithmetic are recomputed, not judged.

Confidence bands are shown only for fields calibrated on our annotated test set. None is calibrated yet, so no band is shown.

What counts as a claim ›How we measure confidence ›How we check this ›

Are you an author, or do you see a problem with this page? Request a review