

The DOI matches its Crossref record; 94 of the 94 references it cites were found in a registry or an index; 38 of the 48 sources its claims cite were checked for support.
Detecting galaxy tidal features using self-supervised representation learning
Open accessAbstract
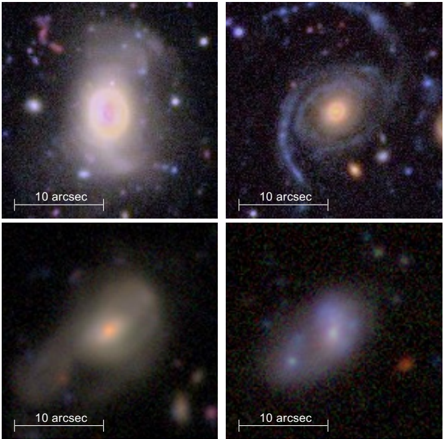
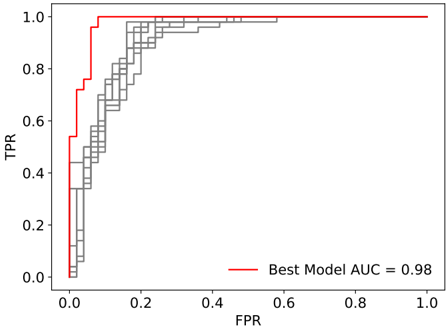
Low surface brightness substructures around galaxies, known as tidal features, are a valuable tool in the detection of past or ongoing galaxy mergers, and their properties can answer questions about the progenitor galaxies involved in the interactions. The assembly of current tidal feature samples is primarily achieved using visual classification, making it difficult to construct large samples and draw accurate and statistically robust conclusions about the galaxy evolution process. With upcoming large optical imaging surveys such as the Vera C. Rubin Observatory’s Legacy Survey of Space and Time, predicted to observe billions of galaxies, it is imperative that we refine our methods of detecting and classifying samples of merging galaxies. This paper presents promising results from a self-supervised machine learning model, trained on data from the Ultradeep layer of the Hyper Suprime-Cam Subaru Strategic Program optical imaging survey, designed to automate the detection of tidal features. We find that self-supervised models are capable of detecting tidal features, and that our model outperforms previous automated tidal feature detection methods, including a fully supervised model. An earlier method applied to real galaxy images achieved 76 per cent completeness for 22 per cent contamination, while our model achieves considerably higher (96 per cent) completeness for the same level of contamination. We emphasize a number of advantages of self-supervised models over fully supervised models including maintaining excellent performance when using only 50 labelled examples for training, and the ability to perform similarity searches using a single example of a galaxy with tidal features.
Overview
CoChat Summary
TL;DR
The paper presents a self-supervised NNCLR model with a linear classifier to detect galaxy tidal features in HSC-SSP Ultradeep imaging, and compares it to supervised models on SDSS and HSC data. It reports high completeness and ROC AUC, with strong performance even when only 50 labelled examples are used.
Key findings
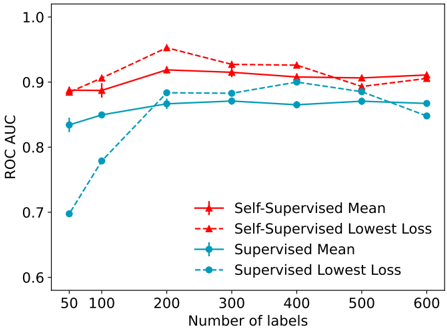
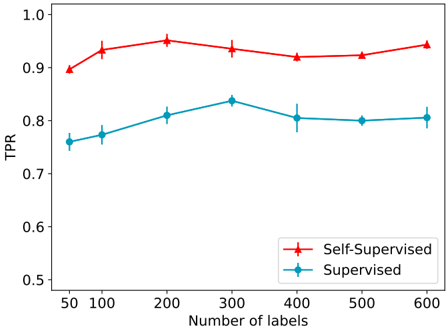
- On HSC-SSP, the SSL model reaches ROC AUC = 0.911 ± 0.002 and TPR = 0.94 ± 0.1 at FPR = 0.20; with only 50 labels, it maintains ROC AUC = 0.89 ± 0.01 and TPR = 0.90 ± 0.1 at FPR = 0.2.
- The model reaches 96% completeness for 22% contamination, compared with 76% completeness for 22% contamination from an earlier automated method.
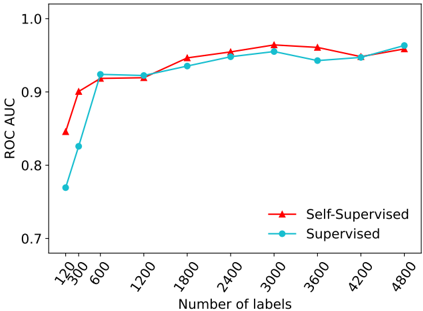
- On SDSS merger classification, with 120 unique labels the SSL model reaches AUC = 0.85 while the supervised model drops to 0.77; with larger label sets both reach similar ROC AUC ≈ 0.96. On HSC, the SSL model consistently outperforms the supervised model (maximum ROC AUC 0.911 ± 0.002 vs 0.867 ± 0.004; at 50 labels 0.89 ± 0.01 vs 0.83 ± 0.01).
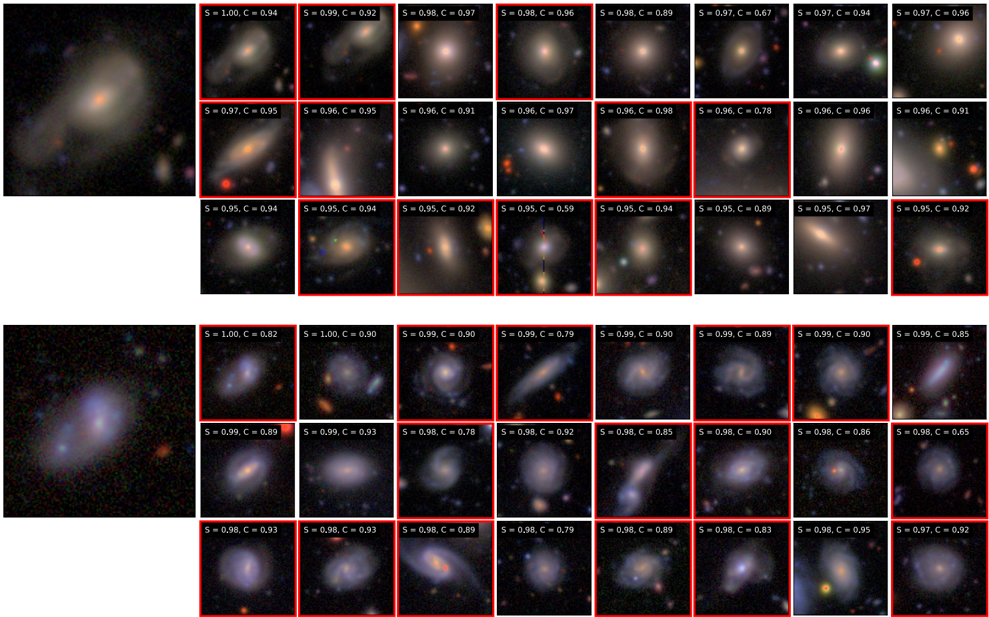
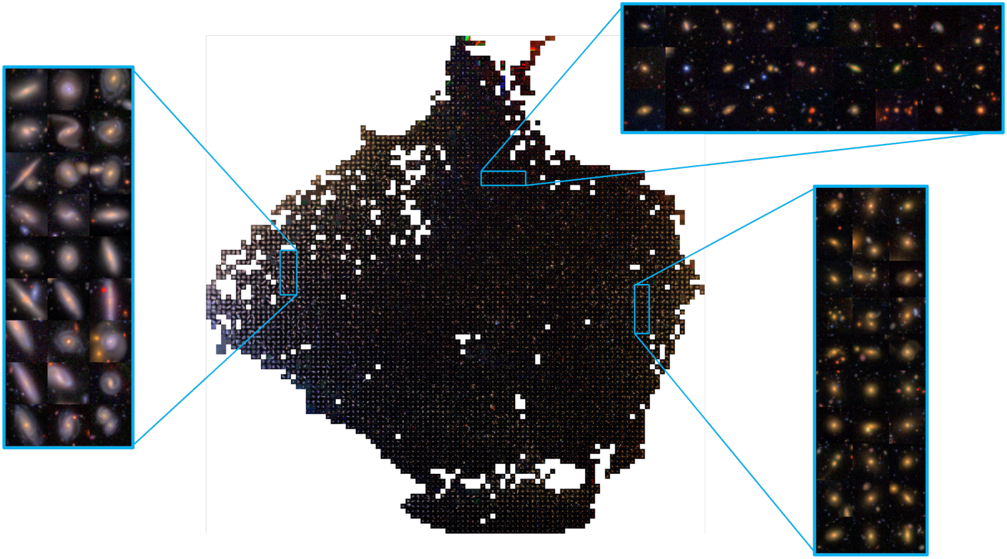
- Training is inexpensive: the encoder required ∼30 minutes for 25 epochs on a single GPU, and the linear classifier ∼1 minute for 50 epochs; a similarity search using one labelled tidal-feature example retrieves other candidates from ∼44,000 unlabelled galaxies.
Methods
- Two datasets: HSC-SSP PDR2 Ultradeep, with ∼44,000 unlabelled galaxies after filtering and a labelled sample of 760 galaxies (380 tidal, 380 non-tidal) split 600/60/100 for training/validation/testing; and SDSS DR7/Pearson et al. (2019), with 6000 galaxies (3000 merging, 3000 non-merging) split 4800/600/600, plus an unlabelled SDSS set expanded to 50,000 via rotations.
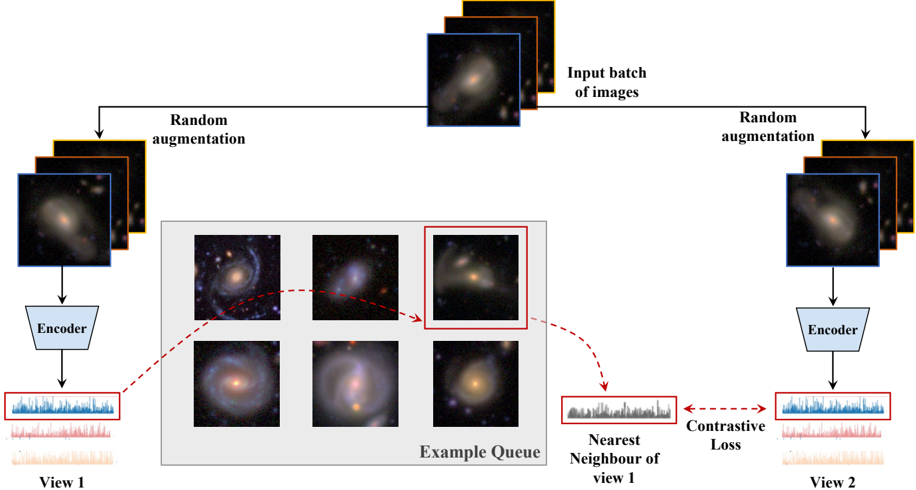
- Model: NNCLR self-supervised encoder using ResNet-20, 128-dimensional representations, queue size 10,000, temperature 0.1, trained for 25 epochs on unlabelled data; a linear classifier with sigmoid activation, Adam optimiser, and binary cross entropy trained for 50 epochs on labelled data. Augmentations include random flips, Gaussian noise, and jitter/crop.
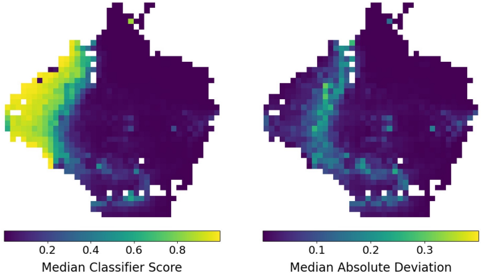
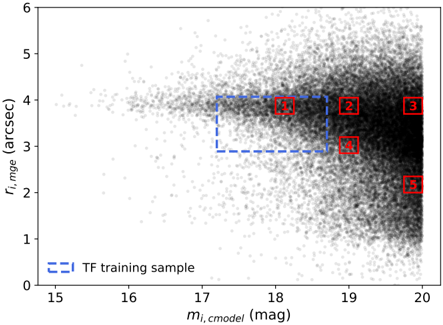
- Evaluation: ROC AUC and TPR at FPR = 0.2, averaged over ten runs with outliers beyond 3σ removed; UMAP visualisation of encoded representations, similarity searches, and performance across five magnitude-radius regions with 200 galaxies each.
Limitations
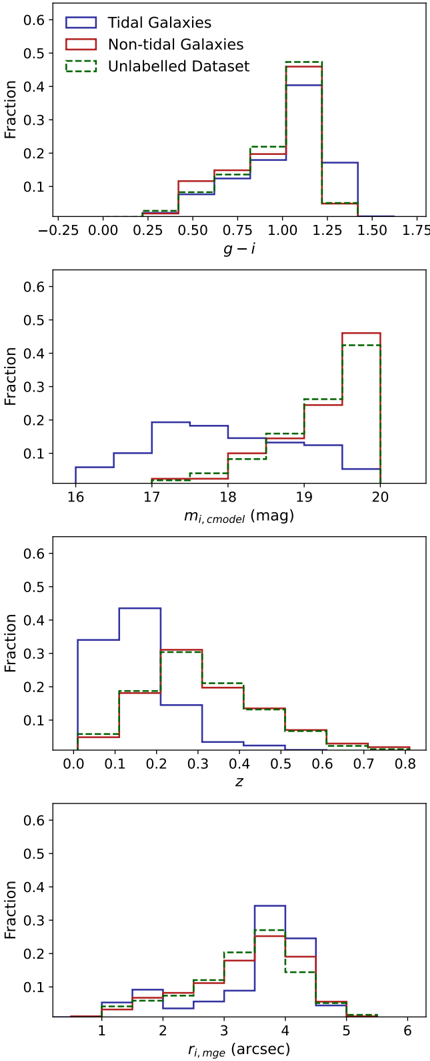
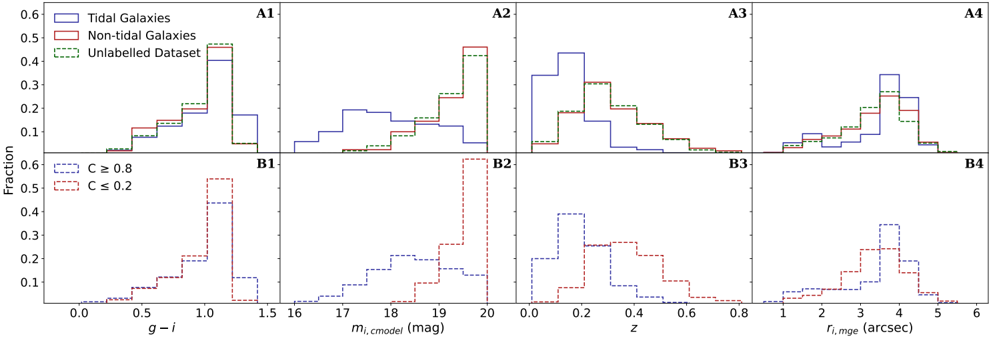
- The paper states that the labelled tidal-feature sample is brighter, lower-redshift, and slightly larger in apparent radius than the unlabelled and non-tidal samples, so the model is biased toward assigning high classifier scores to brighter galaxies; contamination is expected mainly from bright, larger, low-redshift non-tidal galaxies.
- The paper states that validation and testing sets are very small (60 and 100 galaxies), making evaluation difficult; the SDSS dataset is selected for obvious interacting mergers rather than tidal features, and SDSS surface-brightness limits mean only the brightest tidal features would be visible.
- The paper states that comparison with other works is limited by the scarcity of similar studies, and that the model is intended for use with visual classification rather than as a fully automated classifier; no optimal threshold is specified because the TPR/FPR trade-off is application-dependent.
Model-written summary. Check it against the paper before relying on it.
Integrity signals
Registry
Cites
Statistics
Figures
Verification
Claims the paper makes
30 Valid · 9 Not valid · 3 Not checked · 76 Own results and interpretations
The cited sources support only part of this claim — read each source’s verdict below.
In the paper
“Another benefit to self-supervised models, other than training on unlabelled data, is the computational cost, self-supervised models have been shown to need only 1% of the computational power needed by supervised models (Hayat et al. 2021).”
- Also stated in: § 1 INTRODUCTION · boosted
“self-supervised models have been shown to need only 1% of the computational power needed by supervised models (Hayat et al. 2021).”
What the sources say
- Partly supportedcites Hayat et al. 2021 sourceExperimental — accuracy not yet measured
Section 3.2 reports that a linear classifier trained on self-supervised representations takes about 0.5–10 seconds on a GPU, versus up to two hours on eight GPUs for supervised training. But Appendix C.2 says those times exclude the compute needed to learn the self-supervised representations. The paper therefore supports lower compute for this downstream classifier, not the claim that self-supervised models generally need only 1% as much computational power. (LLM, conf=0.88)
boostedstates a cause- Asserted: passes — The authors put it forward as true.
- Checkable: passes — It can be checked against evidence.
- Load-bearing: unclear — It is unclear whether the paper’s conclusions depend on it.
- Based: passes — The paper gives a reason why it holds.
- Also stated in: § 1 INTRODUCTION · boosted
Every source the paper cites for this claim was checked and supports it.
In the paper
“Hence, using tidal features to study galaxy evolution can provide important observational confirmation on the contribution of low-mass galaxies to the merging process (e.g. Johnston et al. 2008).”
What the sources say
- Supportedcites Johnston et al. 2008 source
The Introduction (page not supplied) describes stellar-halo substructure as a consequence of large galaxies accreting dwarf galaxies. The Conclusions and Future Prospects sections say that studying such features can reveal progenitor masses and constrain observed merger histories, supporting the claim's proposed observational use. (LLM, conf=0.90)
plainstates a cause- Asserted: passes — The authors put it forward as true.
- Checkable: passes — It can be checked against evidence.
- Load-bearing: passes — The paper’s conclusions depend on it.
- Based: passes — The paper gives a reason why it holds.
- Supported
The cited sources support only part of this claim — read each source’s verdict below.
In the paper
“which is predicted to reach 𝜇 𝑟 ∼ 30.3 mag arcsec -2 (Martin et al. 2022)”
What the sources say
- Partly supportedcites Martin et al. 2022 sourceExperimental — accuracy not yet measured
Section 2.3.3 (page unavailable) reports predictions for LSST’s final limiting surface brightness ranging from approximately 29.5 to 31 mag arcsec⁻². That supports a limit around 30.3 mag arcsec⁻², but the paper does not identify 30.3 as a specific prediction; it also says the achieved depth depends on data reduction. (LLM, conf=0.86)
plain- Asserted: passes — The authors put it forward as true.
- Checkable: passes — It can be checked against evidence.
- Load-bearing: passes — The paper’s conclusions depend on it.
- Based: passes — The paper gives a reason why it holds.
- Partly supported
The cited sources support only part of this claim — read each source’s verdict below.
In the paper
“but billions of galaxies are virtually impossible to classify visually by humans, even using large community based projects such as Galaxy Zoo (Lintott et al. 2008; Darg et al. 2010a)”
What the sources say
- Partly supportedcites Lintott et al. 2008 sourceExperimental — accuracy not yet measured
The Introduction says modern survey catalogues are too large for astronomers to inspect in full. The Conclusion reports that Galaxy Zoo volunteers successfully classified hundreds of thousands of galaxies, but the paper does not establish that classifying billions would be virtually impossible even with a community project. Page numbers were not provided in our copy. (LLM, conf=0.85)
- Not matchedcites Darg et al. 2010a
Couldn’t be matched to a paper in Crossref, so it can’t be checked.
plain- Asserted: passes — The authors put it forward as true.
- Checkable: passes — It can be checked against evidence.
- Load-bearing: passes — The paper’s conclusions depend on it.
- Based: passes — The paper gives a reason why it holds.
- Partly supported
The cited sources support only part of this claim — read each source’s verdict below.
In the paper
“SDSS imaging is incomplete at surface brightnesses fainter than 𝜇 𝑟 ≤ 23 mag arcsec -2 (Strauss et al. 2002)”
What the sources say
- Partly supportedcites Strauss et al. 2002 sourceExperimental — accuracy not yet measured
Section 4.4 (page unavailable) says imaging detection limits create an implicit surface-brightness cut for redshift surveys. But its 23 mag arcsec⁻² value marks where the main sample stops targeting all eligible galaxies without an additional criterion; it does not establish that SDSS imaging becomes incomplete there. The paper describes imaging candidates and selected spectroscopic targets at fainter surface brightnesses. (LLM, conf=0.83)
plain- Asserted: passes — The authors put it forward as true.
- Checkable: passes — It can be checked against evidence.
- Load-bearing: passes — The paper’s conclusions depend on it.
- Based: passes — The paper gives a reason why it holds.
- Partly supported
45 more claims · 8 with their cited sources checked
Create a free account to see all 118 claims and every source verdict.
- It may state two separate claims as one. 56
- Probably not a substantial claim. 27
- Borderline: one of the tests for a substantial claim is unclear. 1
Self-check
Percentages, sums and reported differences re-computed from the paper’s own numbers.
Each contradiction between two passages listed here was confirmed by an independent check.
Rated minor: it would not touch a result — a value no result rests on, a p-value that stays on the same side of the significance level, or a conflict that is clerical, resolved elsewhere in the paper, or outside its own findings.
In the paper
§ 4 DISCUSSION AND CONCLUSIONS
“high completeness (TPR = 0. 94 ± 0.1) for low contamination (FPR = 0.20) and high area under the ROC curve (ROC AUC = 0.91 ± 0.002).”
§ 3.1 Self-Supervised vs. Supervised Performance
“only dropping from TPR = 0.94 ± 0.01 at 600 training labels to TPR = 0.90 ± 0.01 with a mere 50 training labels.”
Rated minor: it would not touch a result — a value no result rests on, a p-value that stays on the same side of the significance level, or a conflict that is clerical, resolved elsewhere in the paper, or outside its own findings.
In the paper
§ 3.2.1 Similarity
“In Figure 8 the query image is shown on the right alongside the 24 galaxies which received the highest similarity scores.”
§ 3.2.3 Dependence of Model Performance on Galaxy Properties
“The two query galaxies are displayed on the left, alongside the top 24 galaxies with the highest similarity scores for each similarity search.”
Rated minor: it would not touch a result — a value no result rests on, a p-value that stays on the same side of the significance level, or a conflict that is clerical, resolved elsewhere in the paper, or outside its own findings.
In the paper
§ 2.2 Image Pre-processing and Augmentations
“For HSC-SSP images we crop the 128 × 128 pixel image to the central 109 × 109 pixels before randomly cropping the image to 96 × 96pixels.”
§ 2.2 Image Pre-processing and Augmentations
“Random cropping means the image centre is translated, or 'jittered', along each respective axis by 𝑖 , 𝑗 pixels where 𝑖 , 𝑗 ∼ U (-13,13) before cropping to the central 96 × 96 pixels.”
Citations
Cites
Deep Residual Learning for Image Recognition
He, K., Zhang, X., Ren, S., & Sun, J. (2016) · 2016 IEEE Conference on Computer Vision and Pattern Recognition (CVPR) · doi:10.1109/cvpr.2016.90 · Cited by 235,474
Adam: A Method for Stochastic Optimization
Kingma, D. P., & Ba, J. (2014) · arXiv · doi:10.48550/arxiv.1412.6980 · Cited by 98,946
Momentum Contrast for Unsupervised Visual Representation LearningPreprint
He, K., Fan, H., Wu, Y., Xie, S., & Girshick, R. B. (2019) · Computer Vision and Pattern Recognition · doi:10.48550/arxiv.1911.05722 · Cited by 16,321
Proceedings of IEEE Conference on Computer Vision and Pattern Recognition
(1993) · Proceedings of IEEE Conference on Computer Vision and Pattern Recognition · doi:10.1109/cvpr.1993.341010 · Cited by 14,265
Momentum Contrast for Unsupervised Visual Representation Learning
He, K., Fan, H., Wu, Y., Xie, S., & Girshick, R. (2020) · 2020 IEEE/CVF Conference on Computer Vision and Pattern Recognition (CVPR) · doi:10.1109/cvpr42600.2020.00975 · Cited by 13,347
A simple framework for contrastive learning of visual representations
Chen, T., Kornblith, S., Norouzi, M., & Hinton, G. (2020) · arXiv · doi:10.48550/arxiv.2002.05709 · Cited by 10,857
The Sloan Digital Sky Survey: Technical Summary
York, D. G., Adelman, J., Anderson, Jr., Anderson, S. F., Annis, J., Bahcall, N. A., Bakken, J. A., Barkhouser, R., Bastian, S., Berman, E., et al. (2000) · The Astronomical Journal · doi:10.1086/301513 · Cited by 10,366
TensorFlow: Large-Scale Machine Learning on Heterogeneous Distributed Systems
Abadi, M., Agarwal, A., Barham, P., Brevdo, E., Chen, Z., Citro, C., Corrado, G. S., Davis, A., Dean, J., Devin, M., et al. (2016) · arXiv · doi:10.48550/arxiv.1603.04467 · Cited by 9,408
UMAP: Uniform Manifold Approximation and Projection for Dimension Reduction
McInnes, L., Healy, J., & Melville, J. (2018) · arXiv · doi:10.48550/arxiv.1802.03426 · Cited by 7,101
Representation Learning with Contrastive Predictive Coding
Oord, A. V. D., Li, Y., & Vinyals, O. (2018) · arXiv · doi:10.48550/arxiv.1807.03748 · Cited by 6,242
Research works printed but not linked: 2
- Ćiprijanović, 2023, MLST, 4, 025013
- Huang, 2019, Unagi
Cited by
Galaxy Morphology Classification via Deep Semisupervised Learning with Limited Labeled Data
Luo, Z., Chen, J., Chen, Z., Zhang, S., Fu, L., Xiao, H., & Shu, C. (2025) · The Astrophysical Journal Supplement Series · doi:10.3847/1538-4365/addb4c · Cited by 15
“This approach is particularly advantageous in scenarios where annotation costs are high or where labeled data is limited, such as in the search for strong gravitational lenses (Stein et al. 2022), the detection of galaxy tidal features (Desmons et al. 2024), and other similar applications.”
Uncovering tidal treasures: automated classification of faint tidal features in DECaLS data
Gordon, A. J., Ferguson, A. M. N., & Mann, R. G. (2024) · Monthly Notices of the Royal Astronomical Society · doi:10.1093/mnras/stae2169 · Cited by 15
STRRINGS: STReams in Residual Images of Nearby GalaxieS
Sola, E., Chemaly, D., Belokurov, V. A., Müller, O., Arentsen, A., Davies, E. Y., Laguna-Miralles, J., Myeong, G., Panagiotakis, K., Zhang, H., et al. (2025) · Monthly Notices of the Royal Astronomical Society · doi:10.1093/mnras/staf1647 · Cited by 17
Detecting Galactic Rings in the DESI Legacy Imaging Surveys with Semisupervised Deep Learning
Chen, J., Luo, Z., Cheng, C., Hou, J., Zhang, S., & Shu, C. (2025) · The Astrophysical Journal Supplement Series · doi:10.3847/1538-4365/adec98 · Cited by 4
“…such as galaxy morphology classification (S. Wei et al. 2022; A. ´Ciprijanovi´c et al. 2023; J. Vega-Ferrero et al. 2024; Z. Luo et al. 2025a), black hole property estimation (H. Shen et al. 2021), detection of tidal features in galaxies(A. Desmons et al. 2024), radio galaxy classification (I.”
Measuring the Intracluster Light Fraction with Machine Learning
Canepa, L., Brough, S., Lanusse, F., Montes, M., & Hatch, N. A. (2025) · The Astrophysical Journal · doi:10.3847/1538-4357/adabc7 · Cited by 10
Self-citation
Metadata
- Authors
- Desmons, A., Brough, S., & Lanusse, F.
- Affiliations
- UNSW Sydney (AU)
- AIM, CEA, CNRS, Université Paris-Saclay, Université Paris Diderot , Sorbonne Paris Cité, F-91191 Gif-sur-Yvette , France
- Corresponding author
- Desmons, Alice
- Venue
- Monthly Notices of the Royal Astronomical Society
- Publisher
- Oxford University Press (OUP)
- Published
- 2024-06-05
- Volume
- 531
- Issue
- 4
- Pages
- 4070-4084
- ISSN
- 0035-8711 (ISSN-L)
- 1365-2966
- OpenAlex
- W4399363409
- Cited by
- 15
- References
- 93
- Citations by year
- 2026: 6 · 2025: 7 · 2024: 1
- FWCI
- 2.63
- Type
- journal article
- Language
- en
- Open access
- gold
- doi.org
- Licence
- Locations
- Monthly Notices of the Royal Astronomical Society (publishedVersion, cc-by)
- arXiv (Cornell University) (submittedVersion, cc-by)
- HAL (submittedVersion, cc-by)
- arXiv (Cornell University) (cc-by)
- Funders
- Australian Research Council (DP190101943)
- Topics
- Physical Sciences › Physics and Astronomy › Astronomy and Astrophysics › Galaxies: Formation, Evolution, Phenomena
- Physical Sciences › Physics and Astronomy › Astronomy and Astrophysics › Stellar, planetary, and galactic studies
- Physical Sciences › Physics and Astronomy › Astronomy and Astrophysics › Astrophysical Phenomena and Observations
- Keywords
- tidal features, galaxy mergers, self-supervised representation learning, automated feature detection, galaxy interactions, Hyper Suprime-Cam Subaru Strategic Program, Vera C. Rubin Observatory Legacy Survey of Space and Time, similarity search, galaxy evolution
About these checks
Registry, retraction, Cites and statistics results are computed, not judged, with one exception: a printed reference that no index lists is read once by a model before it counts as a citation error. Claims are extracted by a model and kept only when their quote appears verbatim in the text; each cited source is then checked, with a model’s help, for whether it says what the claim relies on. Those verdicts can be wrong — read the claim’s quote and the cited source before relying on one.
The claim verdicts this report counts are experimental: their accuracy is not yet measured.
A language model drew the claims from the paper on 2026-10-08, under version 3 of the claim definition (model deepseek-v4.1-flash, prompt extract-v3).
A second model labelled each claim on 2026-10-08 (model jev-1.13-20260917, definition revision gold-guideline-v0.2).
Cited sources are checked with a language model’s help (gpt-6-sol).
Statistics and arithmetic are recomputed, not judged.
Confidence bands are shown only for fields calibrated on our annotated test set. None is calibrated yet, so no band is shown.
What counts as a claim ›How we measure confidence ›How we check this ›
Are you an author, or do you see a problem with this page? Request a review
How to cite
Cite CoChat for the checks on this page, and the paper for its own findings.
- This page
- CoChat. (2026). Citation check: Detecting galaxy tidal features using self-supervised representation learning. https://app.cochat.ai/papers/10.1093/mnras/stae1402
- The paper
- Desmons, A., Brough, S., & Lanusse, F. (2024). Detecting galaxy tidal features using self-supervised representation learning. Monthly Notices of the Royal Astronomical Society. https://doi.org/10.1093/mnras/stae1402
Data sources
Bibliographic data: Semantic Scholar, OpenAlex, Crossref.
Contains information from the Semantic Scholar Academic Graph Datasets, made available under the ODC Attribution License (ODC-BY 1.0).
Semantic Scholar’s data is described in: Kinney, R., et al. (2023). The Semantic Scholar Open Data Platform. arXiv:2301.10140.
