

The DOI matches its Crossref record; 66 of the 66 references it cites were found in a registry or an index.
scDeepSort: a pre-trained cell-type annotation method for single-cell transcriptomics using deep learning with a weighted graph neural network
Open accessPublished version of a preprint
Abstract
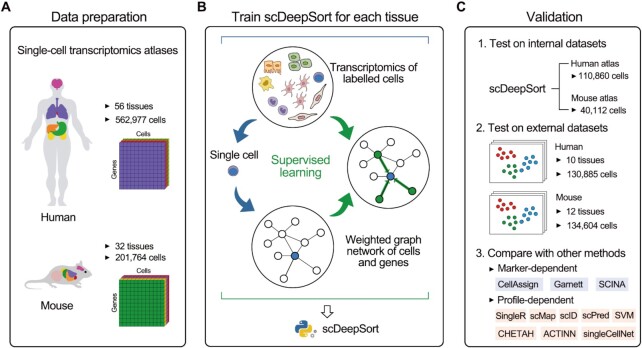
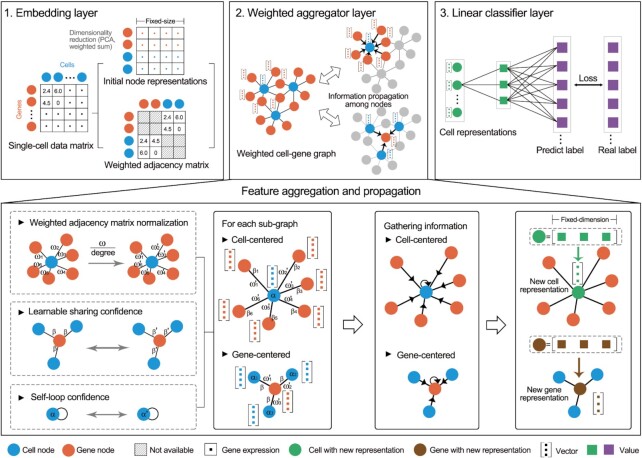
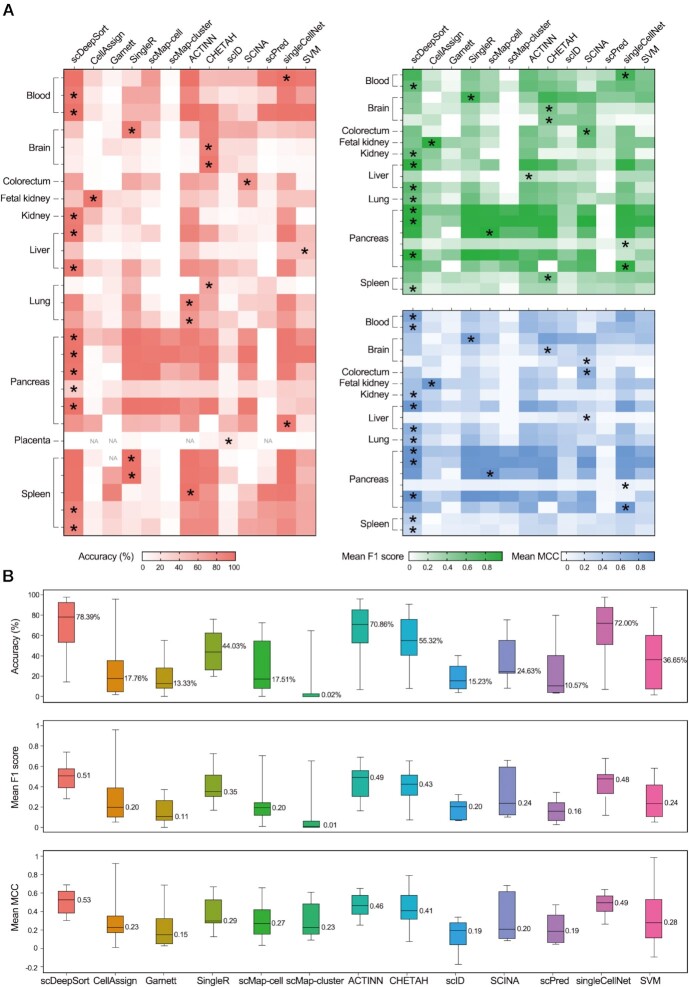
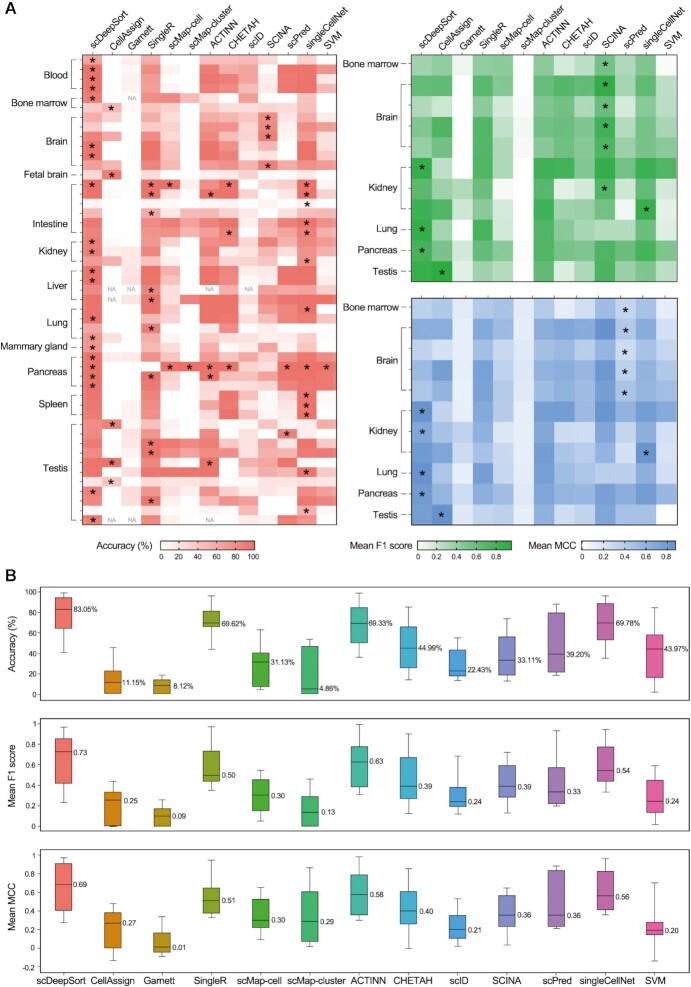
Advances in single-cell RNA sequencing (scRNA-seq) have furthered the simultaneous classification of thousands of cells in a single assay based on transcriptome profiling. In most analysis protocols, single-cell type annotation relies on marker genes or RNA-seq profiles, resulting in poor extrapolation. Still, the accurate cell-type annotation for single-cell transcriptomic data remains a great challenge. Here, we introduce scDeepSort (https://github.com/ZJUFanLab/scDeepSort), a pre-trained cell-type annotation tool for single-cell transcriptomics that uses a deep learning model with a weighted graph neural network (GNN). Using human and mouse scRNA-seq data resources, we demonstrate the high performance and robustness of scDeepSort in labeling 764 741 cells involving 56 human and 32 mouse tissues. Significantly, scDeepSort outperformed other known methods in annotating 76 external test datasets, reaching an 83.79% accuracy across 265 489 cells in humans and mice. Moreover, we demonstrate the universality of scDeepSort using more challenging datasets and using references from different scRNA-seq technology. Above all, scDeepSort is the first attempt to annotate cell types of scRNA-seq data with a pre-trained GNN model, which can realize the accurate cell-type annotation without additional references, i.e. markers or RNA-seq profiles.
Overview
The claims and statistics of this paper haven’t been checked yet.
Run the check — free, no account needed. It reads the open-access text and checks the sources it cites.
Integrity signals
Registry
Cites
Statistics
Figures
Verification
Claims the paper makes
The claims and statistics of this paper haven’t been checked yet.
Run the check — free, no account needed. It reads the open-access text and checks the sources it cites.
Claims other papers make about this one
Each is checked against this paper’s own text: does it say what the citing paper says it does?
The source backs part of the claim, not all of it — or backs it for a different population, condition or comparison.
In the citing paper
“Compared to tasks such as cell annotation and batch correction, perturbation prediction offers experimentally generated model input/output with well-defined objectives, making it a more robust benchmark for assessing foundation models (15, 20, 21).”
From A systematic comparison of single-cell perturbation response prediction models (2026) · cites this paper as [20]
Experimental — accuracy not yet measured
Self-check
Percentages, sums and reported differences re-computed from the paper’s own numbers.
The self-check needs the paper’s full text.
Citations
Cites
An integrated encyclopedia of DNA elements in the human genome
The ENCODE Project Consortium (2012) · Nature · doi:10.1038/nature11247 · Cited by 18,072
Mastering the game of Go with deep neural networks and tree search
Silver, D., Huang, A., Maddison, C. J., Guez, A., Sifre, L., van den Driessche, G., Schrittwieser, J., Antonoglou, I., Panneershelvam, V., Lanctot, M., et al. (2016) · Nature · doi:10.1038/nature16961 · Cited by 15,612
A Comprehensive Survey on Graph Neural Networks
Wu, Z., Pan, S., Chen, F., Long, G., Zhang, C., & Yu, P. S. (2021) · IEEE Transactions on Neural Networks and Learning Systems · doi:10.1109/tnnls.2020.2978386 · Cited by 11,000
Inductive Representation Learning on Large Graphs
Hamilton, W. L., Ying, R., & Leskovec, J. (2017) · arXiv · doi:10.48550/arxiv.1706.02216 · Cited by 10,639
Highly parallel genome-wide expression profiling of individual cells using nanoliter droplets.
Macosko, E. Z., Basu, A., Satija, R., Nemesh, J., Shekhar, K., Goldman, M., Tirosh, I., Bialas, A. R., Kamitaki, N., Martersteck, E. M., et al. (2015) · Cell · doi:10.1016/j.cell.2015.05.002 · Cited by 7,110
Graph neural networks: A review of methods and applications
Zhou, J., Cui, G., Hu, S., Zhang, Z., Yang, C., Liu, Z., Wang, L., Li, C., & Sun, M. (2020) · AI Open · doi:10.1016/j.aiopen.2021.01.001 · Cited by 6,880
Targeted Branching for the Maximum Independent Set Problem Using Graph Neural Networks
Silva, G., Rodrigues, M., Teixeira, A., & Amorim, M. (2024) · DROPS (Schloss Dagstuhl – Leibniz Center for Informatics) · doi:10.4230/lipics.sea.2024.20 · Cited by 5,183
Aran, D., Looney, A. P., Liu, L., Wu, E., Fong, V., Hsu, A., Chak, S., Naikawadi, R. P., Wolters, P. J., Abate, A. R., et al. (2019) · Nature Immunology · doi:10.1038/s41590-018-0276-y · Cited by 4,984
Identifying Medical Diagnoses and Treatable Diseases by Image-Based Deep Learning
Kermany, D. S., Goldbaum, M., Cai, W., Valentim, C. C. S., Liang, H., Baxter, S. L., McKeown, A., Yang, G., Wu, X., Yan, F., et al. (2018) · Cell · doi:10.1016/j.cell.2018.02.010 · Cited by 4,842
The single-cell transcriptional landscape of mammalian organogenesis
Cao, J., Spielmann, M., Qiu, X., Huang, X., Ibrahim, D. M., Hill, A. J., Zhang, F., Mundlos, S., Christiansen, L., Steemers, F. J., et al. (2019) · Nature · doi:10.1038/s41586-019-0969-x · Cited by 4,490
Cited by
Transfer learning enables predictions in network biology
Theodoris, C. V., Xiao, L., Chopra, A., Chaffin, M. D., Al Sayed, Z. R., Hill, M. C., Mantineo, H., Brydon, E. M., Zeng, Z., Liu, X. S., et al. (2023) · Nature · doi:10.1038/s41586-023-06139-9 · Cited by 1,193
High-resolution de novo structure prediction from primary sequence
Wu, R., Ding, F., Wang, R., Shen, R., Zhang, X., Luo, S., Su, C., Wu, Z., Xie, Q., Berger, B., et al. (2022) · doi:10.1101/2022.07.21.500999 · Cited by 392
Graph Neural Networks for Multimodal Single-Cell Data Integration
Wen, H., Ding, J., Jin, W., Wang, Y., Xie, Y., & Tang, J. (2022) · Proceedings of the 28th ACM SIGKDD Conference on Knowledge Discovery and Data Mining · doi:10.1145/3534678.3539213 · Cited by 77
Deep learning in spatial transcriptomics: Learning from the next next-generation sequencing
Heydari, A. A., & Sindi, S. S. (2023) · Biophysics Reviews · doi:10.1063/5.0091135 · Cited by 44
Graph neural networks for single-cell omics data: a review of approaches and applications
Li, S., Hua, H., & Chen, S. (2025) · Briefings in Bioinformatics · doi:10.1093/bib/bbaf109 · Cited by 43
Metadata
- Authors
- Shao, X., Yang, H., Zhuang, X., Liao, J., Yang, P., Cheng, J., Lu, X., Chen, H., & Fan, X.
- Affiliations
- Zhejiang University (CN)
- Pharmaceutical Informatics Institute, College of Pharmaceutical Sciences, Zhejiang University, Hangzhou 310058, China
- First Affiliated Hospital Zhejiang University (CN)
- Westlake University (CN)
- The University of Sydney (AU)
- Corresponding author
- Chen, Huajun
- Fan, Xiaohui
- Venue
- Nucleic Acids Research
- Publisher
- Oxford University Press (OUP)
- Published
- 2021-09-09
- Volume
- 49
- Issue
- 21
- Pages
- e122-e122
- ISSN
- 0305-1048 (ISSN-L)
- 1362-4962
- PMC
- PMC8643674
- OpenAlex
- W3198628780
- Cited by
- 158
- References
- 66
- Citations by year
- 2026: 23 · 2025: 35 · 2024: 47 · 2023: 31 · 2022: 20 · 2021: 2
- FWCI
- 7.88
- Type
- journal article
- Language
- en
- Open access
- gold
- doi.org
- Licence
- Locations
- Nucleic Acids Research (publishedVersion, cc-by-nc)
- bioRxiv (Cold Spring Harbor Laboratory) (acceptedVersion, cc-by-nc-nd)
- PubMed Central (publishedVersion, cc-by-nc)
- PubMed (publishedVersion)
- Funders
- National Natural Science Foundation of China (81973701, 91846204/U19B2027)
- Natural Science Foundation of Zhejiang Province (LZ20H290002)
- National Youth Top-notch Talent Support Program (W02070098)
- Topics
- Life Sciences › Biochemistry, Genetics and Molecular Biology › Molecular Biology › Single-cell and spatial transcriptomics
- Life Sciences › Biochemistry, Genetics and Molecular Biology › Molecular Biology › Gene expression and cancer classification
- Life Sciences › Biochemistry, Genetics and Molecular Biology › Molecular Biology › Genomics and Phylogenetic Studies
- Keywords
- cell type annotation, single-cell transcriptomics, pre-trained deep learning models, human and mouse tissues, cross-dataset generalization, single-cell RNA sequencing
- MeSH terms
- Deep Learning, Animals, Humans, RNA, Neural Networks, Computer, Databases, Genetic, Mice, Single-Cell Analysis, Transcriptome
About these checks
Registry, retraction, Cites and statistics results are computed, not judged, with one exception: a printed reference that no index lists is read once by a model before it counts as a citation error. Claims are extracted by a model and kept only when their quote appears verbatim in the text; each cited source is then checked, with a model’s help, for whether it says what the claim relies on. Those verdicts can be wrong — read the claim’s quote and the cited source before relying on one.
Statistics and arithmetic are recomputed, not judged.
Confidence bands are shown only for fields calibrated on our annotated test set. None is calibrated yet, so no band is shown.
What counts as a claim ›How we measure confidence ›How we check this ›
Are you an author, or do you see a problem with this page? Request a review
How to cite
Cite CoChat for the checks on this page, and the paper for its own findings.
- This page
- CoChat. (2026). Citation check: scDeepSort: a pre-trained cell-type annotation method for single-cell transcriptomics using deep learning with a weighted graph neural network. https://app.cochat.ai/papers/10.1093/nar/gkab775
- The paper
- Shao, X., Yang, H., Zhuang, X., Liao, J., Yang, P., Cheng, J., Lu, X., Chen, H., & Fan, X. (2021). scDeepSort: a pre-trained cell-type annotation method for single-cell transcriptomics using deep learning with a weighted graph neural network. Nucleic Acids Research. https://doi.org/10.1093/nar/gkab775
Data sources
Bibliographic data: Semantic Scholar, OpenAlex, Crossref.
Contains information from the Semantic Scholar Academic Graph Datasets, made available under the ODC Attribution License (ODC-BY 1.0).
Semantic Scholar’s data is described in: Kinney, R., et al. (2023). The Semantic Scholar Open Data Platform. arXiv:2301.10140.
