Cited by 88

The DOI matches its Crossref record; 2 of the 2 references it cites were found in a registry or an index.

Evolution of CRISPR RNA recognition and processing by Cas6 endonucleases

Niewoehner, O., Jinek, M., Doudna, J. A.·2014·Nucleic Acids Research

Overview

The claims and statistics of this paper haven’t been checked yet.

Run the check — free, no account needed. It reads the open-access text and checks the sources it cites.

A few free checks a day · papers already verified open instantly · results are public

Integrity signals

Registry

Crossref · 10.1093/nar/gkt922

Cites

2 of 2 references verified0 citation errors · 0 not checkable

Statistics

Figures

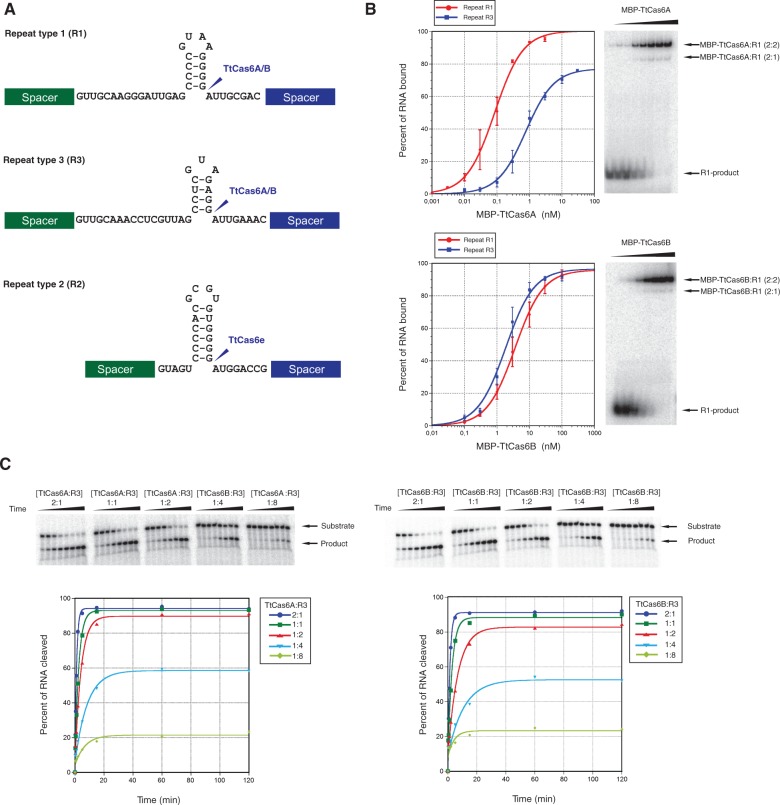
Figure 1. TtCas6A and TtCas6B both cleave repeats R1 and R3 and retain their cleaved products. (A) Sequences and predicted secondary structures of T. thermophilus CRISPR repeats. Sites of cleavage are indicated with blue arrows. TtCas6e (TTHB192) cleaves repeat R2, while TtCas6A (TTHA0078) and TtCas6B (TTHB231) both cleave repeats R1 and R3. (B) Cleavage product binding affinities of TtCas6A and TtCas6B enzymes. Maltose-binding protein (MBP)-fused TtCas6A or TtCas6B were bound to 5′-[32P]-radiolabeled, in vitro transcribed R1 and R3 RNAs. Bound and unbound fractions were resolved by electrophoresis on a native polyacrylamide gel and visualized by phosphorimaging. The data for these and all subsequent binding assays were fit with standard binding isotherms (solid line), unless otherwise stated. Error bars on each data point denote standard error of the mean (SEM) from three independent experiments. (C) Kinetics experiments to confirm single turnover. RNA cleavage assays were carried out at indicated protein:RNA ratios. RNA cleavage was monitored using denaturing polyacrylamide gel electrophoresis. The data from these and all subsequent endoribonuclease activity assays were fit with single exponential curves to yield first-order rate constants.
Figure 1. TtCas6A and TtCas6B both cleave repeats R1 and R3 and retain their cleaved products. (A) Sequences and predicted secondary structures of T. thermophilus CRISPR repeats. Sites of cleavage are indicated with blue arrows. TtCas6e (TTHB192) cleaves repeat R2, while TtCas6A (TTHA0078) and TtCas6B (TTHB231) both cleave repeats R1 and R3. (B) Cleavage product binding affinities of TtCas6A and TtCas6B enzymes. Maltose-binding protein (MBP)-fused TtCas6A or TtCas6B were bound to 5′-[32P]-radiolabeled, in vitro transcribed R1 and R3 RNAs. Bound and unbound fractions were resolved by electrophoresis on a native polyacrylamide gel and visualized by phosphorimaging. The data for these and all subsequent binding assays were fit with standard binding isotherms (solid line), unless otherwise stated. Error bars on each data point denote standard error of the mean (SEM) from three independent experiments. (C) Kinetics experiments to confirm single turnover. RNA cleavage assays were carried out at indicated protein:RNA ratios. RNA cleavage was monitored using denaturing polyacrylamide gel electrophoresis. The data from these and all subsequent endoribonuclease activity assays were fit with single exponential curves to yield first-order rate constants.CC BY-NC · PubMed Central
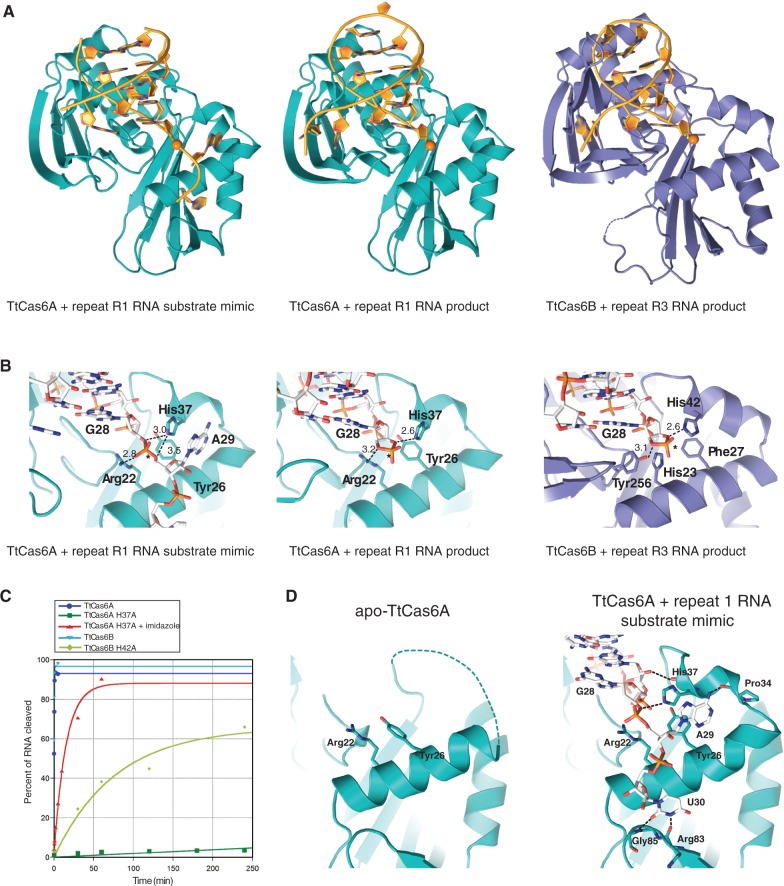
Figure 2. Structures of TtCas6A and TtCas6B enzymes bound to substrate mimic and product RNAs. (A) Ribbon diagrams showing the overall views of Cas6–RNA complexes: TtCas6A–R1 substrate mimic (left), TtCas6A–R1 product (middle) and TtCas6B–R3 product (right). Bound RNAs are depicted in cartoon format and colored in yellow. The scissile phosphate groups are depicted as orange spheres. All cartoon molecular diagrams were generated using Pymol (http://www.pymol.org). (B) Zoomed-in views of the TtCas6 active sites, shown in the same orientation as in A. Hydrogen-bonding interactions are denoted with dashed lines; numbers indicate interatomic distances in Å. (C) Endonuclease activity assays of wild-type (WT) and active-site mutant proteins. For the TtCas6A H37A mutant, the cleavage assay was additionally carried out in the presence of 500 mM imidazole. (D) Active site of TtCas6A undergoes conformational ordering on substrate recognition. Left: zoomed-in view of the active site in the RNA-free TtCas6A molecule in the 2:1 protein–R1 substrate mimic complex. Right: zoomed-in view of the active site in the RNA-bound TtCas6A molecule. Hydrogen-bonding interactions are denoted with dashed lines.
Figure 2. Structures of TtCas6A and TtCas6B enzymes bound to substrate mimic and product RNAs. (A) Ribbon diagrams showing the overall views of Cas6–RNA complexes: TtCas6A–R1 substrate mimic (left), TtCas6A–R1 product (middle) and TtCas6B–R3 product (right). Bound RNAs are depicted in cartoon format and colored in yellow. The scissile phosphate groups are depicted as orange spheres. All cartoon molecular diagrams were generated using Pymol (http://www.pymol.org). (B) Zoomed-in views of the TtCas6 active sites, shown in the same orientation as in A. Hydrogen-bonding interactions are denoted with dashed lines; numbers indicate interatomic distances in Å. (C) Endonuclease activity assays of wild-type (WT) and active-site mutant proteins. For the TtCas6A H37A mutant, the cleavage assay was additionally carried out in the presence of 500 mM imidazole. (D) Active site of TtCas6A undergoes conformational ordering on substrate recognition. Left: zoomed-in view of the active site in the RNA-free TtCas6A molecule in the 2:1 protein–R1 substrate mimic complex. Right: zoomed-in view of the active site in the RNA-bound TtCas6A molecule. Hydrogen-bonding interactions are denoted with dashed lines.CC BY-NC · PubMed Central
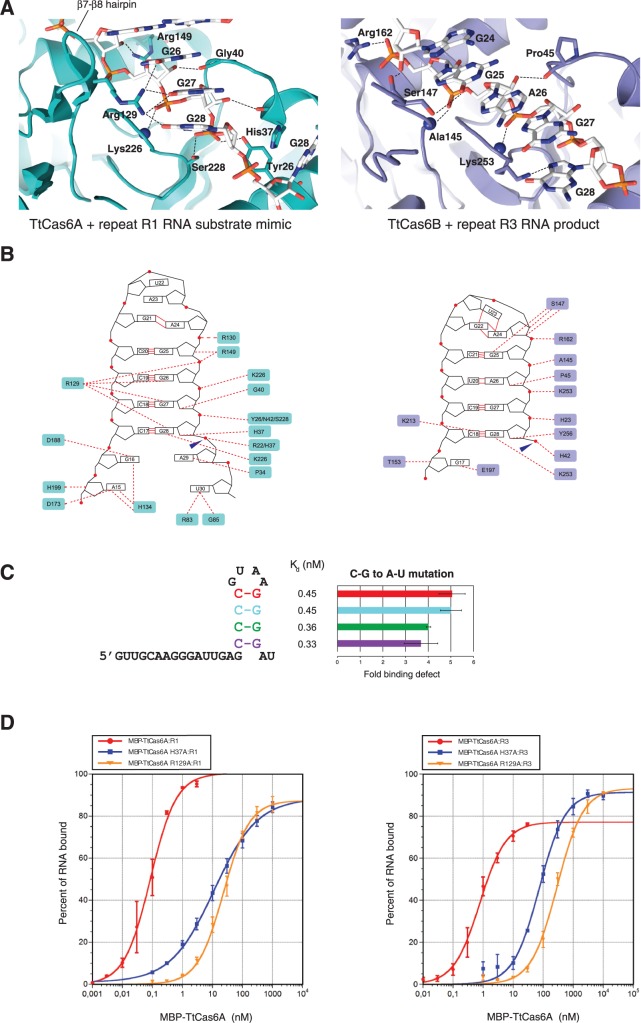
Figure 3. RNA recognition by TtCas6A and TtCas6B. (A) Detailed views of RNA binding by TtCas6A (left) and TtCas6B (right). Hydrogen-bonding interactions are indicated with black dashed lines. Blue spheres denote backbone amide nitrogen atoms of Lys226 in TtCas6A (left) and Ala145 and Lys253 in TtCas6B (right). (B) Schematic diagrams of protein–RNA contacts in the TtCas6A–R1 substrate mimic (left) and TtCas6B–R3 product complexes. Amino acid residues contacting the bound RNA via ionic or hydrogen-bonding interactions are highlighted. Blue arrows mark the scissile phosphates. Red circles denote phosphodiester groups in the RNA backbone. Red lines indicate base-pairing interactions. (C) Base-pair contributions to R1 repeat recognition by TtCas6A. A series of RNAs in which individual C-G base pairs were substituted with A-U were prepared and assayed for binding to TtCas6A using EMSAs. The data for each base-pair substitution are expressed as Kd and as fold reduction in affinity relative to wild-type R1 RNA. The color-coding follows the schematic diagram of the R1 RNA (left). (D) R1 (left) or R3 (right) product RNA binding by WT TtCas6A, R129A or H37A mutants was quantified using EMSAs. The data are plotted as in Figure 1B, with the exception of TtCas6A H37A, for which a modified equation using a Hill coefficient for negative cooperativity (n = 0.6) was used.
Figure 3. RNA recognition by TtCas6A and TtCas6B. (A) Detailed views of RNA binding by TtCas6A (left) and TtCas6B (right). Hydrogen-bonding interactions are indicated with black dashed lines. Blue spheres denote backbone amide nitrogen atoms of Lys226 in TtCas6A (left) and Ala145 and Lys253 in TtCas6B (right). (B) Schematic diagrams of protein–RNA contacts in the TtCas6A–R1 substrate mimic (left) and TtCas6B–R3 product complexes. Amino acid residues contacting the bound RNA via ionic or hydrogen-bonding interactions are highlighted. Blue arrows mark the scissile phosphates. Red circles denote phosphodiester groups in the RNA backbone. Red lines indicate base-pairing interactions. (C) Base-pair contributions to R1 repeat recognition by TtCas6A. A series of RNAs in which individual C-G base pairs were substituted with A-U were prepared and assayed for binding to TtCas6A using EMSAs. The data for each base-pair substitution are expressed as Kd and as fold reduction in affinity relative to wild-type R1 RNA. The color-coding follows the schematic diagram of the R1 RNA (left). (D) R1 (left) or R3 (right) product RNA binding by WT TtCas6A, R129A or H37A mutants was quantified using EMSAs. The data are plotted as in Figure 1B, with the exception of TtCas6A H37A, for which a modified equation using a Hill coefficient for negative cooperativity (n = 0.6) was used.CC BY-NC · PubMed Central
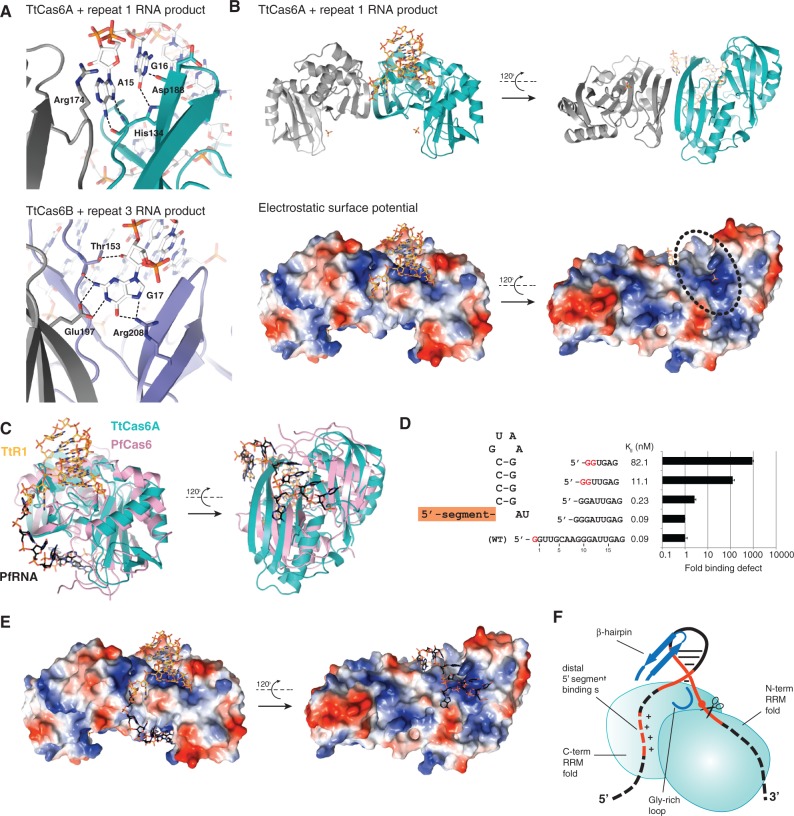
Figure 4. Recognition of the 5′ segment of the repeat RNA. (A) Details of sequence-specific recognition of nucleotides upstream of the stem-loop in RNA repeats. Top: TtCas6A–R1 product complex. Nucleotides 1–14 of the R1 product RNA are disordered. Bottom: TtCas6B–R3 product complex. Nucleotides 1–15 of the R3 product RNA are disordered. (B) Surface electrostatic potential map of TtCas6A identifies a second RNA binding site. Top: Cartoon diagram of the 2:1 TtCas6A–R1 product RNA complex. RNA is shown in orange. Bound sulfate ions are depicted in stick format. Bottom: Electrostatic surface potential map of TtCas6A, shown in the same orientations as earlier. Blue, positively charged region; red, negatively charged region. The positively charged patch located on the surface opposite from the active site is highlighted with a black ellipse. (C) Structural superposition of the TtCas6A–R1 product RNA (TtR1) and PfCas6–repeat RNA (PfRNA) (PDB code: 3PKM) complexes. TtCas6A is colored teal; PfCas6 is colored pink. T. thermophilus R1 repeat RNA is colored orange. PfRNA is colored black. Nucleotide A15 of TtR1 aligns with G10 of PfRNA. (D) Nucleotides in the single-stranded 5′ segment of R1 repeat RNA contribute to binding. TtCas6A binding to a series of truncated RNAs based on the R1 repeat was quantified by EMSAs as in Figure 1B. The data are expressed as Kd and as a fold binding defect relative to wild-type R1 repeat. 5′-terminal G nucleotides resulting from in vitro transcription are shown in G. (E) Structural superposition of TtCas6A dimer with P. furiosus repeat RNA, based on the superposition shown in D. TtCas6A is colored according to surface electrostatic potential and shown in the same orientations as in B. TtR1 RNA is colored orange; PfRNA is colored black. (F) Cartoon model of RNA recognition by TtCas6 enzymes. TtCas6A binds the stem-loop region of the RNA (red solid line) at the interface of the two RRM-like domains. The two major elements responsible for the interaction are the variable beta-hairpin and the Gly-rich loop (both depicted in blue). Additionally, the 5′ segment of the repeat RNA (dashed red line) is bound by a distal positively charged cleft.
Figure 4. Recognition of the 5′ segment of the repeat RNA. (A) Details of sequence-specific recognition of nucleotides upstream of the stem-loop in RNA repeats. Top: TtCas6A–R1 product complex. Nucleotides 1–14 of the R1 product RNA are disordered. Bottom: TtCas6B–R3 product complex. Nucleotides 1–15 of the R3 product RNA are disordered. (B) Surface electrostatic potential map of TtCas6A identifies a second RNA binding site. Top: Cartoon diagram of the 2:1 TtCas6A–R1 product RNA complex. RNA is shown in orange. Bound sulfate ions are depicted in stick format. Bottom: Electrostatic surface potential map of TtCas6A, shown in the same orientations as earlier. Blue, positively charged region; red, negatively charged region. The positively charged patch located on the surface opposite from the active site is highlighted with a black ellipse. (C) Structural superposition of the TtCas6A–R1 product RNA (TtR1) and PfCas6–repeat RNA (PfRNA) (PDB code: 3PKM) complexes. TtCas6A is colored teal; PfCas6 is colored pink. T. thermophilus R1 repeat RNA is colored orange. PfRNA is colored black. Nucleotide A15 of TtR1 aligns with G10 of PfRNA. (D) Nucleotides in the single-stranded 5′ segment of R1 repeat RNA contribute to binding. TtCas6A binding to a series of truncated RNAs based on the R1 repeat was quantified by EMSAs as in Figure 1B. The data are expressed as Kd and as a fold binding defect relative to wild-type R1 repeat. 5′-terminal G nucleotides resulting from in vitro transcription are shown in G. (E) Structural superposition of TtCas6A dimer with P. furiosus repeat RNA, based on the superposition shown in D. TtCas6A is colored according to surface electrostatic potential and shown in the same orientations as in B. TtR1 RNA is colored orange; PfRNA is colored black. (F) Cartoon model of RNA recognition by TtCas6 enzymes. TtCas6A binds the stem-loop region of the RNA (red solid line) at the interface of the two RRM-like domains. The two major elements responsible for the interaction are the variable beta-hairpin and the Gly-rich loop (both depicted in blue). Additionally, the 5′ segment of the repeat RNA (dashed red line) is bound by a distal positively charged cleft.CC BY-NC · PubMed Central

Verification

Claims the paper makes

The claims and statistics of this paper haven’t been checked yet.

Run the check — free, no account needed. It reads the open-access text and checks the sources it cites.

A few free checks a day · papers already verified open instantly · results are public

Claims other papers make about this one

Each is checked against this paper’s own text: does it say what the citing paper says it does?

Self-check

Percentages, sums and reported differences re-computed from the paper’s own numbers.

The self-check needs the paper’s full text.

Citations

Cites

Research works printed but not linked: 42

  1. Marraffini, 2010, Nature reviews. Genetics, 11, 181, 10.1038/nrg2749 · DOI · Paper page
  2. Al-Attar, 2011, Biological chemistry, 392, 277, 10.1515/BC.2011.042 · DOI
  3. Terns, 2011, Current opinion in microbiology, 14, 321, 10.1016/j.mib.2011.03.005 · DOI
  4. Brouns, 2008, Science, 321, 960, 10.1126/science.1159689 · DOI · Paper page
  5. Makarova, 2011, Nature reviews. Microbiology, 9, 467, 10.1038/nrmicro2577 · DOI · Paper page
  6. Carte, 2008, Genes & Development, 22, 3489, 10.1101/gad.1742908 · DOI
  7. Haurwitz, 2010, Science, 329, 1355, 10.1126/science.1192272 · DOI
  8. Jore, 2011, Nature structural & molecular biology, 18, 529, 10.1038/nsmb.2019 · DOI
  9. Sashital, 2011, Nature structural & molecular biology, 18, 680, 10.1038/nsmb.2043 · DOI
  10. Gesner, 2011, Nature structural & molecular biology, 18, 688, 10.1038/nsmb.2042 · DOI · Paper page
  11. 2006, Protein Science, 15, 1494, 10.1110/ps.062131106 · DOI
  12. Kunin, 2007, Genome biology, 8, R61, 10.1186/gb-2007-8-4-r61 · DOI
  13. 2012, RNA, 18, 661, 10.1261/rna.030882.111 · DOI
  14. Wang, 2011, Structure (London), 19, 257, 10.1016/j.str.2010.11.014 · DOI
  15. Kabsch, 2010, Acta Crystallographica, Section D: Biological Crystallography, 66, 125, 10.1107/S0907444909047337 · DOI · Paper page
  16. Zwart, 2008, Methods in molecular biology (Clifton, N.J.), 426, 419, 10.1007/978-1-60327-058-8_28 · DOI
  17. Vonrhein, 2007, Methods in molecular biology (Clifton, N.J.), 364, 215, 10.1385/1-59745-266-1:215 · DOI
  18. Emsley, 2004, Acta Crystallographica, Section D: Biological Crystallography, 60, 2126, 10.1107/S0907444904019158 · DOI · Paper page
  19. McCoy, 2007, Journal of Applied Crystallography, 40, 658, 10.1107/S0021889807021206 · DOI · Paper page
  20. Adams, 2010, Acta Crystallographica, Section D: Biological Crystallography, 66, 213, 10.1107/S0907444909052925 · DOI · Paper page
  21. Terwilliger, 2004, Acta Crystallographica, Section D: Biological Crystallography, 60, 2144, 10.1107/S0907444904019535 · DOI
  22. Morris, 2003, Methods in enzymology, 374, 229, 10.1016/S0076-6879(03)74011-7 · DOI
  23. 2007, Nucleic Acids Research, 35, W375, 10.1093/nar/gkm216 · DOI
  24. Agari, 2010, Journal of molecular biology, 395, 270, 10.1016/j.jmb.2009.10.057 · DOI
  25. 2012, RNA, 18, 783, 10.1261/rna.031468.111 · DOI
  26. Wang, 2012, Protein Science, 21, 405, 10.1002/pro.2028 · DOI
  27. 2013, Structure (London), 21, 385, 10.1016/j.str.2013.01.010 · DOI
  28. 2013, The Biochemical journal, 453, 155, 10.1042/BJ20130316 · DOI
  29. 2013, PNAS, 110, 5416, 10.1073/pnas.1302807110 · DOI
  30. Makarova, 2011, 6, 38, 10.1186/1745-6150-6-38 · DOI
  31. Haft, 2005, 1, e60, 10.1371/journal.pcbi.0010060 · DOI
  32. Serra, 1993, Nucleic Acids Research, 21, 3845, 10.1093/nar/21.16.3845 · DOI
  33. Makarova, 2002, Nucleic Acids Research, 30, 482, 10.1093/nar/30.2.482 · DOI · Paper page
  34. 2011, PNAS, 108, 10092, 10.1073/pnas.1102716108 · DOI
  35. Wiedenheft, 2011, Nature; Physical Science (London), 477, 486, 10.1038/nature10402 · DOI
  36. Hale, 2009, Cell, 139, 945, 10.1016/j.cell.2009.07.040 · DOI · Paper page
  37. 2011, Journal of Biological Chemistry, 286, 21643, 10.1074/jbc.M111.238485 · DOI
  38. Haurwitz, 2012, The EMBO Journal, 31, 2824, 10.1038/emboj.2012.107 · DOI
  39. Grissa, 2007, BMC bioinformatics [electronic resource], 8, 172, 10.1186/1471-2105-8-172 · DOI · Paper page
  40. 2012, Nucleic Acids Research, 40, D445, 10.1093/nar/gkr998 · DOI
  41. Gouet, 1999, Bioinformatics, 15, 305, 10.1093/bioinformatics/15.4.305 · DOI
  42. Holm, 1995, Trends in biochemical sciences, 20, 478, 10.1016/S0968-0004(00)89105-7 · DOI

Cited by

Metadata

Authors
Niewoehner, O., Jinek, M., & Doudna, J. A.
Venue
Nucleic Acids Research
Published
2013-10-22
Volume
42
Issue
2
Pages
1341-1353
ISSN
  • 0305-1048
  • 1362-4962
Cited by
88
References
2
Language
en

About these checks

Registry, retraction, Cites and statistics results are computed, not judged, with one exception: a printed reference that no index lists is read once by a model before it counts as a citation error. Claims are extracted by a model and kept only when their quote appears verbatim in the text; each cited source is then checked, with a model’s help, for whether it says what the claim relies on. Those verdicts can be wrong — read the claim’s quote and the cited source before relying on one.

Statistics and arithmetic are recomputed, not judged.

Confidence bands are shown only for fields calibrated on our annotated test set. None is calibrated yet, so no band is shown.

What counts as a claim ›How we measure confidence ›How we check this ›

Are you an author, or do you see a problem with this page? Request a review