Cited by 216RNA and protein synthesis mechanismsRNA Research and SplicingGenomics and Chromatin Dynamics

The DOI matches its Crossref record; 115 of the 115 references it cites were found in a registry or an index.

Multiple roles of the coding sequence 5′ end in gene expression regulation

Open access
Tuller, Tamir, Zur, Hadas·2015·Nucleic Acids Research

Abstract

The codon composition of the coding sequence's (ORF) 5' end first few dozen codons is known to be distinct to that of the rest of the ORF. Various explanations for the unusual codon distribution in this region have been proposed in recent years, and include, among others, novel regulatory mechanisms of translation initiation and elongation. However, due to the fact that many overlapping regulatory signals are suggested to be associated with this relatively short region, its research is challenging. Here, we review the currently known signals that appear in this region, the theories related to the way they regulate translation and affect the organismal fitness, and the debates they provoke.

Overview

The claims and statistics of this paper haven’t been checked yet.

Run the check — free, no account needed. It reads the open-access text and checks the sources it cites.

A few free checks a day · papers already verified open instantly · results are public

Integrity signals

Registry

Crossref · 10.1093/nar/gku1313

Cites

115 of 115 references verified0 citation errors · 0 not checkable

Statistics

Figures

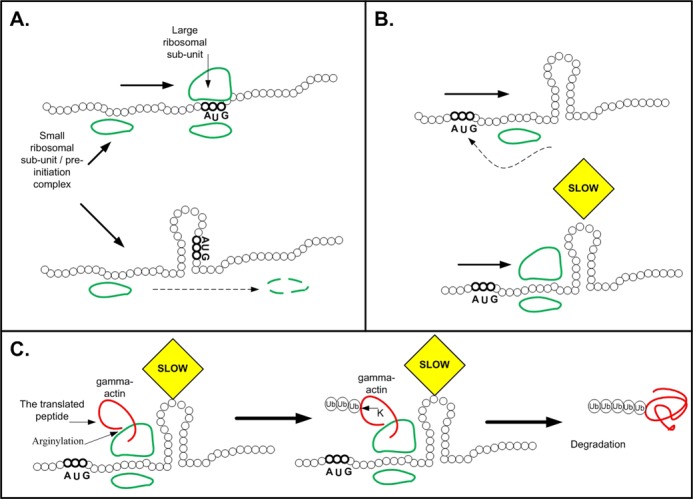
Figure 1. The effect of mRNA folding on translation. All sub-figures include illustrations of the mRNA structure (black) and the ribosomal small and large subunits (green). (A) Illustration of how weak mRNA folding at the 5′ end promotes recognition of the start codon by the pre-initiation complex: when the mRNA near the start codon is not folded (top) the pre-initiation complex recognizes the start codon in an efficient manner; when strong mRNA folding surrounds the start codon (bottom) it reduces the affinity of the start codon to the pre-initiation complex. (B) Top part: Strong mRNA folding downstream of the 5′ end can improve initiation efficiency by blocking the pre-initiation complex's movement after missing the start codon. Bottom part: Strong mRNA folding downstream of the 5′ end can improve ribosomal allocation and prevent traffic jams by slowing down ribosomes at the beginning of the ORF (and thus increasing the distances between the ribosomes; see illustration in Figure 2A). (C) Strong mRNA folding downstream of the 5′ end can also promote degradation of arginylated gamma actin via the exposure of normally hidden lysine residues for ubiquitination (details in the main text).
Figure 1. The effect of mRNA folding on translation. All sub-figures include illustrations of the mRNA structure (black) and the ribosomal small and large subunits (green). (A) Illustration of how weak mRNA folding at the 5′ end promotes recognition of the start codon by the pre-initiation complex: when the mRNA near the start codon is not folded (top) the pre-initiation complex recognizes the start codon in an efficient manner; when strong mRNA folding surrounds the start codon (bottom) it reduces the affinity of the start codon to the pre-initiation complex. (B) Top part: Strong mRNA folding downstream of the 5′ end can improve initiation efficiency by blocking the pre-initiation complex's movement after missing the start codon. Bottom part: Strong mRNA folding downstream of the 5′ end can improve ribosomal allocation and prevent traffic jams by slowing down ribosomes at the beginning of the ORF (and thus increasing the distances between the ribosomes; see illustration in Figure 2A). (C) Strong mRNA folding downstream of the 5′ end can also promote degradation of arginylated gamma actin via the exposure of normally hidden lysine residues for ubiquitination (details in the main text).CC BY · PubMed Central
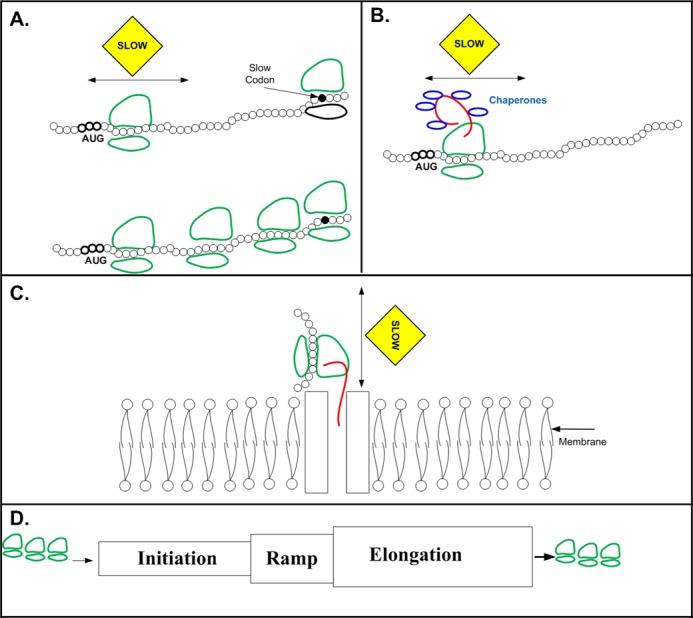
Figure 2. Proposed reasons for the ramp of slower codons, which are less adapted to the tRNA pool, at the beginning of the ORF. The sub-figures include illustrations of the mRNA structure (black), the ribosomal small and large subunits (green), and the translated protein (red). (A) Slower codons at the beginning of the ORF improve ribosomal allocation, and prevent jamming and abortion in highly translated genes that have high ribosomal load: Top: When there is a region which is translated at a slower rate at the 5′ end of the ORF it increases ribosome spacing, and decreases the probability of ribosomal jamming and abortion due to slower codons afterward. Bottom: when the region at the 5′ end is not slow, ribosomes have a higher probability to jam and abort downstream from the beginning of the ORF; for example, due to the higher initiation rate there will be a ribosomal jam after a slow codon downstream from the 5′ end (marked in black). (B) The slower codons at the 5′ end of the ORF are required for accurate protein folding, and provide sufficient time for chaperon requirement (in blue). (C) The slower codons at the 5′ end enable maturation and folding of secretory proteins: the delay caused by the slower codons is required for considering the constraints related to co- and post-translational stages such as membrane translocation and coordinating these stages. (D) Illustration: The ramp, region with slower codons at the 5′ end, enables coupling initiation and elongation, and filtering stochasticity due to the fact that it is ‘written’ in the same ‘language’ as the elongation control ‘language’. For example, since the ramp is part of the ORF, a global decrease/increase in all the tRNA levels will similarly effect both the ramp and the region downstream of it. Specifically, the relative translation rate of the ramp in comparison to the region afterwards will be maintained.
Figure 2. Proposed reasons for the ramp of slower codons, which are less adapted to the tRNA pool, at the beginning of the ORF. The sub-figures include illustrations of the mRNA structure (black), the ribosomal small and large subunits (green), and the translated protein (red). (A) Slower codons at the beginning of the ORF improve ribosomal allocation, and prevent jamming and abortion in highly translated genes that have high ribosomal load: Top: When there is a region which is translated at a slower rate at the 5′ end of the ORF it increases ribosome spacing, and decreases the probability of ribosomal jamming and abortion due to slower codons afterward. Bottom: when the region at the 5′ end is not slow, ribosomes have a higher probability to jam and abort downstream from the beginning of the ORF; for example, due to the higher initiation rate there will be a ribosomal jam after a slow codon downstream from the 5′ end (marked in black). (B) The slower codons at the 5′ end of the ORF are required for accurate protein folding, and provide sufficient time for chaperon requirement (in blue). (C) The slower codons at the 5′ end enable maturation and folding of secretory proteins: the delay caused by the slower codons is required for considering the constraints related to co- and post-translational stages such as membrane translocation and coordinating these stages. (D) Illustration: The ramp, region with slower codons at the 5′ end, enables coupling initiation and elongation, and filtering stochasticity due to the fact that it is ‘written’ in the same ‘language’ as the elongation control ‘language’. For example, since the ramp is part of the ORF, a global decrease/increase in all the tRNA levels will similarly effect both the ramp and the region downstream of it. Specifically, the relative translation rate of the ramp in comparison to the region afterwards will be maintained.CC BY · PubMed Central
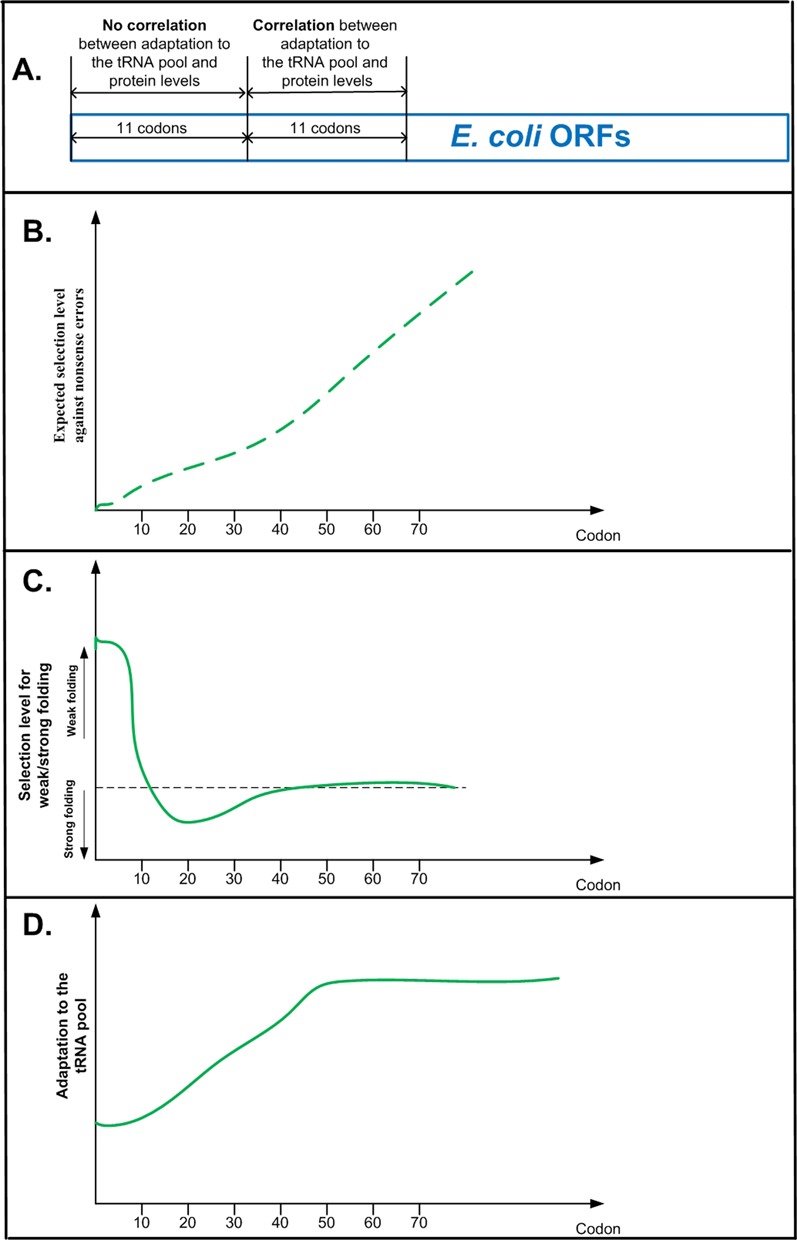
Figure 3. (A) Correlation between local adaptation of codons to the tRNA pool and protein levels in E. coli endogenous genes. When controlling for mRNA folding the correlation is not significant in the case of the first 11 codons, but significant in the case of the second 11 codons (codons 12–22). (B–D) Comparison of the genomic profiles of selection for adaptation to the tRNA pool and selection for mRNA folding strength, to the expected genomic profile of the cost of nonsense errors. (B) Expected profile of selection against nonsense errors: if selection against nonsense errors is the only dominant factor shaping codon usage bias along the coding sequence, we expect to see a monotonic increasing level of selection along the coding sequence (as explained in the main text, a nonsense error further away from the 5′ end should cost more than an error closer to the 5′ end of the ORF). (C) The profile of selection for weak (strong) mRNA folding: the region under selection for weak folding includes the first ∼10–13 codons; it is followed by a region of selection for strong mRNA folding, and after ∼40 codons there is no specific local signal of selection for mRNA folding (18–24). (D) The profile of adaptation to the tRNA pool: the region under selection for weak adaptation to the tRNA pool includes the first ∼30–40 codons (6,40,41).
Figure 3. (A) Correlation between local adaptation of codons to the tRNA pool and protein levels in E. coli endogenous genes. When controlling for mRNA folding the correlation is not significant in the case of the first 11 codons, but significant in the case of the second 11 codons (codons 12–22). (B–D) Comparison of the genomic profiles of selection for adaptation to the tRNA pool and selection for mRNA folding strength, to the expected genomic profile of the cost of nonsense errors. (B) Expected profile of selection against nonsense errors: if selection against nonsense errors is the only dominant factor shaping codon usage bias along the coding sequence, we expect to see a monotonic increasing level of selection along the coding sequence (as explained in the main text, a nonsense error further away from the 5′ end should cost more than an error closer to the 5′ end of the ORF). (C) The profile of selection for weak (strong) mRNA folding: the region under selection for weak folding includes the first ∼10–13 codons; it is followed by a region of selection for strong mRNA folding, and after ∼40 codons there is no specific local signal of selection for mRNA folding (18–24). (D) The profile of adaptation to the tRNA pool: the region under selection for weak adaptation to the tRNA pool includes the first ∼30–40 codons (6,40,41).CC BY · PubMed Central
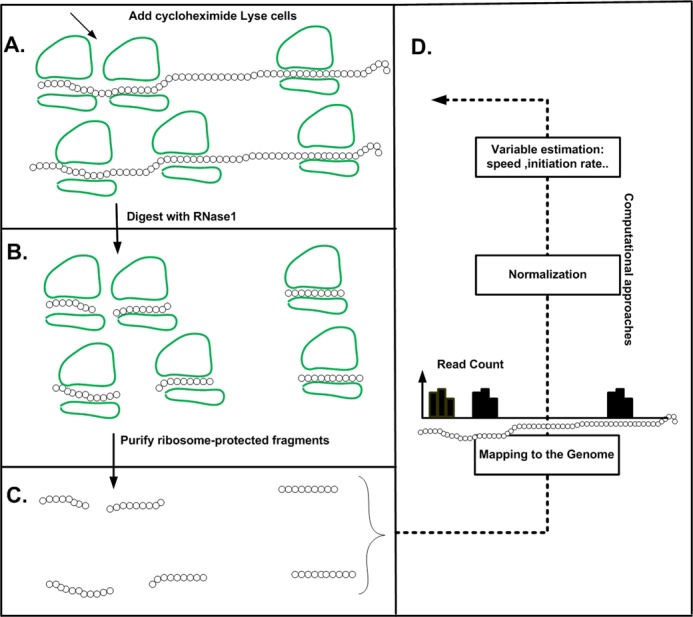
Figure 4. The ribosome profiling approach. The method includes the following steps: cells are treated with cycloheximide to arrest translation (A), ribosomes are fixed and mRNA regions not protected by ribosomes are digested (B) and ribosome-protected RNA fragments are recovered (C). After processing and reverse-transcription, these are sequenced, mapped, and used to derive ribosomal density profiles. The profile includes a vector of read counts for each coding sequence: for each codon (a position in the vector) we have the number of reads that were mapped to this position (B). If for a certain coding sequence a ribosome tends to spend more time on codon x than on codon y (i.e. codon x is slower than codon y), the read count related to codon x will be higher than the read count for codon y.
Figure 4. The ribosome profiling approach. The method includes the following steps: cells are treated with cycloheximide to arrest translation (A), ribosomes are fixed and mRNA regions not protected by ribosomes are digested (B) and ribosome-protected RNA fragments are recovered (C). After processing and reverse-transcription, these are sequenced, mapped, and used to derive ribosomal density profiles. The profile includes a vector of read counts for each coding sequence: for each codon (a position in the vector) we have the number of reads that were mapped to this position (B). If for a certain coding sequence a ribosome tends to spend more time on codon x than on codon y (i.e. codon x is slower than codon y), the read count related to codon x will be higher than the read count for codon y.CC BY · PubMed Central
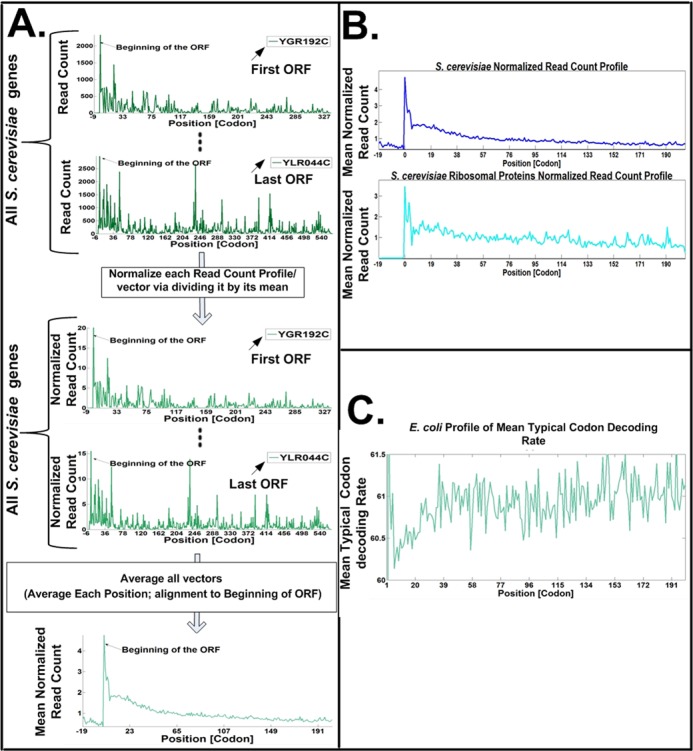
Figure 5. (A) The procedure for reporting the mean genomic normalized ribosomal density profile (see, e.g. (64)): Upper sub-figure: the ribosome footprint read-counts (ribosomal density) profile is computed for each gene; each profile includes the number of reads that were mapped for each codon in the gene's ORF (see also Figure 4). Middle sub-figure: each individual gene's ribosomal density profile is normalized by dividing by its mean read count; at this stage, the mean read count of each of the gene profiles is identical. Lower sub-figure: the normalized read count profiles are aligned to the start codon; a mean genomic read-count profile is obtained by averaging all the individual profiles (for each codon we compute the mean normalized read count for this codon across all the genes). Under this procedure each gene ‘contributes’ similarly to the mean profile; thus, there should not be an increased ribosomal density at the 5′ end of the ORF, if ribosomal density is only due to higher initiation rates (and thus higher read counts and ribosome density) in shorter genes. The fact that the mean normalized read count profile of local ribosomal density is higher at the 5′ end (as can be seen in the figure) demonstrates that higher initiation rates in shorter genes can't explain this phenomena. (B) Mean normalized read count profile of local ribosomal density for the entire gene set and for the ribosomal proteins of S. cerevisiae. In both cases the normalized ribosomal density is higher at the 5′ end. (C) Mean genomic profile of the typical codon decoding rates in E. coli: the typical decoding rate of each codon is obtained based on a novel statistical filter that controls for phenomena such as experimental biases (specifically at the 5′ end of the ORF), extreme (but possibly rare) ribosome pauses, and ribosome traffic jams. The profile suggests that the first 30–40 codons in E. coli indeed tend to include codons with lower nominal/typical translation rates.
Figure 5. (A) The procedure for reporting the mean genomic normalized ribosomal density profile (see, e.g. (64)): Upper sub-figure: the ribosome footprint read-counts (ribosomal density) profile is computed for each gene; each profile includes the number of reads that were mapped for each codon in the gene's ORF (see also Figure 4). Middle sub-figure: each individual gene's ribosomal density profile is normalized by dividing by its mean read count; at this stage, the mean read count of each of the gene profiles is identical. Lower sub-figure: the normalized read count profiles are aligned to the start codon; a mean genomic read-count profile is obtained by averaging all the individual profiles (for each codon we compute the mean normalized read count for this codon across all the genes). Under this procedure each gene ‘contributes’ similarly to the mean profile; thus, there should not be an increased ribosomal density at the 5′ end of the ORF, if ribosomal density is only due to higher initiation rates (and thus higher read counts and ribosome density) in shorter genes. The fact that the mean normalized read count profile of local ribosomal density is higher at the 5′ end (as can be seen in the figure) demonstrates that higher initiation rates in shorter genes can't explain this phenomena. (B) Mean normalized read count profile of local ribosomal density for the entire gene set and for the ribosomal proteins of S. cerevisiae. In both cases the normalized ribosomal density is higher at the 5′ end. (C) Mean genomic profile of the typical codon decoding rates in E. coli: the typical decoding rate of each codon is obtained based on a novel statistical filter that controls for phenomena such as experimental biases (specifically at the 5′ end of the ORF), extreme (but possibly rare) ribosome pauses, and ribosome traffic jams. The profile suggests that the first 30–40 codons in E. coli indeed tend to include codons with lower nominal/typical translation rates.CC BY · PubMed Central
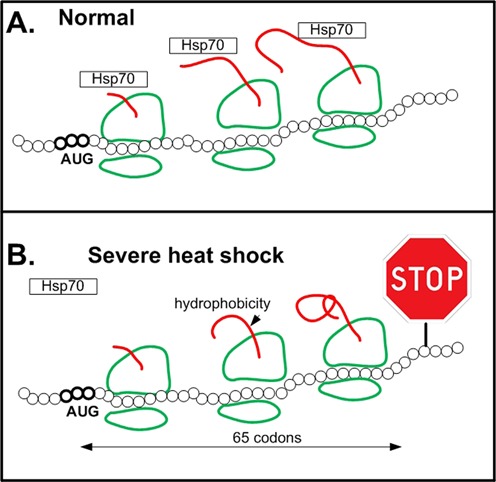
Figure 6. An illustration of how severe heat stress triggers global pausing of translation elongation in the vicinity of codon 65 in proteins with hydrophobic N-terminus via down regulation of Hsp70. (A) In normal conditions Hsp70 contributes to accurate protein folding during translation elongation. (B) The N-terminus of proteins tends to have hydrophobic amino acids that cause (among others) miss-folding/aggregation, and can interact with the ribosome exit tunnel. During severe heat stress chaperons such as Hsp70, that normally prevent miss-folding and aggregation, are down regulated; thus, these problems result in ribosomal pauses on average after 65 codons.
Figure 6. An illustration of how severe heat stress triggers global pausing of translation elongation in the vicinity of codon 65 in proteins with hydrophobic N-terminus via down regulation of Hsp70. (A) In normal conditions Hsp70 contributes to accurate protein folding during translation elongation. (B) The N-terminus of proteins tends to have hydrophobic amino acids that cause (among others) miss-folding/aggregation, and can interact with the ribosome exit tunnel. During severe heat stress chaperons such as Hsp70, that normally prevent miss-folding and aggregation, are down regulated; thus, these problems result in ribosomal pauses on average after 65 codons.CC BY · PubMed Central
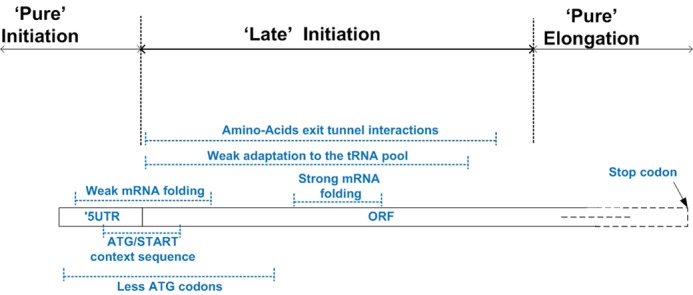
Figure 7. Summary of the reported regulatory signals encoded at the 5′ end of the ORF. The Figure zooms into the first 70 codons of the ORF; it includes the region in the transcript where each signal tends to appear (dotted blue lines with the corresponding signal near the line). The figure emphasizes the beginning of the ORF as a late initiation region, which couples the initiation and elongation steps; this, region is part of the coding sequence but also includes signals that regulate the initiation step.
Figure 7. Summary of the reported regulatory signals encoded at the 5′ end of the ORF. The Figure zooms into the first 70 codons of the ORF; it includes the region in the transcript where each signal tends to appear (dotted blue lines with the corresponding signal near the line). The figure emphasizes the beginning of the ORF as a late initiation region, which couples the initiation and elongation steps; this, region is part of the coding sequence but also includes signals that regulate the initiation step.CC BY · PubMed Central

Verification

Claims the paper makes

The claims and statistics of this paper haven’t been checked yet.

Run the check — free, no account needed. It reads the open-access text and checks the sources it cites.

A few free checks a day · papers already verified open instantly · results are public

Claims other papers make about this one

Each is checked against this paper’s own text: does it say what the citing paper says it does?

Self-check

Percentages, sums and reported differences re-computed from the paper’s own numbers.

The self-check needs the paper’s full text.

Citations

Cites

Show all 115 references

Research works printed but not linked: 2

  1. Dana, 2014, Properties and determinants of codon translation speed distributions, BMC Genomics., S13, 15
  2. Ban, 2000, The complete atomic structure of the large ribosomal subunit at 2.4 A resolution, Science, 289, 905, 10.1126/science.289.5481.905 · DOI · Paper page

Cited by

Sorted by citations

Items 201–216 of 216

Metadata

Authors
Tuller, T., & Zur, H.
Affiliations
Tel Aviv University (IL)
Corresponding author
Tuller, Tamir
Venue
Nucleic Acids Research
Published
2014-12-12
Volume
43
Issue
1
Pages
13-28
ISSN
  • 0305-1048 (ISSN-L)
  • 1362-4962
OpenAlex
W2046872786
Cited by
206
References
115
Citations by year
2026: 6 · 2025: 12 · 2024: 12 · 2023: 17 · 2022: 16 · 2021: 19 · 2020: 28 · 2019: 18 · 2018: 21 · 2017: 27 · 2016: 16 · 2015: 13 · 2014: 1
FWCI
1.79
Type
journal article
Language
en
Open access
Locations
  • Nucleic Acids Research (publishedVersion, cc-by)
  • Europe PMC (PubMed Central) (publishedVersion, cc-by)
  • PubMed Central (publishedVersion, cc-by)
  • PubMed (publishedVersion)
Topics
  • Life Sciences › Biochemistry, Genetics and Molecular Biology › Molecular Biology › RNA and protein synthesis mechanisms
  • Life Sciences › Biochemistry, Genetics and Molecular Biology › Molecular Biology › RNA Research and Splicing
  • Life Sciences › Biochemistry, Genetics and Molecular Biology › Molecular Biology › Genomics and Chromatin Dynamics
Keywords
5' untranslated region, codon usage bias, translation initiation, translation elongation, gene expression regulation, codon composition, regulatory signals, organismal fitness
MeSH terms
Codon, Gene Expression Regulation, Peptide Chain Initiation, Translational, Ribosomes, RNA, Messenger, RNA, Transfer, Protein Biosynthesis, Open Reading Frames, Regulatory Sequences, Ribonucleic Acid, RNA Folding

About these checks

Registry, retraction, Cites and statistics results are computed, not judged, with one exception: a printed reference that no index lists is read once by a model before it counts as a citation error. Claims are extracted by a model and kept only when their quote appears verbatim in the text; each cited source is then checked, with a model’s help, for whether it says what the claim relies on. Those verdicts can be wrong — read the claim’s quote and the cited source before relying on one.

Statistics and arithmetic are recomputed, not judged.

Confidence bands are shown only for fields calibrated on our annotated test set. None is calibrated yet, so no band is shown.

What counts as a claim ›How we measure confidence ›How we check this ›

Are you an author, or do you see a problem with this page? Request a review