CoChat

Start-Stop Assembly: a functionally scarless DNA assembly system optimized for metabolic engineering

Open access
Taylor, George M, Mordaka, Paweł M, Heap, John T · 2019 · Nucleic Acids Research

Published version of a preprint

The DOI matches its Crossref record; 79 of the 79 references it cites were found in a registry or an index.

Abstract

DNA assembly allows individual DNA constructs or libraries to be assembled quickly and reliably. Most methods are either: (i) Modular, easily scalable and suitable for combinatorial assembly, but leave undesirable 'scar' sequences; or (ii) bespoke (non-modular), scarless but less suitable for construction of combinatorial libraries. Both have limitations for metabolic engineering. To overcome this trade-off we devised Start-Stop Assembly, a multi-part, modular DNA assembly method which is both functionally scarless and suitable for combinatorial assembly. Crucially, 3 bp overhangs corresponding to start and stop codons are used to assemble coding sequences into expression units, avoiding scars at sensitive coding sequence boundaries. Building on this concept, a complete DNA assembly framework was designed and implemented, allowing assembly of up to 15 genes from up to 60 parts (or mixtures); monocistronic, operon-based or hybrid configurations; and a new streamlined assembly hierarchy minimizing the number of vectors. Only one destination vector is required per organism, reflecting our optimization of the system for metabolic engineering in diverse organisms. Metabolic engineering using Start-Stop Assembly was demonstrated by combinatorial assembly of carotenoid pathways in Escherichia coli resulting in a wide range of carotenoid production and colony size phenotypes indicating the intended exploration of design space.

Overview

The claims and statistics of this paper haven’t been checked yet.

Free: it reads the open-access text and checks the first 5 claims that cite a source we can check. Create a free account to check every claim.

A few free checks a day · papers already verified open instantly · results are public

Integrity signals

Registry

Crossref · 10.1093/nar/gky1182

Cites

79 of 79 references verified0 citation errors · 0 not checkable

Statistics

Figures

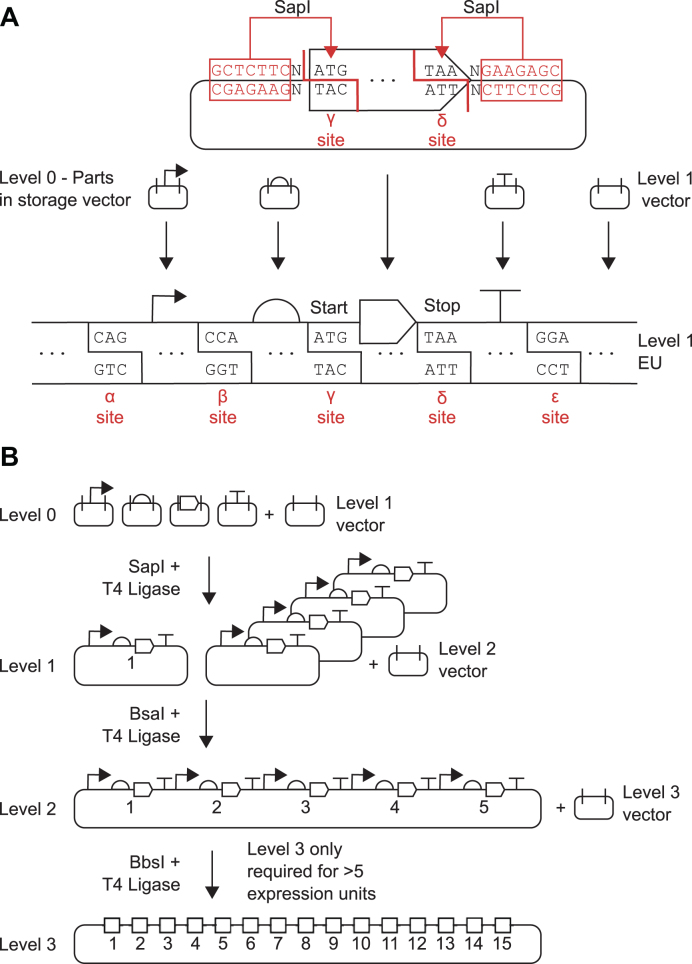
Figure 1. Schematic overview of Start-Stop Assembly. (A) Architecture of Level 1 assembly of expression units from genetic parts, showing detail for the CDS part in Level 0. Parts stored in Level 0 are flanked by inward-facing SapI restriction sites. Each type of part (promoter, RBS, CDS, terminator) uses different and unique fusion sites (α-ϵ sites) that allow the correct assembly of expression units. Coding sequences use the start codon ATG (γ site) and stop codon TAA (δ site) as fusion sites allowing functionally scarless assembly of expression units. (B) Schematic illustration showing the overall framework for Start-Stop Assembly. Up to 15 expression units can be hierarchically assembled from basic parts.
Figure 1. Schematic overview of Start-Stop Assembly. (A) Architecture of Level 1 assembly of expression units from genetic parts, showing detail for the CDS part in Level 0. Parts stored in Level 0 are flanked by inward-facing SapI restriction sites. Each type of part (promoter, RBS, CDS, terminator) uses different and unique fusion sites (α-ϵ sites) that allow the correct assembly of expression units. Coding sequences use the start codon ATG (γ site) and stop codon TAA (δ site) as fusion sites allowing functionally scarless assembly of expression units. (B) Schematic illustration showing the overall framework for Start-Stop Assembly. Up to 15 expression units can be hierarchically assembled from basic parts.CC BY · PubMed Central
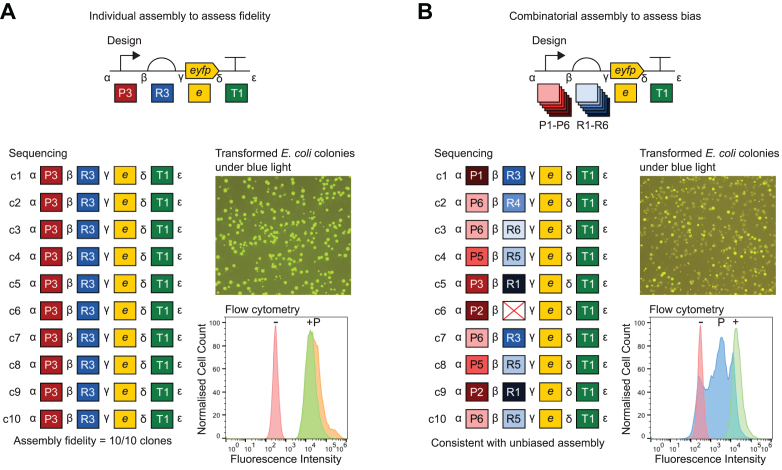
Figure 2. Assessment of fidelity and bias of multi-part Level 1 assembly. Constructs were assembled from Level 0 parts (in storage plasmids) into Level 1 vector pStA1AZ. Promoters, in descending order of strength: P1 = J23100, P2 = J23102, P3 = J23118, P4 = J23107, P5 = J23116, P6 = J23113. RBSs, in descending order of strength: R1 = RBSc44, R2 = RBSc33, R3 = RBSc13, R4 = RBSc58, R5 = RBSc42, R6 = RBSc36. CDS: e = eyfp. Terminator: T1 = L3S2P55. Representative images of E. coli DH10B colonies transformed with assembly reactions are shown illuminated by blue light to visualize fluorescence. In each experiment ten randomly-selected colonies (c1-c10) were analysed by sequencing (with primers oligoGT234 and oligoGT235) and flow cytometry. Sequencing results show expected intact parts and fusion sites. Flow cytometry histograms show fluorescence intensity of 10,000 events (cells) normalised to the maximum (in order to visualize distribution rather than absolute values) for wild-type E. coli DH10B as a negative reference (−), the most fluorescent of the ten clones as a positive reference (+) and a pool of several hundred transformants (P). (A) Assessment of assembly fidelity using assembly of an individual P3-R3-e-T1 expression unit. Two colonies were randomly selected for analysis from each of five replicate assemblies. The flow cytometry positive reference (+) strain is c3. (B) Assessment of assembly bias by combinatorial assembly of EYFP expression units using six promoters P1-P6, six RBSs R1-R6, eyfp and terminator T1. Ten colonies from one assembly were randomly selected for analysis. The flow cytometry positive reference (+) strain is c1. In the sequencing results the red cross indicates a misassembly between β and γ in place of the UTR/RBS. Two further replicates of this experiment are shown in Supplementary Figure S24.
Figure 2. Assessment of fidelity and bias of multi-part Level 1 assembly. Constructs were assembled from Level 0 parts (in storage plasmids) into Level 1 vector pStA1AZ. Promoters, in descending order of strength: P1 = J23100, P2 = J23102, P3 = J23118, P4 = J23107, P5 = J23116, P6 = J23113. RBSs, in descending order of strength: R1 = RBSc44, R2 = RBSc33, R3 = RBSc13, R4 = RBSc58, R5 = RBSc42, R6 = RBSc36. CDS: e = eyfp. Terminator: T1 = L3S2P55. Representative images of E. coli DH10B colonies transformed with assembly reactions are shown illuminated by blue light to visualize fluorescence. In each experiment ten randomly-selected colonies (c1-c10) were analysed by sequencing (with primers oligoGT234 and oligoGT235) and flow cytometry. Sequencing results show expected intact parts and fusion sites. Flow cytometry histograms show fluorescence intensity of 10,000 events (cells) normalised to the maximum (in order to visualize distribution rather than absolute values) for wild-type E. coli DH10B as a negative reference (−), the most fluorescent of the ten clones as a positive reference (+) and a pool of several hundred transformants (P). (A) Assessment of assembly fidelity using assembly of an individual P3-R3-e-T1 expression unit. Two colonies were randomly selected for analysis from each of five replicate assemblies. The flow cytometry positive reference (+) strain is c3. (B) Assessment of assembly bias by combinatorial assembly of EYFP expression units using six promoters P1-P6, six RBSs R1-R6, eyfp and terminator T1. Ten colonies from one assembly were randomly selected for analysis. The flow cytometry positive reference (+) strain is c1. In the sequencing results the red cross indicates a misassembly between β and γ in place of the UTR/RBS. Two further replicates of this experiment are shown in Supplementary Figure S24.CC BY · PubMed Central
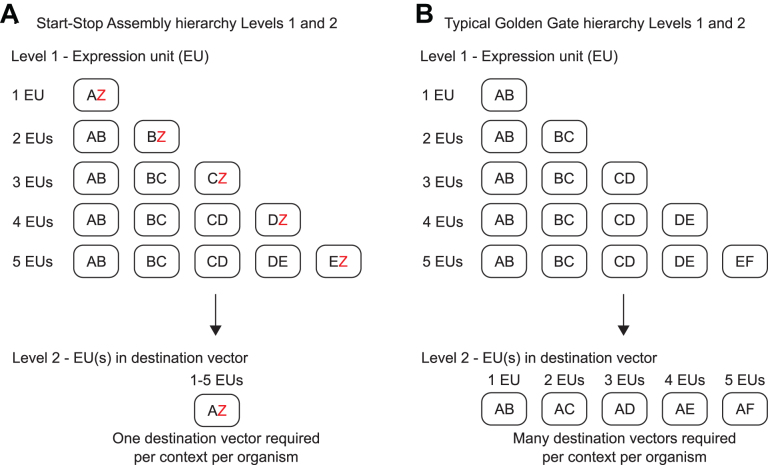
Figure 3. Alternative hierarchies achieved by alternative organization of Level 1 donor and Level 2 acceptor fusion sites. Rounded rectangles represent vectors. Letters represent Level 1 donor fusion sites and Level 2 acceptor fusion sites. (A) Start-Stop Assembly uses alternative ‘Z vectors’ at Level 1 to minimize the number of destination vectors at Level 2. By assembling the last expression unit (of those being assembled at Level 1) in a Z vector at Level 1, in which the last donor fusion site is Z, then the recipient Level 2 vector can always use the same acceptor fusion sites, A and Z. While this requires more Level 1 vectors, it requires only one Level 2 vector. If alternative destination vectors are required for different organisms or contexts, only one new Level 2 vector needs to be constructed. (B) The typical Golden Gate framework requires multiple Level 2 vectors per context to accommodate all the possible Level 1 fusion site configurations. Therefore if an alternative destination vector is required several new vectors will need to be constructed per context or organism.
Figure 3. Alternative hierarchies achieved by alternative organization of Level 1 donor and Level 2 acceptor fusion sites. Rounded rectangles represent vectors. Letters represent Level 1 donor fusion sites and Level 2 acceptor fusion sites. (A) Start-Stop Assembly uses alternative ‘Z vectors’ at Level 1 to minimize the number of destination vectors at Level 2. By assembling the last expression unit (of those being assembled at Level 1) in a Z vector at Level 1, in which the last donor fusion site is Z, then the recipient Level 2 vector can always use the same acceptor fusion sites, A and Z. While this requires more Level 1 vectors, it requires only one Level 2 vector. If alternative destination vectors are required for different organisms or contexts, only one new Level 2 vector needs to be constructed. (B) The typical Golden Gate framework requires multiple Level 2 vectors per context to accommodate all the possible Level 1 fusion site configurations. Therefore if an alternative destination vector is required several new vectors will need to be constructed per context or organism.CC BY · PubMed Central
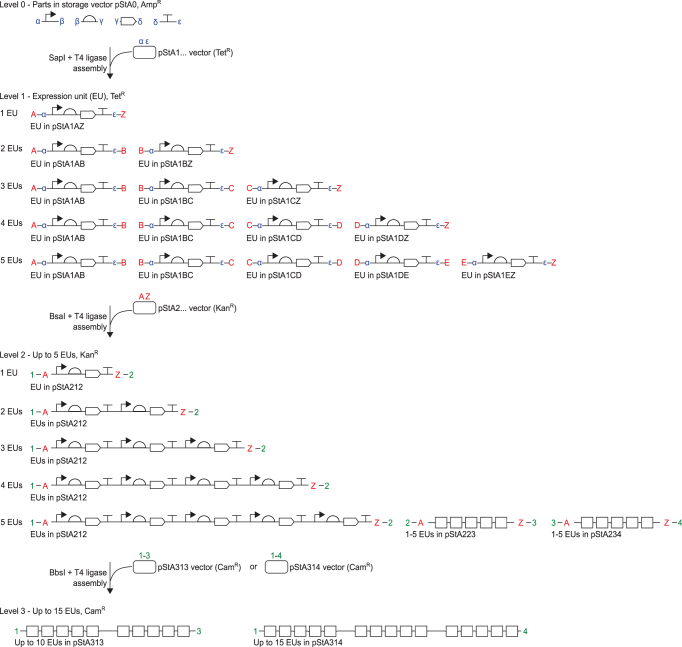
Figure 4. Detail of multi-part hierarchical assembly and fusion sites used in Start-Stop Assembly. Up to 15 expression units can be hierarchically assembled from basic parts (promoters, RBSs, CDSs and terminators) stored at Level 0. Level 1 expression units are assembled from four Level 0 parts, Level 2 constructs are assembled from up to five Level 1 expression units, and Level 3 constructs are assembled from up to three Level 2 constructs. Different type IIS restriction endonucleases (SapI, BsaI or BbsI) and different antibiotic-resistance markers (AmpR, TetR, KanR or CamR) are used for each assembly level as shown. Acceptor fusion sites are shown inside donor fusion sites at Level 1 and Level 2. Only donor fusion sites are shown at Level 0, and only acceptor fusion sites are shown at Level 3. As described in the text, alternative sets of vectors are used at Level 1 depending upon the number of expression units being assembled, such that the first and last Level 1 donor fusion sites are always A and Z, respectively, which are always the Level 2 acceptor fusion sites. Multiple Level 2 vectors (pStA212, pStA223, pStA234) with different donor fusion sites are only needed if the assembly will be continued to Level 3, in order to assemble more than five expression units. Alternative Level 3 vectors (pStA313, pStA314) with different acceptor fusion sites allow for assembly of two or three Level 2 constructs.
Figure 4. Detail of multi-part hierarchical assembly and fusion sites used in Start-Stop Assembly. Up to 15 expression units can be hierarchically assembled from basic parts (promoters, RBSs, CDSs and terminators) stored at Level 0. Level 1 expression units are assembled from four Level 0 parts, Level 2 constructs are assembled from up to five Level 1 expression units, and Level 3 constructs are assembled from up to three Level 2 constructs. Different type IIS restriction endonucleases (SapI, BsaI or BbsI) and different antibiotic-resistance markers (AmpR, TetR, KanR or CamR) are used for each assembly level as shown. Acceptor fusion sites are shown inside donor fusion sites at Level 1 and Level 2. Only donor fusion sites are shown at Level 0, and only acceptor fusion sites are shown at Level 3. As described in the text, alternative sets of vectors are used at Level 1 depending upon the number of expression units being assembled, such that the first and last Level 1 donor fusion sites are always A and Z, respectively, which are always the Level 2 acceptor fusion sites. Multiple Level 2 vectors (pStA212, pStA223, pStA234) with different donor fusion sites are only needed if the assembly will be continued to Level 3, in order to assemble more than five expression units. Alternative Level 3 vectors (pStA313, pStA314) with different acceptor fusion sites allow for assembly of two or three Level 2 constructs.CC BY · PubMed Central
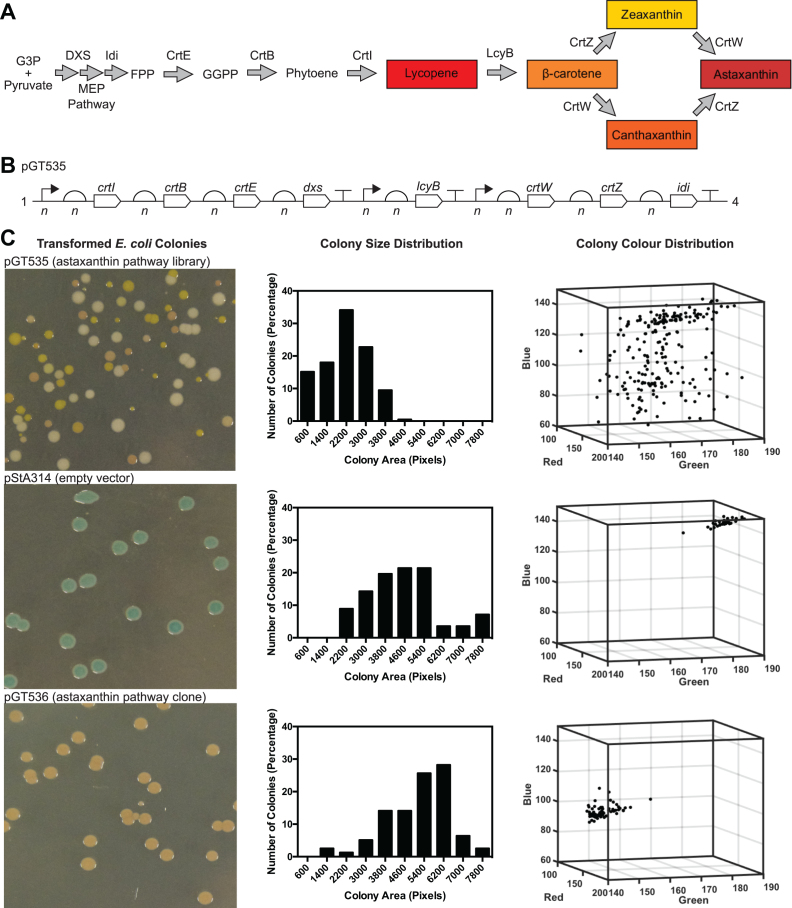
Figure 5. Combinatorial assembly of astaxanthin pathway using Start-Stop Assembly. (A) Astaxanthin pathway showing the endogenous enzymes of the E. coli MEP pathway and heterologous enzymes. Coloured products are shown in boxes, enzymes included in the combinatorial assembly are shown above arrows. Abbreviations: G3P (glyceraldehyde 3-phosphate), FPP (Farnesyl pyrophosphate), GGPP (Geranylgeranyl pyrophosphate). (B) Design of astaxanthin pathway library pGT535, composed of eight expression units combinatorially and hierarchically assembled into Level 3 vector pStA314, as outlined in the text and shown in detail in Figure S20. Mixtures of six parts of varying strengths were used at each promoter and RBS position shown, as described in the text. These are shown as n in the figure to reflect the sample of the combinatorial design space present after hierarchical assembly. Assembled insert size = 9,984 bp. Total size of plasmid including assembled insert = 12,691 bp. (C) Phenotypic variation among E. coli clones of the astaxanthin pathway library (pGT535) was compared to controls pStA314 (empty vector) and an isolated clone pGT536 from the astaxanthin pathway library pGT535. Phenotypic variation is shown using representative images of colonies, histograms of colony size (measured as colony area in pixels, x-axis values represent the upper limit of each histogram bin) and the distributions of colony colours (represented using red, green and blue values extracted from colony images).
Figure 5. Combinatorial assembly of astaxanthin pathway using Start-Stop Assembly. (A) Astaxanthin pathway showing the endogenous enzymes of the E. coli MEP pathway and heterologous enzymes. Coloured products are shown in boxes, enzymes included in the combinatorial assembly are shown above arrows. Abbreviations: G3P (glyceraldehyde 3-phosphate), FPP (Farnesyl pyrophosphate), GGPP (Geranylgeranyl pyrophosphate). (B) Design of astaxanthin pathway library pGT535, composed of eight expression units combinatorially and hierarchically assembled into Level 3 vector pStA314, as outlined in the text and shown in detail in Figure S20. Mixtures of six parts of varying strengths were used at each promoter and RBS position shown, as described in the text. These are shown as n in the figure to reflect the sample of the combinatorial design space present after hierarchical assembly. Assembled insert size = 9,984 bp. Total size of plasmid including assembled insert = 12,691 bp. (C) Phenotypic variation among E. coli clones of the astaxanthin pathway library (pGT535) was compared to controls pStA314 (empty vector) and an isolated clone pGT536 from the astaxanthin pathway library pGT535. Phenotypic variation is shown using representative images of colonies, histograms of colony size (measured as colony area in pixels, x-axis values represent the upper limit of each histogram bin) and the distributions of colony colours (represented using red, green and blue values extracted from colony images).CC BY · PubMed Central
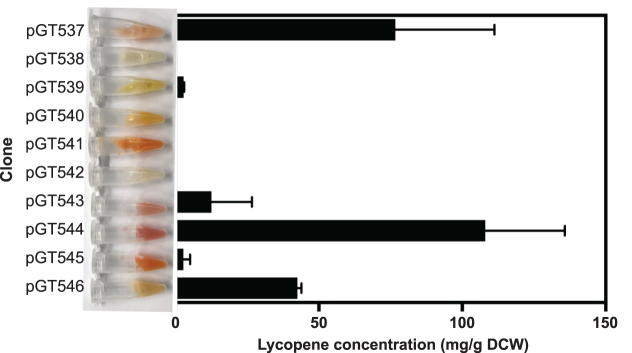
Figure 6. Lycopene content of E. coli clones from the astaxanthin library. Ten E. coli colonies were randomly selected from the combinatorially-assembled astaxanthin pathway library pGT535 (Figure 5, Figure S20). Each clone was grown for 24 h in LB broth before lycopene content was determined as mg lycopene per dry cell weight (DCW). Error bars represent the standard deviation of three independent biological replicates. A photograph of a sample of the culture of each clone was taken (shown to left of graph), which shows the visible variation of colour in the ten cultures, attributed to their different profiles of the carotenoids produced in the astaxanthin pathway.
Figure 6. Lycopene content of E. coli clones from the astaxanthin library. Ten E. coli colonies were randomly selected from the combinatorially-assembled astaxanthin pathway library pGT535 (Figure 5, Figure S20). Each clone was grown for 24 h in LB broth before lycopene content was determined as mg lycopene per dry cell weight (DCW). Error bars represent the standard deviation of three independent biological replicates. A photograph of a sample of the culture of each clone was taken (shown to left of graph), which shows the visible variation of colour in the ten cultures, attributed to their different profiles of the carotenoids produced in the astaxanthin pathway.CC BY · PubMed Central

Verification

Claims the paper makes

The claims and statistics of this paper haven’t been checked yet.

Free: it reads the open-access text and checks the first 5 claims that cite a source we can check. Create a free account to check every claim.

A few free checks a day · papers already verified open instantly · results are public

Claims other papers make about this one

Each is checked against this paper’s own text: does it say what the citing paper says it does?

Self-check

Percentages, sums and reported differences re-computed from the paper’s own numbers.

The self-check needs the paper’s full text.

Citations

Cites

Show all 79 references

Research works printed but not linked: 1

  1. Anderson, 2009, Registry of Standard Biological Parts

Cited by

See all 98

Metadata

Authors
Taylor, G. M., Mordaka, P. M., & Heap, J. T.
Affiliations
Imperial College London (GB)
Corresponding author
Heap, John T
Venue
Nucleic Acids Research
Published
2018-11-20
Volume
47
Issue
3
Pages
e17-e17
ISSN
  • 0305-1048 (ISSN-L)
  • 1362-4962
OpenAlex
W2952578507
Cited by
91
References
79
Citations by year
2026: 15 · 2025: 16 · 2024: 9 · 2023: 11 · 2022: 9 · 2021: 12 · 2020: 11 · 2019: 7 · 2018: 1
FWCI
2.76
Type
journal article
Language
en
Open access
Locations
  • Nucleic Acids Research (publishedVersion, cc-by)
  • bioRxiv (Cold Spring Harbor Laboratory) (acceptedVersion, cc-by-nd)
  • Europe PMC (PubMed Central) (publishedVersion, cc-by)
  • PubMed Central (publishedVersion, cc-by)
  • PubMed (publishedVersion)
  • Repository@Nottingham (University of Nottingham) (acceptedVersion, other-oa)
  • Repository@Nottingham (University of Nottingham) (submittedVersion, cc-by)
  • Spiral (Imperial College London) (submittedVersion)
  • Spiral (Imperial College London) (submittedVersion, cc-by)
Funders
Biotechnology and Biological Sciences Research Council (BB/M002454/1)
Topics
  • Life Sciences › Biochemistry, Genetics and Molecular Biology › Molecular Biology › Microbial Metabolic Engineering and Bioproduction
  • Life Sciences › Biochemistry, Genetics and Molecular Biology › Molecular Biology › CRISPR and Genetic Engineering
  • Life Sciences › Biochemistry, Genetics and Molecular Biology › Genetics › Bacterial Genetics and Biotechnology
Keywords
metabolic engineering, carotenoid biosynthesis, Escherichia coli, synthetic biology
MeSH terms
Carotenoids, Cloning, Molecular, DNA, Escherichia coli, Genetic Vectors, Metabolic Networks and Pathways, Metabolic Engineering

About these checks

Registry, retraction, Cites and statistics results are computed, not judged, with one exception: a printed reference that no index lists is read once by a model before it counts as a citation error. Claims are extracted by a model and kept only when their quote appears verbatim in the text; each cited source is then checked, with a model’s help, for whether it says what the claim relies on. Those verdicts can be wrong — read the claim’s quote and the cited source before relying on one.

Statistics and arithmetic are recomputed, not judged.

Confidence bands are shown only for fields calibrated on our annotated test set. None is calibrated yet, so no band is shown.

What counts as a claim ›How we measure confidence ›How we check this ›

Are you an author, or do you see a problem with this page? Request a review

How to cite

Cite CoChat for the checks on this page, and the paper for its own findings.

This page
CoChat. (2026). Citation check: Start-Stop Assembly: a functionally scarless DNA assembly system optimized for metabolic engineering. https://app.cochat.ai/papers/10.1093/nar/gky1182
The paper
Taylor, G. M., Mordaka, P. M., & Heap, J. T. (2019). Start-Stop Assembly: a functionally scarless DNA assembly system optimized for metabolic engineering. Nucleic Acids Research. https://doi.org/10.1093/nar/gky1182

Data sources

Bibliographic data: Semantic Scholar, OpenAlex, Crossref.

Contains information from the Semantic Scholar Academic Graph Datasets, made available under the ODC Attribution License (ODC-BY 1.0).

Semantic Scholar’s data is described in: Kinney, R., et al. (2023). The Semantic Scholar Open Data Platform. arXiv:2301.10140.