

The DOI matches its Crossref record; 12 of the 15 references it cites were found in a registry or an index.
The mouse Gene Expression Database (GXD): 2019 update
Open accessAbstract
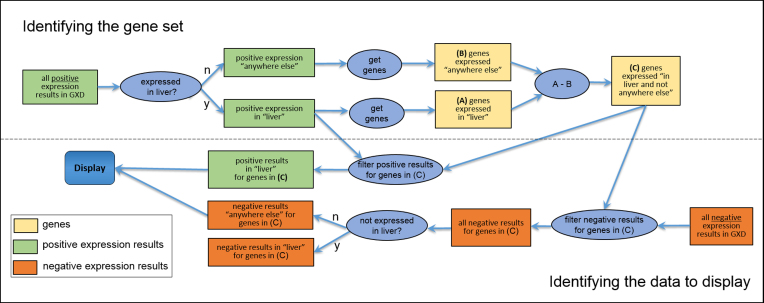
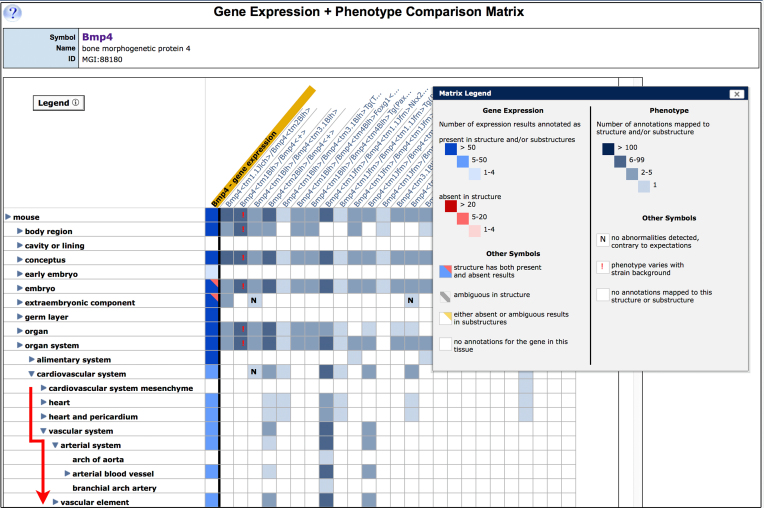
The mouse Gene Expression Database (GXD) is an extensive, well-curated community resource freely available at www.informatics.jax.org/expression.shtml. Covering all developmental stages, GXD includes data from RNA in situ hybridization, immunohistochemistry, RT-PCR, northern blot and western blot experiments in wild-type and mutant mice. GXD's gene expression information is integrated with the other data in Mouse Genome Informatics and interconnected with other databases, placing these data in the larger biological and biomedical context. Since the last report, the ability of GXD to provide insights into the molecular mechanisms of development and disease has been greatly enhanced by the addition of new data and by the implementation of new web features. These include: improvements to the Differential Gene Expression Data Search, facilitating searches for genes that have been shown to be exclusively expressed in a specified structure and/or developmental stage; an enhanced anatomy browser that now provides access to expression data and phenotype data for a given anatomical structure; direct access to the wild-type gene expression data for the tissues affected in a specific mutant; and a comparison matrix that juxtaposes tissues where a gene is normally expressed against tissues, where mutations in that gene cause abnormalities.
Overview
The claims and statistics of this paper haven’t been checked yet.
Free: it reads the open-access text and checks the first 5 claims that cite a source we can check. Create a free account to check every claim.
Integrity signals
Registry
Cites
Statistics
Figures


Verification
Claims the paper makes
The claims and statistics of this paper haven’t been checked yet.
Free: it reads the open-access text and checks the first 5 claims that cite a source we can check. Create a free account to check every claim.
Claims other papers make about this one
Each is checked against this paper’s own text: does it say what the citing paper says it does?
The check wasn’t confident either way, so it gives no verdict — never disputed.
In the citing paper
“Most (15/16) of nearby genes or 3D interaction genes were expressed in branchial arch and embryo ectoderm in mice [36,37].”
From Combined genome-wide association study of 136 quantitative ear morphology traits in multiple populations reveal 8 novel loci (2023) · cites this paper as [36]
Experimental — accuracy not yet measured
Self-check
Percentages, sums and reported differences re-computed from the paper’s own numbers.
The self-check needs the paper’s full text.
Citations
Cites
Mouse Genome Database (MGD)-2018: knowledgebase for the laboratory mouse
Smith, C. L., Blake, J. A., Kadin, J. A., Richardson, J. E., Bult, C. J., & the Mouse Genome Database Group (2018) · Nucleic Acids Research · doi:10.1093/nar/gkx1006 · Cited by 219
Self-citationSmith, C. L., & Eppig, J. T. (2012) · Mammalian Genome · doi:10.1007/s00335-012-9421-3 · Cited by 174 · cited 1×
“MGD, another important component of MGI, uses the Mammalian Phenotype (MP) Ontology to annotate phenotypic data (11).”
MethodSelf-citationUnification of multi-species vertebrate anatomy ontologies for comparative biology in Uberon
Haendel, M. A., Balhoff, J. P., Bastian, F. B., Blackburn, D. C., Blake, J. A., Bradford, Y., Comte, A., Dahdul, W. M., Dececchi, T. A., Druzinsky, R. E., et al. (2014) · Journal of Biomedical Semantics · doi:10.1186/2041-1480-5-21 · Cited by 164 · cited 1×
“The MP ontology incorporates equivalence axioms to anatomical concepts in the cross-species UBERON anatomy ontology (12), and UBERON includes cross-references to EMAPA.”
MethodSelf-citationA Database for Mouse Development
Ringwald, M., Baldock, R., Bard, J., Kaufman, M. H., Eppig, J. T., Richardson, J. E., Nadeau, J. H., & Davidson, D. R. (1994) · Science · doi:10.1126/science.8091224 · Cited by 110 · cited 1×
“Designed as an open-ended system that can integrate different types of expression data, GXD collects RNA and protein expression information from RNA in situ hybridization, immunohistochemistry, in situ reporter (knock in), RT-PCR, northern blot and western blot experiments (1,2).”
BackgroundSelf-citationThe mouse Gene Expression Database (GXD): 2017 update
Finger, J. H., Smith, C. M., Hayamizu, T. F., McCright, I. J., Xu, J., Law, M., Shaw, D. R., Baldarelli, R. M., Beal, J. S., Blodgett, O., et al. (2016) · Nucleic Acids Research · doi:10.1093/nar/gkw1073 · Cited by 76 · cited 2×
“Based on our previous work on Tissue-by-Gene expression matrix displays (8), we have developed an interactive matrix view that allows users to compare gene expression and phenotype data for a given gene (Figure 4).”
BackgroundMethodSelf-citationEMAP/EMAPA ontology of mouse developmental anatomy: 2013 update
Hayamizu, T. F., Wicks, M. N., Davidson, D. R., Burger, A., Ringwald, M., & Baldock, R. (2013) · Journal of Biomedical Semantics · doi:10.1186/2041-1480-4-15 · Cited by 51 · cited 1×
“GXD uses the Mouse Developmental Anatomy (EMAPA) Ontology to describe gene expression patterns (9,10).”
MethodSelf-citationMouse anatomy ontologies: enhancements and tools for exploring and integrating biomedical data
Hayamizu, T. F., Baldock, R., & Ringwald, M. (2015) · Mammalian Genome · doi:10.1007/s00335-015-9584-9 · Cited by 49 · cited 1×
“GXD uses the Mouse Developmental Anatomy (EMAPA) Ontology to describe gene expression patterns (9,10).”
MethodSelf-citationGXD: a Gene Expression Database for the laboratory mouse
Ringwald, M., Mangan, M. E., Eppig, J. T., Kadin, J. A., Richardson, J. E., & the Gene Expression Database Group (1999) · Nucleic Acids Research · doi:10.1093/nar/27.1.106 · Cited by 39
Self-citationGXD: a community resource of mouse Gene Expression Data
Smith, C. M., Finger, J. H., Hayamizu, T. F., McCright, I. J., Xu, J., Eppig, J. T., Kadin, J. A., Richardson, J. E., & Ringwald, M. (2015) · Mammalian Genome · doi:10.1007/s00335-015-9563-1 · Cited by 24
Self-citationSmith, C. M., Finger, J. H., Kadin, J. A., Richardson, J. E., & Ringwald, M. (2014) · Developmental Dynamics · doi:10.1002/dvdy.24155 · Cited by 20 · cited 1×
“GXD and its user interfaces have been described previously (6,7).”
MethodSelf-citation
Research works printed but not linked: 1
- Ringwald, 1999, The gene expression database group, Nucleic Acids Res., 27, 106
Cited by
Mouse Genome Database (MGD) 2019
Bult, C. J., Blake, J. A., Smith, C. L., Kadin, J. A., Richardson, J. E., the Mouse Genome Database Group, Anagnostopoulos, A., Asabor, R., Baldarelli, R. M., Beal, J. S., et al. (2019) · Nucleic Acids Research · doi:10.1093/nar/gky1056 · Cited by 686
Self-citationPadeken, J., Methot, S. P., & Gasser, S. M. (2022) · Nature Reviews Molecular Cell Biology · doi:10.1038/s41580-022-00483-w · Cited by 514
Mouse genome database (MGD): Knowledgebase for mouse-human comparative biology
Blake, J. A., Baldarelli, R., Kadin, J. A., Richardson, J. E., Smith, C. L., Bult, C. J., the Mouse Genome Database Group, Anagnostopoulos, A. V., Beal, J. S., Bello, S. M., et al. (2021) · Nucleic Acids Research · doi:10.1093/nar/gkaa1083 · Cited by 422
Self-citationMouse Genome Informatics: an integrated knowledgebase system for the laboratory mouse
Baldarelli, R. M., Smith, C. L., Ringwald, M., Richardson, J. E., Bult, C. J., Mouse Genome Informatics Group, Anagnostopoulos, A., Begley, D. A., Bello, S. M., Christie, K., et al. (2024) · GENETICS · doi:10.1093/genetics/iyae031 · Cited by 227
“It is composed of several interrelated resources, the core being the Mouse Genome Database (MGD) (Blake et al. 2021) and the Gene Expression Database (GXD) (Finger et al. 2017; Smith et al. 2019).”
BackgroundMethodSelf-citationThe Bgee suite: integrated curated expression atlas and comparative transcriptomics in animals
Bastian, F. B., Roux, J., Niknejad, A., Comte, A., Fonseca Costa, S. S., de Farias, T. M., Moretti, S., Parmentier, G., de Laval, V. R., Rosikiewicz, M., et al. (2021) · Nucleic Acids Research · doi:10.1093/nar/gkaa793 · Cited by 188
Metadata
- Authors
- Smith, C. M., Hayamizu, T. F., Finger, J. H., Bello, S. M., McCright, I. J., Xu, J., Baldarelli, R. M., Beal, J. S., Campbell, J., Corbani, L. E., Frost, P. J., Lewis, J. R., Giannatto, S. C., Miers, D., Shaw, D. R., Kadin, J. A., Richardson, J. E., Smith, C. L., & Ringwald, M.
- Affiliations
- Jackson Laboratory (US)
- Corresponding author
- Ringwald, Martin
- ORCID
- Venue
- Nucleic Acids Research
- Publisher
- Oxford University Press (OUP)
- Published
- 2018-10-17
- Volume
- 47
- Issue
- D1
- Pages
- D774-D779
- ISSN
- 0305-1048 (ISSN-L)
- 1362-4962
- PMC
- PMC6324054
- OpenAlex
- W2917411498
- Cited by
- 119
- References
- 15
- Citations by year
- 2026: 1 · 2025: 8 · 2024: 6 · 2023: 12 · 2022: 19 · 2021: 38 · 2020: 23 · 2019: 8 · 2018: 2
- FWCI
- 6.40
- Type
- journal article
- Language
- en
- Open access
- gold
- doi.org
- Licence
- Locations
- Nucleic Acids Research (publishedVersion, cc-by-nc)
- Europe PMC (PubMed Central) (publishedVersion, cc-by-nc)
- PubMed Central (publishedVersion, cc-by-nc)
- PubMed (publishedVersion)
- The Mouseion at the JAXlibrary (Jackson Laboratory) (submittedVersion, cc-by)
- Funders
- National Institutes of Health (HD062499)
- National Human Genome Research Institute (HG000330)
- Topics
- Health Sciences › Medicine › Health Informatics › Biomedical Text Mining and Ontologies
- Life Sciences › Biochemistry, Genetics and Molecular Biology › Molecular Biology › Bioinformatics and Genomic Networks
- Life Sciences › Biochemistry, Genetics and Molecular Biology › Molecular Biology › Developmental Biology and Gene Regulation
- Keywords
- gene expression data, mouse mutants, tissue-specific gene expression, differential gene expression, Mouse Genome Informatics, phenotype data
- MeSH terms
- Animals, User-Computer Interface, Genome, Internet, Databases, Genetic, Mice, Transcriptome
About these checks
Registry, retraction, Cites and statistics results are computed, not judged, with one exception: a printed reference that no index lists is read once by a model before it counts as a citation error. Claims are extracted by a model and kept only when their quote appears verbatim in the text; each cited source is then checked, with a model’s help, for whether it says what the claim relies on. Those verdicts can be wrong — read the claim’s quote and the cited source before relying on one.
Statistics and arithmetic are recomputed, not judged.
Confidence bands are shown only for fields calibrated on our annotated test set. None is calibrated yet, so no band is shown.
What counts as a claim ›How we measure confidence ›How we check this ›
Are you an author, or do you see a problem with this page? Request a review
How to cite
Cite CoChat for the checks on this page, and the paper for its own findings.
- This page
- CoChat. (2026). Citation check: The mouse Gene Expression Database (GXD): 2019 update. https://app.cochat.ai/papers/10.1093/nar/gky922
- The paper
- Smith, C. M., Hayamizu, T. F., Finger, J. H., Bello, S. M., McCright, I. J., Xu, J., Baldarelli, R. M., Beal, J. S., Campbell, J., Corbani, L. E., Frost, P. J., Lewis, J. R., Giannatto, S. C., Miers, D., Shaw, D. R., Kadin, J. A., Richardson, J. E., Smith, C. L., & Ringwald, M. (2019). The mouse Gene Expression Database (GXD): 2019 update. Nucleic Acids Research. https://doi.org/10.1093/nar/gky922
Data sources
Bibliographic data: Semantic Scholar, OpenAlex, Crossref.
Contains information from the Semantic Scholar Academic Graph Datasets, made available under the ODC Attribution License (ODC-BY 1.0).
Semantic Scholar’s data is described in: Kinney, R., et al. (2023). The Semantic Scholar Open Data Platform. arXiv:2301.10140.
