Cited by 37

The DOI matches its Crossref record; 7 of the 7 references it cites were found in a registry or an index.

CRISPR/Cas9-targeted removal of unwanted sequences from small-RNA sequencing libraries

Hardigan, Andrew A, Roberts, Brian S, Moore, Dianna E, Ramaker, Ryne C, Jones, Angela L, Myers, Richard M·2019·Nucleic Acids Research

Published version of a preprint

Abstract

In small RNA (smRNA) sequencing studies, highly abundant molecules such as adapter dimer products and tissue-specific microRNAs (miRNAs) inhibit accurate quantification of lowly expressed species. We previously developed a method to selectively deplete highly abundant miRNAs. However, this method does not deplete adapter dimer ligation products that, unless removed by gel-separation, comprise most of the library. Here, we have adapted and modified recently described methods for CRISPR/Cas9–based Depletion of Abundant Species by Hybridization (‘DASH’) to smRNA-seq, which we have termed miRNA and Adapter Dimer—DASH (MAD-DASH). In MAD-DASH, Cas9 is complexed with single guide RNAs (sgRNAs) targeting adapter dimer ligation products, alongside highly expressed tissue-specific smRNAs, for cleavage in vitro. This process dramatically reduces adapter dimer and targeted smRNA sequences, can be multiplexed, shows minimal off-target effects, improves the quantification of lowly expressed miRNAs from human plasma and tissue derived RNA, and obviates the need for gel-separation, greatly increasing sample throughput. Additionally, the method is fully customizable to other smRNA-seq preparation methods. Like depletion of ribosomal RNA for mRNA-seq and mitochondrial DNA for ATAC-seq, our method allows for greater proportional read-depth of non-targeted sequences.

Overview

The claims and statistics of this paper haven’t been checked yet.

Run the check — free, no account needed. It reads the open-access text and checks the sources it cites.

A few free checks a day · papers already verified open instantly · results are public

Integrity signals

Registry

Crossref · 10.1093/nar/gkz425

Cites

7 of 7 references verified0 citation errors · 0 not checkable

Statistics

Figures

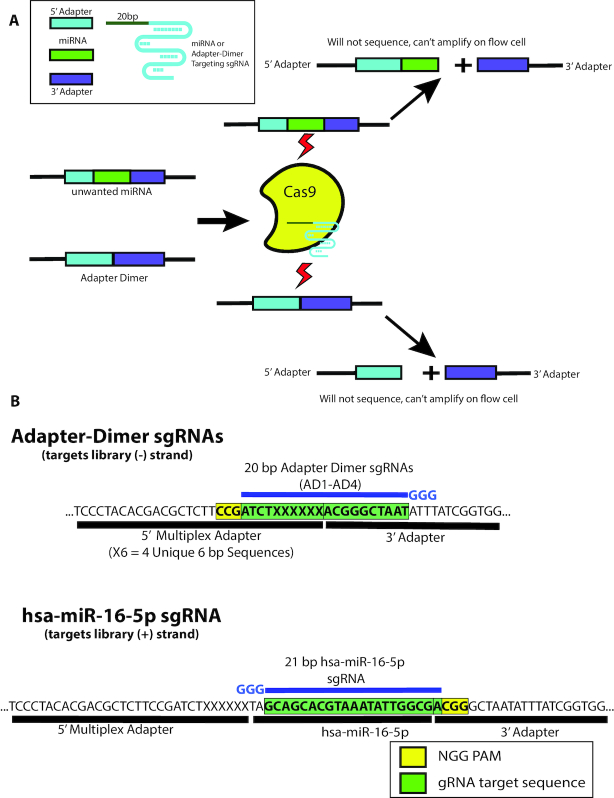
Figure 1. Depletion of adapter dimer and overabundant miRNAs with MAD-DASH. (A) MAD-DASH employs Cas9 and adapter dimer- or miRNA-specific sgRNAs to selectively deplete these sequences from final libraries. Cleaved sequences will not amplify during the second round of PCR amplification, and are also no longer suitable substrates for bridge amplification during Illumina sequencing (though they will still be able to bind to the flow-cell using the P5/P7 sequences remaining on each cleaved library). (B) Design of adapter dimer and hsa-miR-16–5p sgRNAs using available pre-existing PAM sites on our smRNA-seq 5′- and 3′-adapters. Adapter dimer targeting sgRNAs use a minus strand ‘NGG’ and have 10 bp of homology to both the 5′- and 3′ adapter, ensuring target cleavage specificity for adapter dimer sequences. hsa-miR-16–5p uses a 3′ PAM site one base away from the 3′—adapter ligation junction, which can be generalized to other smRNAs and provides highly specific targeting while minimizing off-targets. Shown are only the plus strand of non-PCR tailed sequences. Green boxes indicate the plus strand sequence corresponding to sgRNA location in the dsDNA library, while the yellow box indicates the plus strand location of the ‘NGG’ PAM in the dsDNA library. sgRNA location is depicted in blue along with the three 5′ ‘G’ nucleotides necessary for high levels of T7 in vitro transcription.
Figure 1. Depletion of adapter dimer and overabundant miRNAs with MAD-DASH. (A) MAD-DASH employs Cas9 and adapter dimer- or miRNA-specific sgRNAs to selectively deplete these sequences from final libraries. Cleaved sequences will not amplify during the second round of PCR amplification, and are also no longer suitable substrates for bridge amplification during Illumina sequencing (though they will still be able to bind to the flow-cell using the P5/P7 sequences remaining on each cleaved library). (B) Design of adapter dimer and hsa-miR-16–5p sgRNAs using available pre-existing PAM sites on our smRNA-seq 5′- and 3′-adapters. Adapter dimer targeting sgRNAs use a minus strand ‘NGG’ and have 10 bp of homology to both the 5′- and 3′ adapter, ensuring target cleavage specificity for adapter dimer sequences. hsa-miR-16–5p uses a 3′ PAM site one base away from the 3′—adapter ligation junction, which can be generalized to other smRNAs and provides highly specific targeting while minimizing off-targets. Shown are only the plus strand of non-PCR tailed sequences. Green boxes indicate the plus strand sequence corresponding to sgRNA location in the dsDNA library, while the yellow box indicates the plus strand location of the ‘NGG’ PAM in the dsDNA library. sgRNA location is depicted in blue along with the three 5′ ‘G’ nucleotides necessary for high levels of T7 in vitro transcription.CC BY-NC · PubMed Central
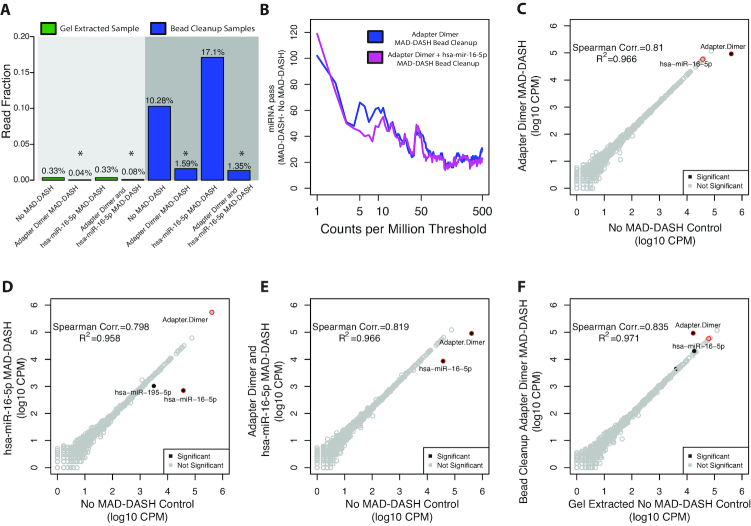
Figure 2. MAD-DASH smRNA-seq reduces adapter dimer and hsa-miR-16–5p in human brain total RNA samples. (A) Averaged read fraction of downsampled and CPM normalized adapter dimer sequences in gel extracted and bead cleanup samples. MAD-DASH in bead cleanup samples significantly depletes adapter dimer individually and in combination with depletion of hsa-miR-16–5p simultaneously. Asterisks indicate that a given read fraction was determined to be significantly altered compare to the respective cleanup's no MAD-DASH control using DESeq2 (FDR < 0.05). (B) Plot depicting the difference in the number of mature miRNA species reaching a specified count per million threshold between bead cleanup adapter dimer MAD-DASH smRNA-seq replicates and MAD-DASH control replicates. Downsampling and CPM normalization was performed as described in ‘Materials and Methods’ section. (C–F) Read counts from normalized replicate groups for bead cleanup treated versus control MAD-DASH samples targeting (C) adapter dimer (D) hsa-miR-16–5p and (E) adapter dimer and hsa-miR-16–5p (F) adapter dimer compared to gel extracted no-Cas9/sgRNA control. Significantly different sequences are filled black circles, with those having a log2-fold-change > 1 being labeled with text. Non-significantly different miRNAs are depicted as open gray circles. Adapter dimer and hsa-miR-16–5p are depicted as red circles with the same gray or black fill to denote significance. Significance was determined with DESeq2 and set as a Benjamini–Hochberg corrected P-value < 0.05.
Figure 2. MAD-DASH smRNA-seq reduces adapter dimer and hsa-miR-16–5p in human brain total RNA samples. (A) Averaged read fraction of downsampled and CPM normalized adapter dimer sequences in gel extracted and bead cleanup samples. MAD-DASH in bead cleanup samples significantly depletes adapter dimer individually and in combination with depletion of hsa-miR-16–5p simultaneously. Asterisks indicate that a given read fraction was determined to be significantly altered compare to the respective cleanup's no MAD-DASH control using DESeq2 (FDR < 0.05). (B) Plot depicting the difference in the number of mature miRNA species reaching a specified count per million threshold between bead cleanup adapter dimer MAD-DASH smRNA-seq replicates and MAD-DASH control replicates. Downsampling and CPM normalization was performed as described in ‘Materials and Methods’ section. (C–F) Read counts from normalized replicate groups for bead cleanup treated versus control MAD-DASH samples targeting (C) adapter dimer (D) hsa-miR-16–5p and (E) adapter dimer and hsa-miR-16–5p (F) adapter dimer compared to gel extracted no-Cas9/sgRNA control. Significantly different sequences are filled black circles, with those having a log2-fold-change > 1 being labeled with text. Non-significantly different miRNAs are depicted as open gray circles. Adapter dimer and hsa-miR-16–5p are depicted as red circles with the same gray or black fill to denote significance. Significance was determined with DESeq2 and set as a Benjamini–Hochberg corrected P-value < 0.05.CC BY-NC · PubMed Central
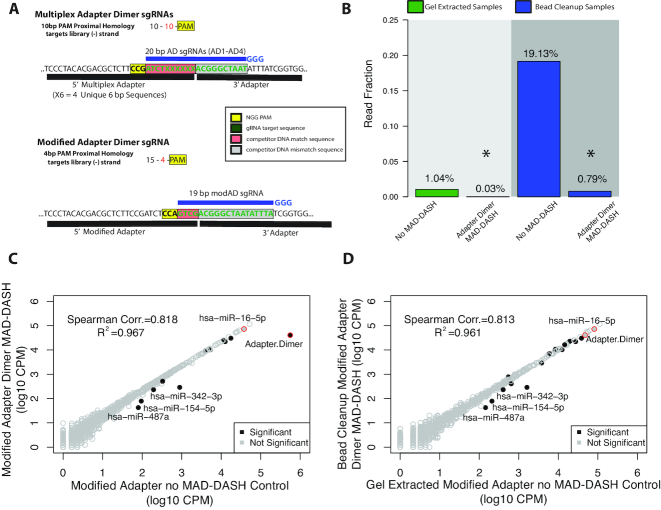
Figure 3. Rational design of a modified 5′ adapter with alternate PAM site enhances depletion of adapter dimer with MAD-DASH. (A) Design of the modified 5′ adapter compared to the multiplex 5′ adapter. Compared to the 10 bp competitor mismatch—10 bp competitor match—PAM design used in our first MAD-DASH iteration, the modified adapter uses 15 bp competitor mismatch—4 bp competitor match—PAM design and is predicted to have as much as 100-fold less binding to other non-target sequences in the library. Shown are the plus strands of non-PCR tailed sequences. Red boxes indicate the plus strand sequence corresponding to competitor match sequence in the dsDNA library, while the gray box indicates the sequence corresponding to sequence that drives adapter dimer target specificity, i.e. competitor mismatch sequence. The yellow box indicates the plus strand location of the ‘NGG’ PAM in the dsDNA library. sgRNA location is depicted in blue along with the three 5′ ‘G’ nucleotides necessary for high levels of T7 in vitro transcription. (B) MAD-DASH smRNA-seq using the modified 5′ adapter demonstrates substantially greater depletion of adapter dimer in bead cleanup samples than when using the multiplex adapter, and achieves a lower average read fraction than in modified adapter MAD-DASH control gel extraction samples. Normalized read fraction of downsampled and CPM normalized adapter dimer sequences for both adapter strategies are depicted. Reductions of adapter dimer in both gel extracted and bead cleanup samples were significant (DESeq2 adjusted P-value < 0.05). (C and D) Read counts from normalized replicate treated vs control groups prepared using the modified 5′ adapter. Bead cleanup MAD-DASH samples depleted of (C) modified adapter dimer and (D) bead cleanup modified adapter dimer compared to gel extracted no-Cas9/sgRNA modified adapter control are shown. Significantly different sequences are filled black circles, with those having a log2-fold-change > 1 being labeled with text. Non-significantly different miRNAs are depicted as open gray circles. Adapter dimer and hsa-miR-16–5p are depicted as red circles with the same grey or black fill to denote significance. Significance was determined with DESeq2 and set as a Benjamini–Hochberg corrected P-value < 0.05
Figure 3. Rational design of a modified 5′ adapter with alternate PAM site enhances depletion of adapter dimer with MAD-DASH. (A) Design of the modified 5′ adapter compared to the multiplex 5′ adapter. Compared to the 10 bp competitor mismatch—10 bp competitor match—PAM design used in our first MAD-DASH iteration, the modified adapter uses 15 bp competitor mismatch—4 bp competitor match—PAM design and is predicted to have as much as 100-fold less binding to other non-target sequences in the library. Shown are the plus strands of non-PCR tailed sequences. Red boxes indicate the plus strand sequence corresponding to competitor match sequence in the dsDNA library, while the gray box indicates the sequence corresponding to sequence that drives adapter dimer target specificity, i.e. competitor mismatch sequence. The yellow box indicates the plus strand location of the ‘NGG’ PAM in the dsDNA library. sgRNA location is depicted in blue along with the three 5′ ‘G’ nucleotides necessary for high levels of T7 in vitro transcription. (B) MAD-DASH smRNA-seq using the modified 5′ adapter demonstrates substantially greater depletion of adapter dimer in bead cleanup samples than when using the multiplex adapter, and achieves a lower average read fraction than in modified adapter MAD-DASH control gel extraction samples. Normalized read fraction of downsampled and CPM normalized adapter dimer sequences for both adapter strategies are depicted. Reductions of adapter dimer in both gel extracted and bead cleanup samples were significant (DESeq2 adjusted P-value < 0.05). (C and D) Read counts from normalized replicate treated vs control groups prepared using the modified 5′ adapter. Bead cleanup MAD-DASH samples depleted of (C) modified adapter dimer and (D) bead cleanup modified adapter dimer compared to gel extracted no-Cas9/sgRNA modified adapter control are shown. Significantly different sequences are filled black circles, with those having a log2-fold-change > 1 being labeled with text. Non-significantly different miRNAs are depicted as open gray circles. Adapter dimer and hsa-miR-16–5p are depicted as red circles with the same grey or black fill to denote significance. Significance was determined with DESeq2 and set as a Benjamini–Hochberg corrected P-value < 0.05CC BY-NC · PubMed Central
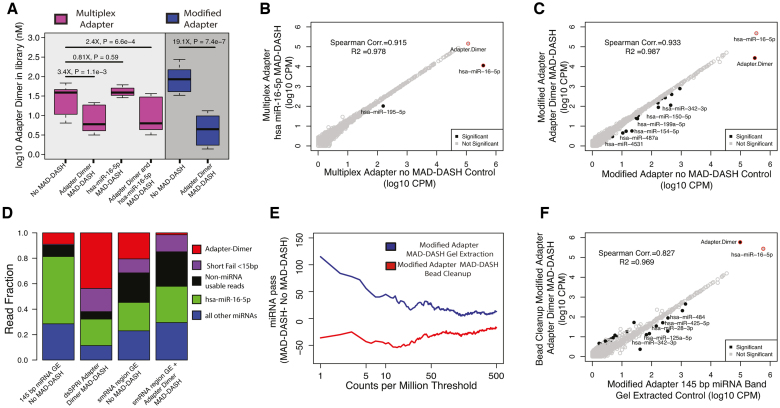
Figure 4. MAD-DASH smRNA-seq reduces adapter dimer and hsa-miR-16–5p in human plasma samples. (A) Adapter dimer concentrations in control or treated MAD-DASH smRNA-seq replicates (n = 3 in each group) made using the multiplex 5′ adapter (magenta) or the modified 5′ adapter (blue) were determined using qPCR and a synthetic adapter dimer library standard. Multiplex adapter sample concentration were adjusted 4× to account for the three other equimolar multiplex adapters. (B andC) Sequencing read counts from gel extracted, normalized replicate groups are plotted for treated vs control MAD-DASH samples using either (B) multiplex adapters and targeting hsa-miR-16–5p, or using (C) modified adapter and targeting adapter dimer. hsa-miR-16–5p depletion would not expected to vary between multiplex versus modified adapter use due to an identical sgRNA/PAM location. Adapter dimer depletion depicted in (C) represents a depletion of residual adapter dimer remaining after gel extraction, indicating that modified adapter dimer MAD-DASH can yield significant library improvements even when using traditional library cleanup methods. As in previous figures, significantly different sequences are filled black circles, with those having a log2-fold-change > 1 being labeled with text. Non-significantly different miRNAs are depicted as open gray circles. Adapter dimer and hsa-miR-16–5p are depicted as red circles with the same grey or black fill to denote significance. Significance was determined with DESeq2 and set as a Benjamini–Hochberg corrected P-value < 0.05. (D) Averaged read fraction of downsampled and CPM normalized adapter dimer sequences, hsa-miR-16–5p, non-hsa-miR-16–5p miRNAs and non-miRNA usable reads (see ‘Materials and Methods’ section) in modified adapter control miRNA band gel extracted (abbreviated as GE) samples, bead cleanup adapter dimer MAD-DASH samples and control and adapter dimer MAD-DASH smRNA region GE samples (E) Plot depicting the difference in the number of mature miRNA species reaching a specified count per million threshold between gel extracted or bead cleanup MAD-DASH plasma samples targeting adapter dimer. Downsampling and CPM normalization was performed as described in ‘Materials and Methods’ section. (F) Sequencing read counts from normalized replicate groups are plotted for bead cleanup adapter dimer MAD-DASH versus miRNA band gel control extracted samples. Significantly different sequences are filled black circles, with those having a log2-fold-change > 1 and a base mean of 100 being labeled with text to prevent overlapping labels of more lowly abundant significant sequences. Non-significantly different miRNAs are depicted as open gray circles. Adapter dimer and hsa-miR-16–5p are depicted as red circles with the same gray or black fill to denote significance. Significance was determined with DESeq2 and set as a Benjamini–Hochberg corrected P-value < 0.05.
Figure 4. MAD-DASH smRNA-seq reduces adapter dimer and hsa-miR-16–5p in human plasma samples. (A) Adapter dimer concentrations in control or treated MAD-DASH smRNA-seq replicates (n = 3 in each group) made using the multiplex 5′ adapter (magenta) or the modified 5′ adapter (blue) were determined using qPCR and a synthetic adapter dimer library standard. Multiplex adapter sample concentration were adjusted 4× to account for the three other equimolar multiplex adapters. (B andC) Sequencing read counts from gel extracted, normalized replicate groups are plotted for treated vs control MAD-DASH samples using either (B) multiplex adapters and targeting hsa-miR-16–5p, or using (C) modified adapter and targeting adapter dimer. hsa-miR-16–5p depletion would not expected to vary between multiplex versus modified adapter use due to an identical sgRNA/PAM location. Adapter dimer depletion depicted in (C) represents a depletion of residual adapter dimer remaining after gel extraction, indicating that modified adapter dimer MAD-DASH can yield significant library improvements even when using traditional library cleanup methods. As in previous figures, significantly different sequences are filled black circles, with those having a log2-fold-change > 1 being labeled with text. Non-significantly different miRNAs are depicted as open gray circles. Adapter dimer and hsa-miR-16–5p are depicted as red circles with the same grey or black fill to denote significance. Significance was determined with DESeq2 and set as a Benjamini–Hochberg corrected P-value < 0.05. (D) Averaged read fraction of downsampled and CPM normalized adapter dimer sequences, hsa-miR-16–5p, non-hsa-miR-16–5p miRNAs and non-miRNA usable reads (see ‘Materials and Methods’ section) in modified adapter control miRNA band gel extracted (abbreviated as GE) samples, bead cleanup adapter dimer MAD-DASH samples and control and adapter dimer MAD-DASH smRNA region GE samples (E) Plot depicting the difference in the number of mature miRNA species reaching a specified count per million threshold between gel extracted or bead cleanup MAD-DASH plasma samples targeting adapter dimer. Downsampling and CPM normalization was performed as described in ‘Materials and Methods’ section. (F) Sequencing read counts from normalized replicate groups are plotted for bead cleanup adapter dimer MAD-DASH versus miRNA band gel control extracted samples. Significantly different sequences are filled black circles, with those having a log2-fold-change > 1 and a base mean of 100 being labeled with text to prevent overlapping labels of more lowly abundant significant sequences. Non-significantly different miRNAs are depicted as open gray circles. Adapter dimer and hsa-miR-16–5p are depicted as red circles with the same gray or black fill to denote significance. Significance was determined with DESeq2 and set as a Benjamini–Hochberg corrected P-value < 0.05.CC BY-NC · PubMed Central
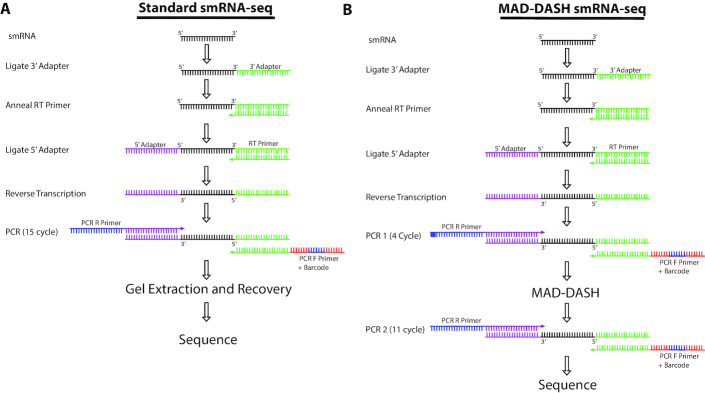
Figure 5. Illustration of MAD-DASH and standard smRNA-seq workflows. While MAD-DASH involves an extra PCR amplification in addition to the MAD-DASH CRISPR/Cas9 in vitro digestion, the extra ∼3 h to accomplish this relative to finishing the PCR in our standard protocol are more than offset by no longer needing to perform gel extraction, DNA recovery and library concentration. For nearly a hundred samples, we estimate that researcher time for smRNA-seq library construction can be reduced to only 1 day using MAD-DASH smRNA-seq and that this throughput can be further improved with greater protocol familiarity or automation.
Figure 5. Illustration of MAD-DASH and standard smRNA-seq workflows. While MAD-DASH involves an extra PCR amplification in addition to the MAD-DASH CRISPR/Cas9 in vitro digestion, the extra ∼3 h to accomplish this relative to finishing the PCR in our standard protocol are more than offset by no longer needing to perform gel extraction, DNA recovery and library concentration. For nearly a hundred samples, we estimate that researcher time for smRNA-seq library construction can be reduced to only 1 day using MAD-DASH smRNA-seq and that this throughput can be further improved with greater protocol familiarity or automation.CC BY-NC · PubMed Central

Verification

Claims the paper makes

The claims and statistics of this paper haven’t been checked yet.

Run the check — free, no account needed. It reads the open-access text and checks the sources it cites.

A few free checks a day · papers already verified open instantly · results are public

Claims other papers make about this one

Each is checked against this paper’s own text: does it say what the citing paper says it does?

Self-check

Percentages, sums and reported differences re-computed from the paper’s own numbers.

The self-check needs the paper’s full text.

Citations

Cites

Show all 7 references

Research works printed but not linked: 49

  1. Liu, 2010, Biochemical principles of small RNA pathways, Annu. Rev. Biochem., 79, 295, 10.1146/annurev.biochem.052208.151733 · DOI
  2. Malone, 2009, Small RNAs as guardians of the genome, Cell, 136, 656, 10.1016/j.cell.2009.01.045 · DOI
  3. Zhao, 2007, Dysregulation of cardiogenesis, cardiac conduction, and cell cycle in mice lacking miRNA-1-2, Cell, 129, 303, 10.1016/j.cell.2007.03.030 · DOI
  4. Gao, 2014, Ago2 facilitates Rad51 recruitment and DNA double-strand break repair by homologous recombination, Cell Res., 24, 532, 10.1038/cr.2014.36 · DOI
  5. Michalik, 2012, A small RNA response at DNA ends in Drosophila, Nucleic Acids Res., 40, 9596, 10.1093/nar/gks711 · DOI
  6. Di Leva, 2014, MicroRNAs in cancer, Annu. Rev. Pathol., 9, 287, 10.1146/annurev-pathol-012513-104715 · DOI
  7. O’Connell, 2012, microRNA regulation of inflammatory responses, Annu. Rev. Immunol., 30, 295, 10.1146/annurev-immunol-020711-075013 · DOI · Paper page
  8. Suzuki, 2012, PIWI expression and function in cancer, Front. Genet., 3, 1, 10.3389/fgene.2012.00204 · DOI
  9. Calin, 2006, MicroRNA signatures in human cancers, Nat. Rev. Cancer, 6, 857, 10.1038/nrc1997 · DOI
  10. Bang, 2014, Cardiac fibroblast-derived microRNA passenger strand-enriched exosomes mediate cardiomyocyte hypertrophy, J. Clin. Invest., 124, 2136, 10.1172/JCI70577 · DOI
  11. Rajasethupathy, 2012, A role for neuronal piRNAs in the epigenetic control of memory-related synaptic plasticity, Cell, 149, 693, 10.1016/j.cell.2012.02.057 · DOI
  12. Vigneault, 2012, High-throughput multiplex sequencing of miRNA, Curr. Protoc. Hum. Genet., 10.1002/0471142905.hg1112s73 · DOI
  13. Alon, 2011, Barcoding bias in high-throughput multiplex sequencing of miRNA, Genome Res., 21, 1506, 10.1101/gr.121715.111 · DOI
  14. Vigneault, 2008, Efficient microRNA capture and bar-coding via enzymatic oligonucleotide adenylation, Nat. Methods, 5, 777, 10.1038/nmeth.1244 · DOI
  15. Hafner, 2011, RNA-ligase-dependent biases in miRNA representation in deep-sequenced small RNA cDNA libraries, RNA, 17, 1697, 10.1261/rna.2799511 · DOI · Paper page
  16. Fuchs, 2015, Bias in ligation-based small RNA sequencing library construction is determined by adaptor and RNA structure, PLoS One, 10, 1, 10.1371/journal.pone.0126049 · DOI
  17. Xu, 2015, An improved protocol for small RNA library construction using High Definition adapters, Methods Next Gen. Seq., 2, 1
  18. Zhuang, 2012, Structural bias in T4 RNA ligase-mediated 3′-adapter ligation, Nucleic Acids Res., 40, e54, 10.1093/nar/gkr1263 · DOI
  19. Jayaprakash, 2011, Identification and remediation of biases in the activity of RNA ligases in small-RNA deep sequencing, Nucleic Acids Res., 39, 1, 10.1093/nar/gkr693 · DOI
  20. Sorefan, 2012, Reducing ligation bias of small RNAs in libraries for next generation sequencing, Silence, 3, 4, 10.1186/1758-907X-3-4 · DOI
  21. Giraldez, 2018, Comprehensive multi-center assessment of small RNA-seq methods for quantitative miRNA profiling, Nat. Biotechnol., 36, 746, 10.1038/nbt.4183 · DOI · Paper page
  22. Roberts, 2015, Blocking of targeted microRNAs from next-generation sequencing libraries, Nucleic Acids Res., 43, 1
  23. Wickersheim, 2013, Terminator oligo blocking efficiently eliminates rRNA from Drosophila small RNA sequencing libraries, Biotechniques, 55, 269, 10.2144/000114102 · DOI · Paper page
  24. Kawano, 2010, Reduction of non-insert sequence reads by dimer eliminator LNA oligonucleotide for small RNA deep sequencing, Biotechniques, 49, 751, 10.2144/000113516 · DOI
  25. Dard-Dascot, 2018, Systematic comparison of small RNA library preparation protocols for next-generation sequencing, BMC Genomics, 19, 1, 10.1186/s12864-018-4491-6 · DOI
  26. Shore, 2016, Small RNA library preparation method for next-generation sequencing using chemical modifications to prevent adapter dimer formation, PLoS One, 11, e0167009, 10.1371/journal.pone.0167009 · DOI
  27. Jinek, 2012, A programmable dual-RNA-guided DNA endonuclease in adaptive bacterial immunity, Science, 337, 816, 10.1126/science.1225829 · DOI · Paper page
  28. Cong, 2013, Multiplex genome engineering using CRISPR/Cas systems, Science, 339, 819, 10.1126/science.1231143 · DOI · Paper page
  29. Platt, 2014, CRISPR-Cas9 knockin mice for genome editing and cancer modeling, Cell, 159, 440, 10.1016/j.cell.2014.09.014 · DOI · Paper page
  30. Shalem, 2013, Genome-scale CRISPR-Cas9 knockout screening in human cells, Science, 343, 84, 10.1126/science.1247005 · DOI · Paper page
  31. Bennett-Baker, 2017, CRISPR-mediated isolation of specific megabase segments of genomic DNA, Nucleic Acids Res., 45, e165, 10.1093/nar/gkx749 · DOI
  32. Lee, 2015, Highly efficient CRISPR/Cas9-mediated TAR cloning of genes and chromosomal loci from complex genomes in yeast, Nucleic Acids Res., 43, 1, 10.1093/nar/gkv112 · DOI
  33. Gu, 2016, Depletion of Abundant Sequences by Hybridization (DASH): Using Cas9 to remove unwanted high-abundance species in sequencing libraries and molecular counting applications, Genome Biol., 17, 41, 10.1186/s13059-016-0904-5 · DOI
  34. Wu, 2016, The landscape of accessible chromatin in mammalian preimplantation embryos, Nature, 534, 652, 10.1038/nature18606 · DOI
  35. Montefiori, 2017, Reducing mitochondrial reads in ATAC-seq using CRISPR/Cas9, Sci. Rep., 7, 1, 10.1038/s41598-017-02547-w · DOI · Paper page
  36. Gagnon, 2014, Efficient mutagenesis by Cas9 protein-mediated oligonucleotide insertion and large-scale assessment of single-guide RNAs, PLoS One, 9, 5, 10.1371/journal.pone.0098186 · DOI
  37. Martin, 2011, Cutadapt removes adapter sequences from high-throughput sequencing reads, EMBnet.J., 17, 10, 10.14806/ej.17.1.200 · DOI · Paper page
  38. Kozomara, 2014, MiRBase: annotating high confidence microRNAs using deep sequencing data, Nucleic Acids Res., 42, 68, 10.1093/nar/gkt1181 · DOI · Paper page
  39. Langmead, 2012, Fast gapped-read alignment with Bowtie 2, Nat. Methods, 9, 357, 10.1038/nmeth.1923 · DOI · Paper page
  40. Quinlan, 2010, BEDTools: A flexible suite of utilities for comparing genomic features, Bioinformatics, 26, 841, 10.1093/bioinformatics/btq033 · DOI · Paper page
  41. Love, 2014, Moderated estimation of fold change and dispersion for RNA-seq data with DESeq2, Genome Biol., 15, 1, 10.1186/s13059-014-0550-8 · DOI · Paper page
  42. Ma, 2015, Single-stranded DNA cleavage by divergent CRISPR-Cas9 enzymes, Mol. Cell, 60, 398, 10.1016/j.molcel.2015.10.030 · DOI
  43. Sternberg, 2014, DNA interrogation by the CRISPR RNA-guided endonuclease Cas9, Nature, 507, 62, 10.1038/nature13011 · DOI · Paper page
  44. Sternberg, 2015, Conformational control of DNA target cleavage by CRISPR-Cas9, Nature, 527, 110, 10.1038/nature15544 · DOI · Paper page
  45. Boyle, 2017, High-throughput biochemical profiling reveals sequence determinants of dCas9 off-target binding and unbinding, Proc. Natl. Acad. Sci. U.S.A., 114, 5461, 10.1073/pnas.1700557114 · DOI
  46. Roberts, 2018, Discovery and validation of circulating biomarkers of colorectal adenoma by high-depth small RNA sequencing, Clin. Cancer Res., 24, 2092, 10.1158/1078-0432.CCR-17-1960 · DOI
  47. Lin, 2014, CRISPR/Cas9 systems have off-target activity with insertions or deletions between target DNA and guide RNA sequences, Nucleic Acids Res., 42, 7473, 10.1093/nar/gku402 · DOI · Paper page
  48. Gootenberg, 2018, Multiplexed and portable nucleic acid detection platform with Cas13, Cas12a, and Csm6, Science, 360, 439, 10.1126/science.aaq0179 · DOI
  49. Chen, 2018, CRISPR-Cas12a target binding unleashes indiscriminate single-stranded DNase activity, Science, 6245, 1

Cited by

Sorted by citations

Metadata

Authors
Hardigan, A. A., Roberts, B. S., Moore, D. E., Ramaker, R. C., Jones, A. L., & Myers, R. M.
Affiliations
HudsonAlpha Institute for Biotechnology, Huntsville, AL 35806, USA
Venue
Nucleic Acids Research
Published
2019-06-05
Volume
47
Issue
14
Pages
e84-e84
ISSN
  • 0305-1048
  • 1362-4962
Cited by
37
References
7
Language
en
Funders
  • University of Alabama at Birmingham (TR0001417)
  • UAB Medical Scientist Training Program (5T32GM008361)

About these checks

Registry, retraction, Cites and statistics results are computed, not judged, with one exception: a printed reference that no index lists is read once by a model before it counts as a citation error. Claims are extracted by a model and kept only when their quote appears verbatim in the text; each cited source is then checked, with a model’s help, for whether it says what the claim relies on. Those verdicts can be wrong — read the claim’s quote and the cited source before relying on one.

Statistics and arithmetic are recomputed, not judged.

Confidence bands are shown only for fields calibrated on our annotated test set. None is calibrated yet, so no band is shown.

What counts as a claim ›How we measure confidence ›How we check this ›

Are you an author, or do you see a problem with this page? Request a review