

The DOI matches its Crossref record; 6 of the 6 references it cites were found in a registry or an index.
Expression Atlas update: from tissues to single cells
Abstract
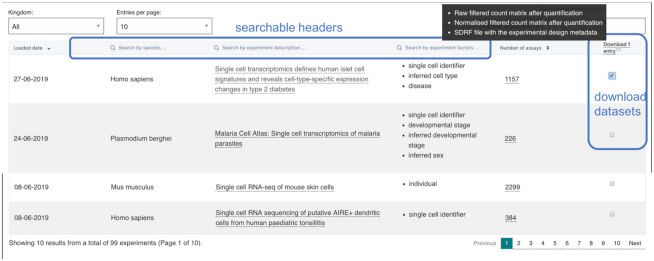
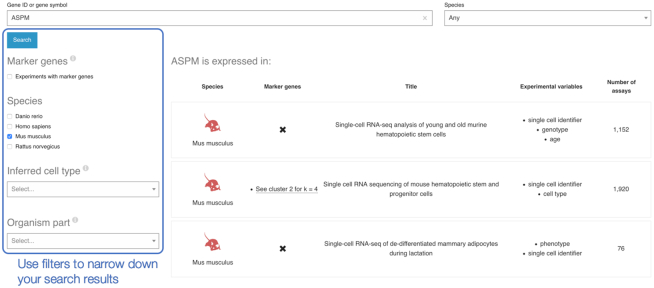
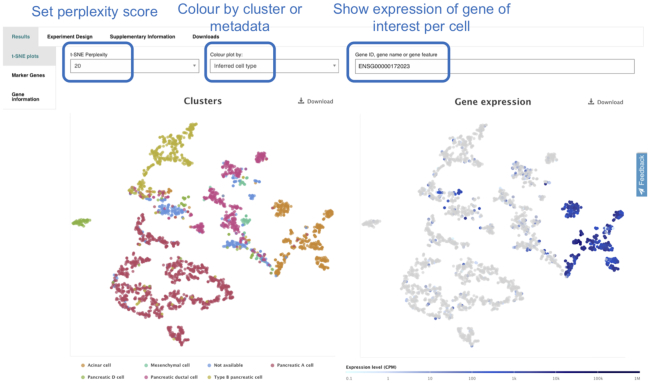
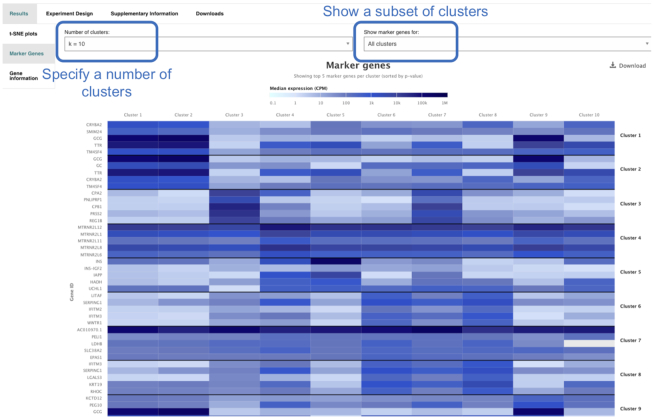
Expression Atlas is EMBL-EBI’s resource for gene and protein expression. It sources and compiles data on the abundance and localisation of RNA and proteins in various biological systems and contexts and provides open access to this data for the research community. With the increased availability of single cell RNA-Seq datasets in the public archives, we have now extended Expression Atlas with a new added-value service to display gene expression in single cells. Single Cell Expression Atlas was launched in 2018 and currently includes 123 single cell RNA-Seq studies from 12 species. The website can be searched by genes within or across species to reveal experiments, tissues and cell types where this gene is expressed or under which conditions it is a marker gene. Within each study, cells can be visualized using a pre-calculated t-SNE plot and can be coloured by different features or by cell clusters based on gene expression. Within each experiment, there are links to downloadable files, such as RNA quantification matrices, clustering results, reports on protocols and associated metadata, such as assigned cell types.
Overview
The claims and statistics of this paper haven’t been checked yet.
Run the check — free, no account needed. It reads the open-access text and checks the sources it cites.
Integrity signals
Registry
Cites
Statistics
Figures
Verification
Claims the paper makes
The claims and statistics of this paper haven’t been checked yet.
Run the check — free, no account needed. It reads the open-access text and checks the sources it cites.
Claims other papers make about this one
Each is checked against this paper’s own text: does it say what the citing paper says it does?
The check wasn’t confident either way, so it gives no verdict — never disputed.
In the citing paper
“Existing work had to restrict their models to a small list of selected genes.”
From Large-scale foundation model on single-cell transcriptomics (2024) · cites this paper as [8]
Experimental — accuracy not yet measured
Self-check
Percentages, sums and reported differences re-computed from the paper’s own numbers.
The self-check needs the paper’s full text.
Citations
Cites
Near-optimal probabilistic RNA-seq quantification
Bray, N. L., Pimentel, H., Melsted, P., & Pachter, L. (2016) · Nature Biotechnology · doi:10.1038/nbt.3519 · Cited by 9,723
SCANPY: large-scale single-cell gene expression data analysis
Wolf, F. A., Angerer, P., & Theis, F. J. (2018) · Genome Biology · doi:10.1186/s13059-017-1382-0 · Cited by 8,881
Massively parallel digital transcriptional profiling of single cells
Zheng, G. X. Y., Terry, J. M., Belgrader, P., Ryvkin, P., Bent, Z. W., Wilson, R., Ziraldo, S. B., Wheeler, T. D., McDermott, G. P., Zhu, J., et al. (2017) · Nature Communications · doi:10.1038/ncomms14049 · Cited by 7,353
The Genotype-Tissue Expression (GTEx) pilot analysis: Multitissue gene regulation in humans
The GTEx Consortium, Ardlie, K. G., Deluca, D. S., Segrè, A. V., Sullivan, T. J., Young, T. R., Gelfand, E. T., Trowbridge, C. A., Maller, J. B., Tukiainen, T., et al. (2015) · Science · doi:10.1126/science.1262110 · Cited by 5,062
The Galaxy platform for accessible, reproducible and collaborative biomedical analyses: 2018 update
Afgan, E., Baker, D., Batut, B., van den Beek, M., Bouvier, D., Čech, M., Chilton, J., Clements, D., Coraor, N., Grüning, B. A., et al. (2018) · Nucleic Acids Research · doi:10.1093/nar/gky379 · Cited by 3,662
Smart-seq2 for sensitive full-length transcriptome profiling in single cells
Picelli, S., Björklund, Å. K., Faridani, O. R., Sagasser, S., Winberg, G., & Sandberg, R. (2013) · Nature Methods · doi:10.1038/nmeth.2639 · Cited by 2,358
Research works printed but not linked: 16
- Kapushesky, 2010, Gene expression atlas at the european bioinformatics institute, Nucleic Acids Res., 38, D690, 10.1093/nar/gkp936 · DOI
- Athar, 2019, ArrayExpress update—from bulk to single-cell expression data, Nucleic Acids Res., 47, D711, 10.1093/nar/gky964 · DOI
- Barrett, 2013, NCBI GEO: archive for functional genomics data sets–update, Nucleic Acids Res., 41, D991, 10.1093/nar/gks1193 · DOI · Paper page
- Toribio, 2017, European Nucleotide Archive in 2016, Nucleic Acids Res., 45, D32, 10.1093/nar/gkw1106 · DOI
- Tello-Ruiz, 2017, Gramene 2018: unifying comparative genomics and pathway resources for plant research, Nucleic Acids Res., 46, D1181, 10.1093/nar/gkx1111 · DOI
- Perez-Riverol, 2019, The PRIDE database and related tools and resources in 2019: improving support for quantification data, Nucleic Acids Res., 47, D442, 10.1093/nar/gky1106 · DOI
- Carvalho-Silva, 2019, Open Targets Platform: new developments and updates two years on, Nucleic Acids Res., 47, D1056, 10.1093/nar/gky1133 · DOI
- Fabregat, 2018, The reactome pathway knowledgebase, Nucleic Acids Res., 46, D649, 10.1093/nar/gkx1132 · DOI
- Papatheodorou, 2018, Expression Atlas: gene and protein expression across multiple studies and organisms, Nucleic Acids Res., 46, D246, 10.1093/nar/gkx1158 · DOI
- Di Tommaso, 2017, Nextflow enables reproducible computational workflows, Nat. Biotechnol., 35, 316, 10.1038/nbt.3820 · DOI · Paper page
- Macosco, 2015, Highly parallel genome-wide expression profiling of individual cells using nanoliter droplets, Cell, 161, 1187
- Srivastava, 2019, Alevin efficiently estimates accurate gene abundances from dscRNA-seq data, Genome Biol., 20, 65, 10.1186/s13059-019-1670-y · DOI
- Lun, 2019, EmptyDrops: distinguishing cells from empty droplets in droplet-based single-cell RNA sequencing data, Genome Biol., 20, 63, 10.1186/s13059-019-1662-y · DOI
- Gruning, 2018, Bioconda: sustainable and comprehensive software distribution for the life sciences, Nat. Methods, 15, 475, 10.1038/s41592-018-0046-7 · DOI
- Malone, 2010, Modeling sample variables with an Experimental Factor Ontology, Bioinformatics, 26, 1112, 10.1093/bioinformatics/btq099 · DOI
- Cheng, 2017, Araport11: a complete reannotation of the Arabidopsis thaliana reference genome, Plant J., 89, 789, 10.1111/tpj.13415 · DOI
Cited by
Sorted by citations
The PRIDE database resources in 2022: a hub for mass spectrometry-based proteomics evidences
Perez-Riverol, Y., Bai, J., Bandla, C., García-Seisdedos, D., Hewapathirana, S., Kamatchinathan, S., Kundu, D. J., Prakash, A., Frericks-Zipper, A., Eisenacher, M., et al. (2022) · Nucleic Acids Research · doi:10.1093/nar/gkab1038 · Cited by 6,125
Self-citationLarge-scale foundation model on single-cell transcriptomics
Hao, M., Gong, J., Zeng, X., Liu, C., Guo, Y., Cheng, X., Wang, T., Ma, J., Zhang, X., & Song, L. (2024) · Nature Methods · doi:10.1038/s41592-024-02305-7 · Cited by 628
“The ablation studies (Supplementary Note 1) of taking downsampling strategy (Supplementary Table 8) and regression loss (Supplementary Fig.”
InfluentialTCRD and pharos 2021: mining the human proteome for disease biology
Sheils, T. K., Mathias, S. L., Kelleher, K. J., Siramshetty, V. B., Nguyen, D.-T., Bologa, C. G., Jensen, L. J., Vidović, D., Koleti, A., Schürer, S. C., et al. (2021) · Nucleic Acids Research · doi:10.1093/nar/gkaa993 · Cited by 160
Yang, X., Liu, G., Feng, G., Bu, D., Wang, P., Jiang, J., Chen, S., Yang, Q., Zhang, Y., Man, Z., et al. (2023) · doi:10.1101/2023.09.26.559542 · Cited by 148
miRNATissueAtlas2: an update to the human miRNA tissue atlas
Keller, A., Gröger, L., Tschernig, T., Solomon, J., Laham, O., Schaum, N., Wagner, V., Kern, F., Schmartz, G. P., Li, Y., et al. (2022) · Nucleic Acids Research · doi:10.1093/nar/gkab808 · Cited by 143
Large Scale Foundation Model on Single-cell Transcriptomics
Hao, M., Gong, J., Zeng, X., Liu, C., Guo, Y., Cheng, X., Wang, T., Ma, J., Song, L., & Zhang, X. (2023) · doi:10.1101/2023.05.29.542705 · Cited by 639
The lncRNA Toolkit: Databases and In Silico Tools for lncRNA Analysis
Pinkney, H. R., Wright, B. M., & Diermeier, S. D. (2020) · Non-Coding RNA · doi:10.3390/ncrna6040049 · Cited by 56
Vision-related convergent gene losses reveal SERPINE3’s unknown role in the eye
Indrischek, H., Hammer, J., Machate, A., Hecker, N., Kirilenko, B., Roscito, J., Hans, S., Norden, C., Brand, M., & Hiller, M. (2022) · eLife · doi:10.7554/elife.77999 · Cited by 21
Metadata
- Authors
- Papatheodorou, I., Moreno, P., Manning, J., Fuentes, A. M.-P., George, N., Fexova, S., Fonseca, N. A., Füllgrabe, A., Green, M., Huang, N., Huerta, L., Iqbal, H., Jianu, M., Mohammed, S., Zhao, L., Jarnuczak, A. F., Jupp, S., Marioni, J., Meyer, K., Petryszak, R., Prada Medina, C. A., Talavera-López, C., Teichmann, S., Vizcaino, J. A., & Brazma, A.
- Affiliations
- European Molecular Biology Laboratory, European Bioinformatics Institute, EMBL-EBI, Hinxton, UK
- Wellcome Sanger Institute, Wellcome Genome Campus, Hinxton CB10 1SA, UK
- Venue
- Nucleic Acids Research
- Publisher
- Oxford University Press (OUP)
- Published
- 2019-10-30
- ISSN
- 0305-1048
- 1362-4962
- PMC
- PMC7145605
- Cited by
- 224
- References
- 6
- Language
- en
- Funders
- European Molecular Biology Laboratory
- Wellcome Trust (108437/Z/15/Z, 208391/Z/17/Z)
- National Science Foundation (NSF IOS #1127112)
- BBSRC (BB/P027849/1)
About these checks
Registry, retraction, Cites and statistics results are computed, not judged, with one exception: a printed reference that no index lists is read once by a model before it counts as a citation error. Claims are extracted by a model and kept only when their quote appears verbatim in the text; each cited source is then checked, with a model’s help, for whether it says what the claim relies on. Those verdicts can be wrong — read the claim’s quote and the cited source before relying on one.
Statistics and arithmetic are recomputed, not judged.
Confidence bands are shown only for fields calibrated on our annotated test set. None is calibrated yet, so no band is shown.
What counts as a claim ›How we measure confidence ›How we check this ›
Are you an author, or do you see a problem with this page? Request a review
