

The DOI matches its Crossref record; 45 of the 47 references it cites were found in a registry or an index.
Comparison of Hepatic 2D Sandwich Cultures and 3D Spheroids for Long-term Toxicity Applications: A Multicenter Study
Open accessAbstract
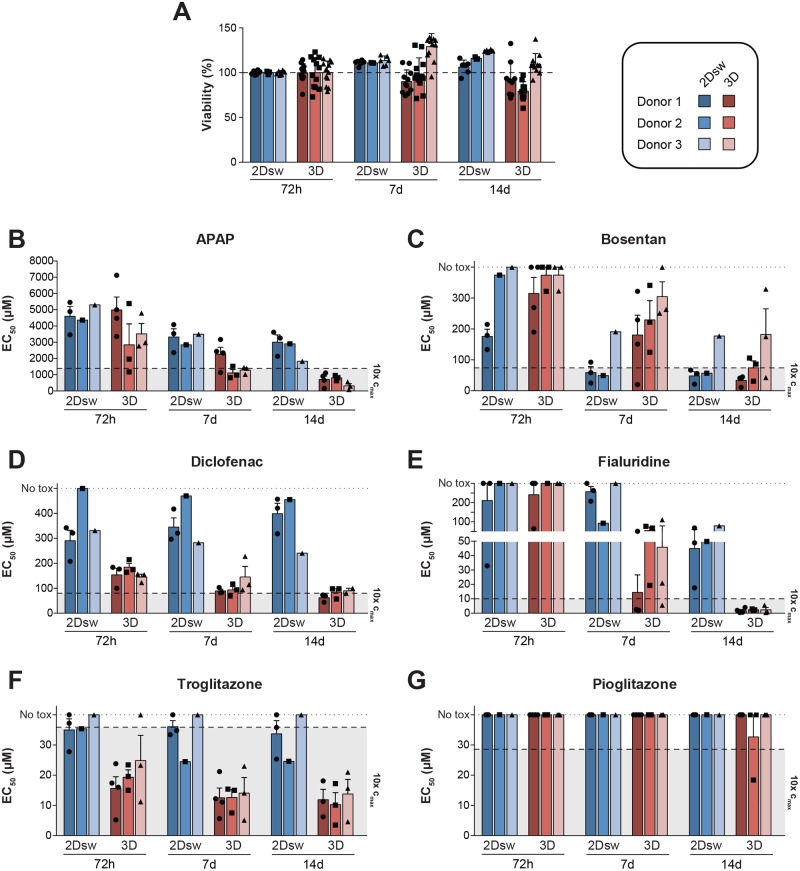
Primary human hepatocytes (PHHs) are commonly used for in vitro studies of drug-induced liver injury. However, when cultured as 2D monolayers, PHH lose crucial hepatic functions within hours. This dedifferentiation can be ameliorated when PHHs are cultured in sandwich configuration (2Dsw), particularly when cultures are regularly re-overlaid with extracellular matrix, or as 3D spheroids. In this study, the 6 participating laboratories evaluated the robustness of these 2 model systems made from cryopreserved PHH from the same donors considering both inter-donor and inter-laboratory variability and compared their suitability for use in repeated-dose toxicity studies using 5 different hepatotoxins with different toxicity mechanisms. We found that expression levels of proteins involved in drug absorption, distribution, metabolism, and excretion, as well as catalytic activities of 5 different CYPs, were significantly higher in 3D spheroid cultures, potentially affecting the exposure of the cells to drugs and their metabolites. Furthermore, global proteomic analyses revealed that PHH in 3D spheroid configuration were temporally stable whereas proteomes from the same donors in 2Dsw cultures showed substantial alterations in protein expression patterns over the 14 days in culture. Overall, spheroid cultures were more sensitive to the hepatotoxic compounds investigated, particularly upon long-term exposures, across testing sites with little inter-laboratory or inter-donor variability. The data presented here suggest that repeated-dosing regimens improve the predictivity of in vitro toxicity assays, and that PHH spheroids provide a sensitive and robust system for long-term mechanistic studies of drug-induced hepatotoxicity, whereas the 2Dsw system has a more dedifferentiated phenotype and lower sensitivity to detect hepatotoxicity.
Overview
The claims and statistics of this paper haven’t been checked yet.
Run the check — free, no account needed. It reads the open-access text and checks the sources it cites.
Integrity signals
Registry
Cites
Statistics
Figures
Verification
Claims the paper makes
The claims and statistics of this paper haven’t been checked yet.
Run the check — free, no account needed. It reads the open-access text and checks the sources it cites.
Claims other papers make about this one
Each is checked against this paper’s own text: does it say what the citing paper says it does?
The source backs part of the claim, not all of it — or backs it for a different population, condition or comparison.
In the citing paper
“Multiple comparative studies indicate that spheroid cultures sustain elevated liver-specific functions, such as albumin secretion, urea production, and drug-metabolizing enzyme activity, while simultaneously demonstrating enhanced sensitivity to hepatotoxic compounds and a longer lifespan [26,27].”
From The Hepatocyte Expansion Paradox: A Review of In Vitro Challenges and Advances (2026) · cites this paper as [27]
Experimental — accuracy not yet measured
Self-check
Percentages, sums and reported differences re-computed from the paper’s own numbers.
The self-check needs the paper’s full text.
Citations
Cites
Pharmacogenomics: Translating Functional Genomics into Rational Therapeutics
Evans, W. E., & Relling, M. V. (1999) · Science · doi:10.1126/science.286.5439.487 · Cited by 2,491
Concordance of the toxicity of pharmaceuticals in humans and in animals
Olson, H., Betton, G., Robinson, D., Thomas, K., Monro, A., Kolaja, G., Lilly, P., Sanders, J., Sipes, G., Bracken, W., et al. (2000) · Regulatory Toxicology and Pharmacology · doi:10.1006/rtph.2000.1399 · Cited by 2,050
WEB-based GEne SeT AnaLysis Toolkit (WebGestalt): update 2013
Wang, J., Duncan, D. T., Shi, Z., & Zhang, B. (2013) · Nucleic Acids Research · doi:10.1093/nar/gkt439 · Cited by 1,512
Martignoni, M., Groothuis, G. M. M., & de Kanter, R. (2006) · Expert Opinion on Drug Metabolism & Toxicology · doi:10.1517/17425255.2.6.875 · Cited by 1,478
Lessons learned from the fate of AstraZeneca's drug pipeline: a five-dimensional framework
Cook, D., Brown, D., Alexander, R., March, R., Morgan, P., Satterthwaite, G., & Pangalos, M. N. (2014) · Nature Reviews Drug Discovery · doi:10.1038/nrd4309 · Cited by 1,344
Bell, C. C., Hendriks, D. F. G., Moro, S. M. L., Ellis, E., Walsh, J., Renblom, A., Fredriksson Puigvert, L., Dankers, A. C. A., Jacobs, F., Snoeys, J., et al. (2016) · Scientific Reports · doi:10.1038/srep25187 · Cited by 739
Self-citationOnakpoya, I., Heneghan, C. J., & Aronson, J. K. (2016) · BMC Medicine · doi:10.1186/s12916-016-0553-2 · Cited by 617
Zhou, Y., Ingelman‐Sundberg, M., & Lauschke, V. M. (2017) · Clinical Pharmacology & Therapeutics · doi:10.1002/cpt.690 · Cited by 613
Self-citationIn vitro models for liver toxicity testing
Soldatow, V. Y., LeCluyse, E. L., Griffith, L. G., & Rusyn, I. (2012) · Toxicology Research · doi:10.1039/c2tx20051a · Cited by 482
Managing the challenge of chemically reactive metabolites in drug development
Park, B. K., Boobis, A. R., Clarke, S. E., Goldring, C. E., Jones, D., Kenna, J. G., Lambert, C., Laverty, H., Naisbitt, D. J., Nelson, S. D., et al. (2011) · Nature Reviews Drug Discovery · doi:10.1038/nrd3408 · Cited by 466
Self-citation
Cited by
Sorted by citations
Weaver, R. J., Blomme, E. A. G., Chadwick, A. E., Copple, I. M., Gerets, H. H. J., Goldring, C. E., Guillouzo, A., Hewitt, P. G., Ingelman‐Sundberg, M., Jensen, K. G., et al. (2019) · Nature Reviews Drug Discovery · doi:10.1038/s41573-019-0048-x · Cited by 261
Self-citationEngineering Multi‐Cellular Spheroids for Tissue Engineering and Regenerative Medicine
Kim, S., Kim, E. M., Yamamoto, M., Park, H., & Shin, H. (2020) · Advanced Healthcare Materials · doi:10.1002/adhm.202000608 · Cited by 241
3D cell culture models: Drug pharmacokinetics, safety assessment, and regulatory consideration
Wang, H., Brown, P. C., Chow, E. C. Y., Ewart, L. C., Ferguson, S., Fitzpatrick, S., Freedman, B., Guo, G. L., Hedrich, W. D., Heyward, S. A., et al. (2021) · Clinical and Translational Science · doi:10.1111/cts.13066 · Cited by 232
A 3D microfluidic liver model for high throughput compound toxicity screening in the OrganoPlate®
Bircsak, K. M., DeBiasio, R., Miedel, M. T., Alsebahi, A., Reddinger, R. M., Saleh, A. D., Shun, T., Vernetti, L. A., & Gough, A. (2021) · Toxicology · doi:10.1016/j.tox.2020.152667 · Cited by 198
Vorrink, S. U., Zhou, Y., Ingelman-Sundberg, M., & Lauschke, V. M. (2018) · Toxicological Sciences · doi:10.1093/toxsci/kfy058 · Cited by 187
Self-citation
Metadata
- Authors
- Bell, C. C., Dankers, A. C. A., Lauschke, V. M., Sison-Young, R., Jenkins, R., Rowe, C., Goldring, C. E., Park, K., Regan, S. L., Walker, T., Schofield, C., Baze, A., Foster, A. J., Williams, D. P., van de Ven, A. W. M., Jacobs, F., Houdt, J. V., Lähteenmäki, T., Snoeys, J., Juhila, S., Richert, L., & Ingelman-Sundberg, M.
- Affiliations
- Karolinska Institutet (SE)
- Janssen (Belgium) (BE)
- University of Liverpool (GB)
- MRC Centre for Drug Safety Science, Department of Molecular and Clinical Pharmacology, University of Liverpool, Liverpool, UK
- AstraZeneca (United Kingdom) (GB)
- GlaxoSmithKline (United Kingdom) (GB)
- GlaxoSmithKline Research & Development Limited (United Kingdom) (GB)
- KaLy Cell, Plobsheim, France
- Orion Corporation (Finland) (FI)
- Université Bourgogne Franche-Comté (FR)
- Department of Physiology and Pharmacology, Section of Pharmacogenetics, Karolinska Institutet, Stockholm, Sweden
- ORCID
- Venue
- Toxicological Sciences
- Publisher
- Oxford University Press (OUP)
- Published
- 2018-01-10
- Volume
- 162
- Issue
- 2
- Pages
- 655-666
- ISSN
- 1096-0929 (ISSN-L)
- 1096-6080
- PMC
- PMC5888952
- OpenAlex
- W2782718389
- Cited by
- 327
- References
- 47
- Citations by year
- 2026: 40 · 2025: 38 · 2024: 28 · 2023: 31 · 2022: 39 · 2021: 60 · 2020: 47 · 2019: 28 · 2018: 16
- FWCI
- 41.55
- Type
- journal article
- Language
- en
- Open access
- hybrid
- doi.org
- Licence
- cc-by-nc
- Locations
- Toxicological Sciences (publishedVersion, cc-by-nc)
- Europe PMC (PubMed Central) (publishedVersion, cc-by-nc)
- PubMed Central (publishedVersion, cc-by-nc)
- PubMed (publishedVersion)
- Funders
- AstraZeneca
- Vetenskapsrådet (2015-02760, 2016-06222, 01154, 2016-01154, 2016-01153)
- Medical Research Council (MR/L006758/1)
- Topics
- Life Sciences › Pharmacology, Toxicology and Pharmaceutics › Pharmacology › Drug-Induced Hepatotoxicity and Protection
- Health Sciences › Veterinary › Small Animals › Animal testing and alternatives
- Health Sciences › Medicine › Hepatology › Liver physiology and pathology
- Keywords
- primary human hepatocytes, multicellular spheroids, drug-induced liver injury, hepatotoxicity, repeated-dose toxicity, hepatocyte dedifferentiation, cryopreserved hepatocytes, inter-laboratory variability, donor variability, cytochrome P450 expression
- MeSH terms
- Cell Survival, Cells, Cultured, Cytochrome P-450 Enzyme System, Dose-Response Relationship, Drug, Pharmaceutical Preparations, Humans, Male, Middle Aged, Models, Biological, Predictive Value of Tests, Time Factors, Cryopreservation, Toxicity Tests, Spheroids, Cellular, Coculture Techniques, Hepatocytes, Chemical and Drug Induced Liver Injury, Primary Cell Culture
About these checks
Registry, retraction, Cites and statistics results are computed, not judged, with one exception: a printed reference that no index lists is read once by a model before it counts as a citation error. Claims are extracted by a model and kept only when their quote appears verbatim in the text; each cited source is then checked, with a model’s help, for whether it says what the claim relies on. Those verdicts can be wrong — read the claim’s quote and the cited source before relying on one.
Statistics and arithmetic are recomputed, not judged.
Confidence bands are shown only for fields calibrated on our annotated test set. None is calibrated yet, so no band is shown.
What counts as a claim ›How we measure confidence ›How we check this ›
Are you an author, or do you see a problem with this page? Request a review
