

The DOI matches its Crossref record; 9 of the 9 references it cites were found in a registry or an index.
Are we truly special and unique? A replication of Goldenberg et al. (2001)
Abstract
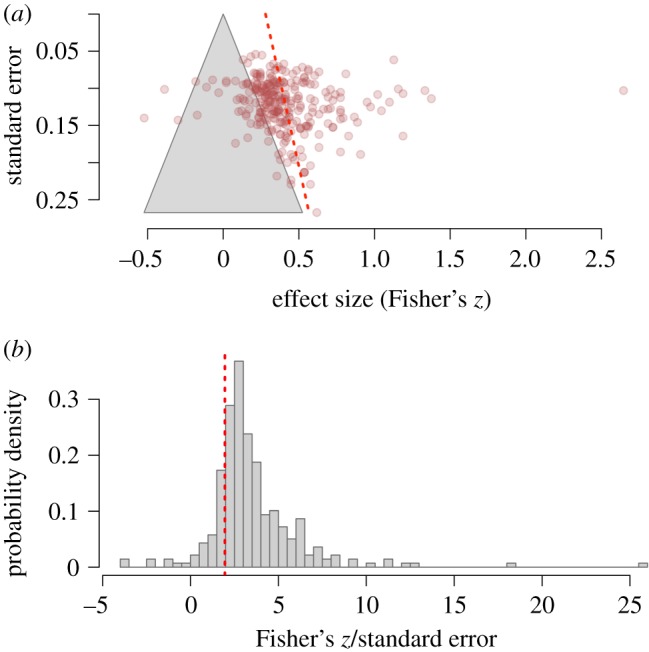
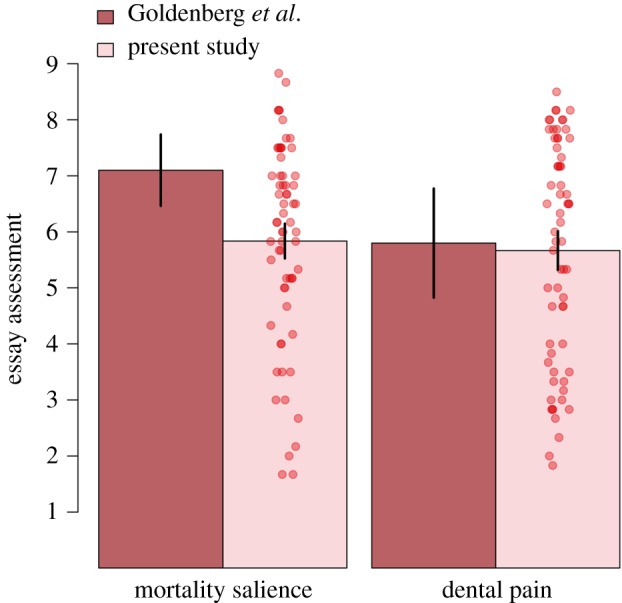
According to the mortality salience hypothesis of terror management theory, reminders of our future death increase the necessity to validate our cultural worldview and to enhance our self-esteem. In Experiment 2 of the study ‘I am not an animal: Mortality salience, disgust, and the denial of human creatureliness’, Goldenberg et al. (Goldenberg et al. 2001 J. Exp. Psychol. Gen. 130 , 427–435. ( doi:10.1037/0096-3445.130.3.427 )) observed that participants primed with questions about their death provided more positive evaluations to an essay describing humans as distinct from animals than control participants presented with questions regarding another aversive situation. In a replication of this experiment conducted with 128 volunteers, we did not observe evidence for a mortality salience effect.
Overview
The claims and statistics of this paper haven’t been checked yet.
Run the check — free, no account needed. It reads the open-access text and checks the sources it cites.
Integrity signals
Registry
Cites
Statistics
Figures
Verification
Claims the paper makes
The claims and statistics of this paper haven’t been checked yet.
Run the check — free, no account needed. It reads the open-access text and checks the sources it cites.
Claims other papers make about this one
Each is checked against this paper’s own text: does it say what the citing paper says it does?
In the citing paper
“Rodríguez-Ferreiro et al. (2019; 64 participants per cell) failed to replicate a study by Goldenberg et al. (2001; 10 participants per cell) testing the idea that participants under MS should react with more positive evaluations of an essay describing humans as distinct from animals.”
From Do Salient Social Norms Moderate Mortality Salience Effects? A (Challenging) Meta-Analysis of Terror Management Studies (2023) · cites this paper as Rodríguez-Ferreiro et al., 2019
Self-check
Percentages, sums and reported differences re-computed from the paper’s own numbers.
The self-check needs the paper’s full text.
Citations
Cites
The Causes and Consequences of a Need for Self-Esteem: A Terror Management Theory
Greenberg, J., Pyszczynski, T., & Solomon, S. (1986) · Public Self and Private Self · doi:10.1007/978-1-4613-9564-5_10 · Cited by 2,326
Using Bayes to get the most out of non-significant results
Dienes, Z. (2014) · Frontiers in Psychology · doi:10.3389/fpsyg.2014.00781 · Cited by 1,998
Greenberg, J., Solomon, S., & Pyszczynski, T. (1997) · Advances in Experimental Social Psychology · doi:10.1016/s0065-2601(08)60016-7 · Cited by 1,505
Two Decades of Terror Management Theory: A Meta-Analysis of Mortality Salience Research
Burke, B. L., Martens, A., & Faucher, E. H. (2010) · Personality and Social Psychology Review · doi:10.1177/1088868309352321 · Cited by 1,188
Greenberg, J., Simon, L., Pyszczynski, T., Solomon, S., & Chatel, D. (1992) · Journal of Personality and Social Psychology · doi:10.1037/0022-3514.63.2.212 · Cited by 487 · cited 1×
“[4,7]), tend to give a larger amount of hot sauce to a person who disagrees with their worldview [8], evaluate more positively an essay that presents humans as unique and different from other animals [9], and report a stronger desire for offspring [10].”
McGregor, H. A., Lieberman, J. D., Greenberg, J., Solomon, S., Arndt, J., Simon, L., & Pyszczynski, T. (1998) · Journal of Personality and Social Psychology · doi:10.1037/0022-3514.74.3.590 · Cited by 403
Contextual sensitivity in scientific reproducibility
Van Bavel, J. J., Mende-Siedlecki, P., Brady, W. J., & Reinero, D. A. (2016) · Proceedings of the National Academy of Sciences · doi:10.1073/pnas.1521897113 · Cited by 398
Greenberg, J., Vail, K., & Pyszczynski, T. (2014) · Advances in Motivation Science · doi:10.1016/bs.adms.2014.08.003 · Cited by 109
Researcher Effects on Mortality Salience Research: A Meta-Analytic Moderator Analysis
Yen, C.-L., & Cheng, C.-P. (2013) · Death Studies · doi:10.1080/07481187.2012.682290 · Cited by 30
Research works printed but not linked: 22
- Greenberg J, 1997, Advances in experimental social psychology, 61
- 10.1037/0022-3514.57.4.681 · DOI · Paper page
- 10.1177/0146167200261009 · DOI · Paper page
- 10.1037/0022-3514.67.4.627 · DOI · Paper page
- 10.1037/0096-3445.130.3.427 · DOI · Paper page
- 10.1037/0022-3514.89.1.46 · DOI · Paper page
- 10.1007/BF02294384 · DOI
- 10.1136/bmj.d4002 · DOI · Paper page
- Greenberg J, 2014, Advances in motivation science, 85
- 10.3758/BRM.41.4.1149 · DOI · Paper page
- 10.1515/9781400876136 · DOI · Paper page
- 10.1017/S1138741600006727 · DOI
- Eysenck HJ, 1992, EPQ: cuestionario de personalidad para niños (EPQ-J) y adultos (EPQ-A): manual
- 10.1111/j.1471-6402.1998.tb00181.x · DOI
- 10.1207/s15327752jpa4802_12 · DOI · Paper page
- 10.1371/journal.pone.0203358 · DOI
- 10.1037/0022-3514.54.6.1063 · DOI · Paper page
- Sandín B, 1999, Escalas PANAS de afecto positivo y negativo: Validación factorial y convergencia transcultural, Psicothema, 11, 37
- Sandín B, 2008, El estrés psicosocial: Conceptos y consecuencias clínicas, 275
- 10.1037/a0036731 · DOI
- 10.1177/1745691613513470 · DOI · Paper page
- 10.1037/xge0000527 · DOI
Cited by
Sorted by citations
Defending one's worldview under mortality salience: Testing the validity of an established idea
Schindler, S., Reinhardt, N., & Reinhard, M.-A. (2021) · Journal of Experimental Social Psychology · doi:10.1016/j.jesp.2020.104087 · Cited by 40
Mortality salience effects fail to replicate in traditional and novel measures
Sætrevik, B., & Sjåstad, H. (2022) · Meta-Psychology · doi:10.15626/mp.2020.2628 · Cited by 35
Schindler, S., Hilgard, J., Fritsche, I., Burke, B., & Pfattheicher, S. (2023) · Personality and Social Psychology Review · doi:10.1177/10888683221107267 · Cited by 43
“…through meta-analysis and inspection for publication bias seems advisable, given the lack of preregistered replication attempts on this idea and given that recent replication attempts of other MS findings have not been uniformly successful (Rodríguez-Ferreiro et al., 2019; Schindler et al., 2021).”
BackgroundInfluentialQi, J. (2023) · Personality and Social Psychology Bulletin · doi:10.1177/01461672221081270 · Cited by 10
Chen, L., Benjamin, R., Guo, Y., Lai, A., & Heine, S. J. (2023) · Research Square · doi:10.21203/rs.3.rs-1254756/v1 · Cited by 5
Arendsen, J. L., Brugman, B. C., van Koningsbruggen, G. M., & Fransen, M. L. (2025) · International Journal of Consumer Studies · doi:10.1111/ijcs.70056 · Cited by 4
“Furthermore, multiple other studies also failed to replicate findings of MS effects on a variety of worldview-confirming and - opposing essays (Rodríguez-Ferreiro et al. 2019; Sætrevik and Sjåstad 2022; Schindler et al. 2021; Treger et al. 2023).”
Existential threat and responses to emotional displays of ingroup and outgroup members
Wessler, J., van der Schalk, J., Hansen, J., Klackl, J., Jonas, E., Fons, M., Doosje, B., & Fischer, A. (2023) · Group Processes & Intergroup Relations · doi:10.1177/13684302221128229 · Cited by 3
“An important area for future research is to directly or conceptually replicate these findings, especially in light of current failure to replicate classical terror management findings (Klein et al., 2019; Rodríguez-Ferreiro et al., 2019).”
Background
Metadata
- Authors
- Rodríguez-Ferreiro, J., Barberia, I., González-Guerra, J., & Vadillo, M. A.
- Affiliations
- Departament de Cognició, Desenvolupament i Psicologia de l'Educació, Universitat de Barcelona, Barcelona, Spain
- Departamento de Psicología Básica, Universidad Autónoma de Madrid, Madrid, Spain
- ORCID
- Vadillo, Miguel A.
- Venue
- Royal Society Open Science
- Publisher
- The Royal Society
- Published
- 2019-11
- Volume
- 6
- Issue
- 11
- Pages
- 191114
- ISSN
- 2054-5703
- PMC
- PMC6894591
- Cited by
- 19
- References
- 9
- Language
- en
- Funders
- Ministerio de Ciencia, Innovación y Universidades (PSI2016-75776-R, PSI2016-80061-R, PSI2017-85159-P)
- Consejería de Educación, Juventud y Deporte, Comunidad de Madrid (2016-T1/SOC-1395)
About these checks
Registry, retraction, Cites and statistics results are computed, not judged, with one exception: a printed reference that no index lists is read once by a model before it counts as a citation error. Claims are extracted by a model and kept only when their quote appears verbatim in the text; each cited source is then checked, with a model’s help, for whether it says what the claim relies on. Those verdicts can be wrong — read the claim’s quote and the cited source before relying on one.
Statistics and arithmetic are recomputed, not judged.
Confidence bands are shown only for fields calibrated on our annotated test set. None is calibrated yet, so no band is shown.
What counts as a claim ›How we measure confidence ›How we check this ›
Are you an author, or do you see a problem with this page? Request a review
