PreprintCited by 8Bioinformatics and Genomic NetworksGene Regulatory Network AnalysisFungal and yeast genetics research

The DOI matches its Crossref record; 2 of the 2 references it cites were found in a registry or an index.

A trans-omics comparison reveals common gene expression strategies in four model organisms and exposes similarities and differences between them

Open access
Forés-Martos, Jaume, Forte, Anabel, García-Martínez, José, Pérez-Ortín, José E.·2020·Cells

Preprint — published as 10.3390/cells10020334 · Paper page

Abstract

The ultimate goal of gene regulation should focus on the protein level. However, as mRNA is an obligate intermediary, and because the amounts of mRNAs and proteins are controlled by their synthesis and degradation rates, the cellular amount of a given protein can be attained following different strategies. By studying omics datasets for six expression variables (mRNA and protein amounts, plus their synthesis and decay rates), we previously demonstrated the existence of common expression strategies (CES) for functionally-related genes in the yeast Saccharomyces cerevisiae . Here we extend that study to two other eukaryotes: the distantly related yeast Schizosaccharomyces pombe and cultured human HeLa cells. We also use genomic datasets from the model prokaryote Escherichia coli as an external reference. We show that CES are also present in all the studied organisms and the differences in them between organisms can be used to establish their phylogenetic relationships. The phenogram based on 6VP has the expected topology for the phylogeny of these four organisms, but shows interesting branch length differences to DNA sequence-based trees. The analysis of the correlations among the six variables supports that most gene expression control occurs in actively growing organisms at the transcription rate level, and that translation plays a minor role in it. We propose that all living cells use CES for the genes acting on the same physiological pathways, especially for those belonging to stable macromolecular complexes, but CES have been modeled by evolution to adapt to the specific life circumstances of each organism. The obtained phenograms may reflect both evolutionary constraints in expression strategies, and lifestyle convergences.

Overview

The claims and statistics of this paper haven’t been checked yet.

Run the check — free, no account needed. It reads the open-access text and checks the sources it cites.

A few free checks a day · papers already verified open instantly · results are public

Integrity signals

Registry

Crossref · 10.1101/2020.09.04.283143

Cites

2 of 2 references verified0 citation errors · 0 not checkable

Statistics

Figures

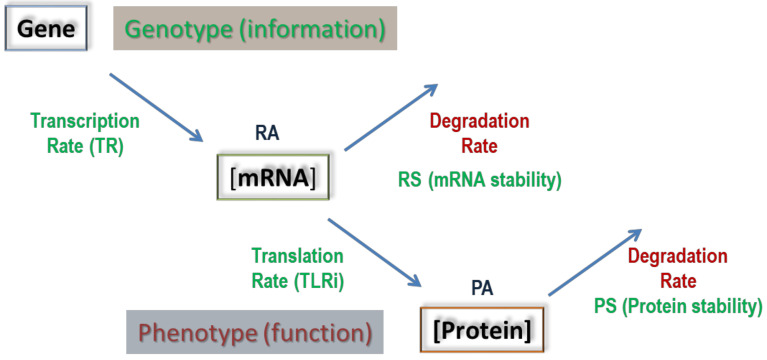
Figure 1 The six variables of the gene expression flux. The genetic information (genes = genotype) is transcribed to mRNAs, of which the concentration (RA), under steady-state conditions, depends on the equilibrium between synthesis (TR) and the degradation rates (herein expressed as the reverse parameter, mRNA stability: RS). The phenotype is, however, dependent mainly on the protein concentration (PA), which, in turn, depends on their synthesis (TLRi) and degradation rates (or stabilities, PS). See the main text for additional explanations.
Figure 1 The six variables of the gene expression flux. The genetic information (genes = genotype) is transcribed to mRNAs, of which the concentration (RA), under steady-state conditions, depends on the equilibrium between synthesis (TR) and the degradation rates (herein expressed as the reverse parameter, mRNA stability: RS). The phenotype is, however, dependent mainly on the protein concentration (PA), which, in turn, depends on their synthesis (TLRi) and degradation rates (or stabilities, PS). See the main text for additional explanations.CC BY · PubMed Central
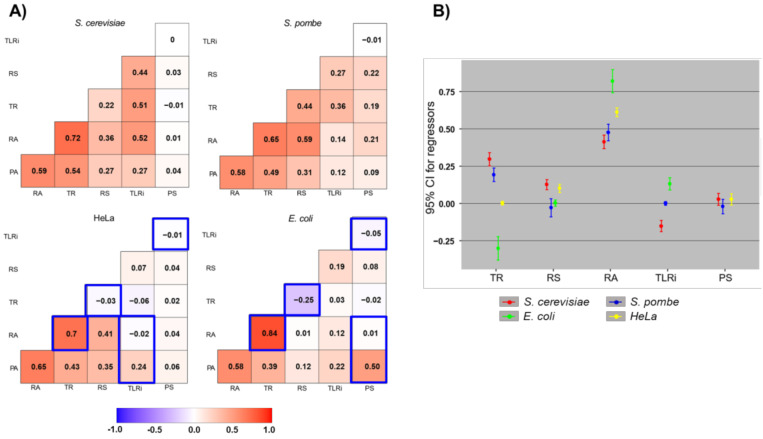
Figure 2 Correlations between the six variables of the gene expression in four model organisms. (A) The pairwise Pearson’s correlations among the six variables in each organism. Exact values are indicated in frames. The background color scale indicates positive (red) or negative (blue) correlations. Some correlations are less reliable because they are between the variables calculated from some others in HeLa and E. coli (see the main text) and are marked with blue boxes. (B) Estimation of the coefficients of a multiple regression model per organism using Bayesian model averaging (posterior mean and 95% credible interval). These coefficients show the contribution of each variable across organisms to the final protein amount (PA) using a Z-score scale to make them comparable. The TLRi for HeLa and the PS for E. coli are not shown because they were mathematically calculated from PA values (see Materials and Methods).
Figure 2 Correlations between the six variables of the gene expression in four model organisms. (A) The pairwise Pearson’s correlations among the six variables in each organism. Exact values are indicated in frames. The background color scale indicates positive (red) or negative (blue) correlations. Some correlations are less reliable because they are between the variables calculated from some others in HeLa and E. coli (see the main text) and are marked with blue boxes. (B) Estimation of the coefficients of a multiple regression model per organism using Bayesian model averaging (posterior mean and 95% credible interval). These coefficients show the contribution of each variable across organisms to the final protein amount (PA) using a Z-score scale to make them comparable. The TLRi for HeLa and the PS for E. coli are not shown because they were mathematically calculated from PA values (see Materials and Methods).CC BY · PubMed Central
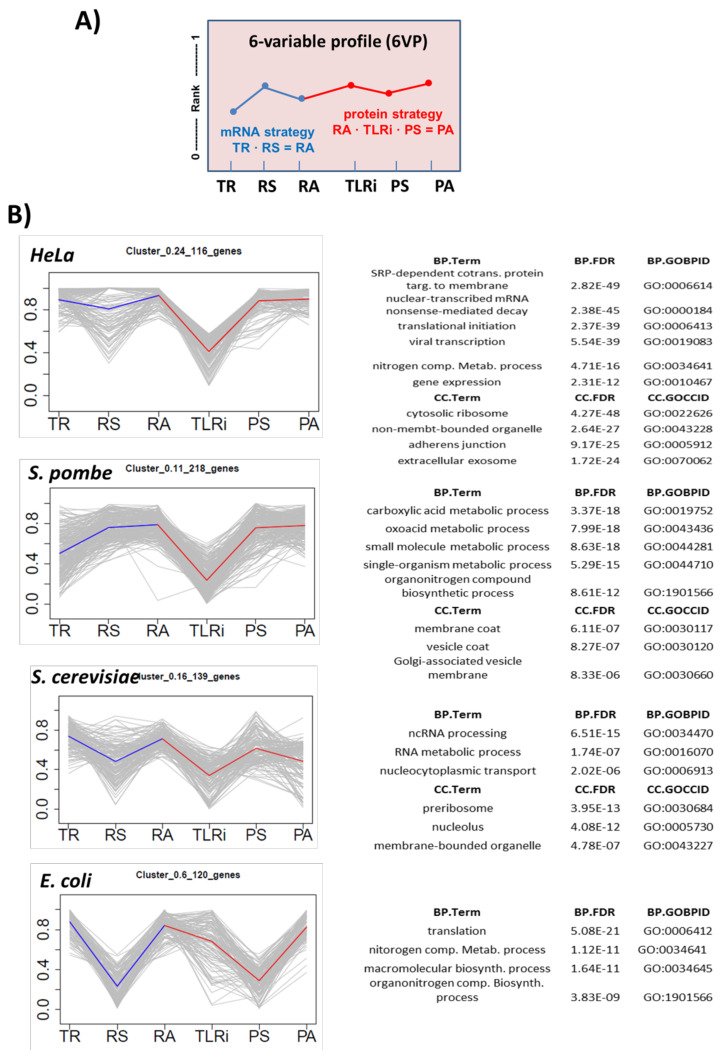
Figure 3 The 6-variable profile (6VP) allows researchers to cluster all genes according to their expression strategy. (A) Genes were ranked from lowest (0) to highest (1) in each variable (TR, RS, RA, TLRi, PS, PA). The shape of the line linking the six points is characteristic of an expression strategy: a 6VP. The strategy to gain a defined RA corresponds to the first part of the line (in blue): in the steady state the mRNA level depends on both its transcription rate and stability. For the protein strategy (in red), the final level depends on both the total translation rate (TLRi x RA) and protein stability. (B) Many clusters selected from the four studied organisms show defined profiles and statistically enriched GO terms. The individual gene profiles are shown in gray and the average profile of the cluster on the colored line. Some of the GOs with the highest p-values are shown on the right for the Biological Process (BP) and Cellular Component (CC) ontologies. Other examples are found in Supplementary Figure S1 and the whole lists are given as Appendices.
Figure 3 The 6-variable profile (6VP) allows researchers to cluster all genes according to their expression strategy. (A) Genes were ranked from lowest (0) to highest (1) in each variable (TR, RS, RA, TLRi, PS, PA). The shape of the line linking the six points is characteristic of an expression strategy: a 6VP. The strategy to gain a defined RA corresponds to the first part of the line (in blue): in the steady state the mRNA level depends on both its transcription rate and stability. For the protein strategy (in red), the final level depends on both the total translation rate (TLRi x RA) and protein stability. (B) Many clusters selected from the four studied organisms show defined profiles and statistically enriched GO terms. The individual gene profiles are shown in gray and the average profile of the cluster on the colored line. Some of the GOs with the highest p-values are shown on the right for the Biological Process (BP) and Cellular Component (CC) ontologies. Other examples are found in Supplementary Figure S1 and the whole lists are given as Appendices.CC BY · PubMed Central
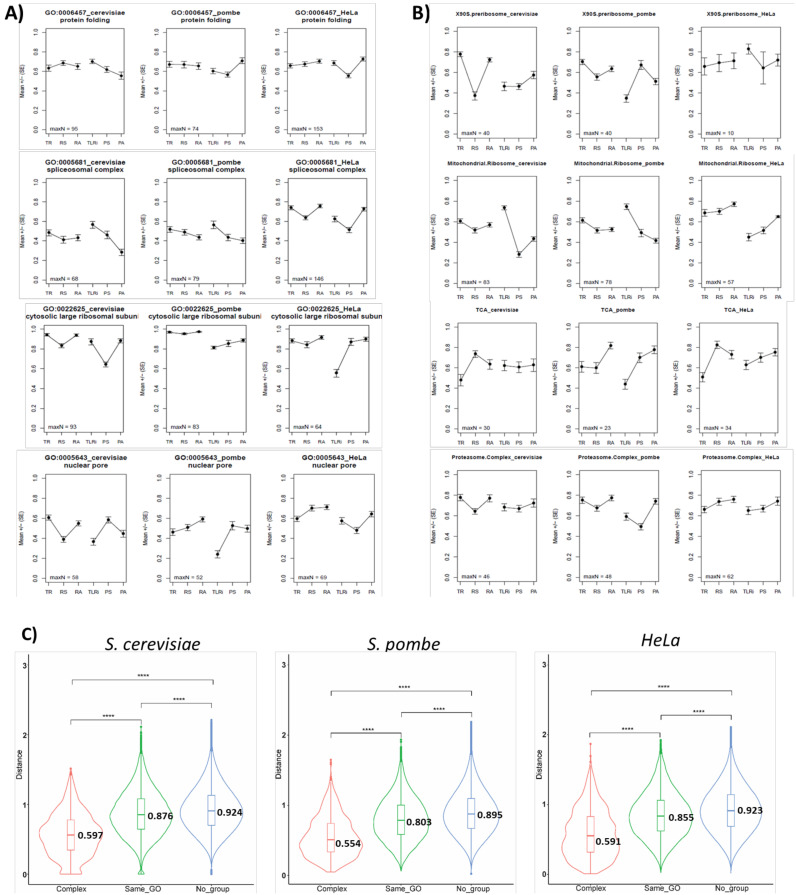
Figure 4 6VPs for the selected GOs and manually curated groups in S. cerevisiae, S. pombe and HeLa cells. (A) We selected four GO terms corresponding to well-known groups of functionally related genes/proteins. The ID of the GO and its name are shown for S. cerevisiae (left), S. pombe (center) and HeLa (right). The maximum number of genes used (maxN) to determine the average value and standard error is shown. In some variables, this number may be lower due to the lack of information for some particular genes in some datasets. In this figure, unlike Figure 3, we independently represent mRNA and protein parts without a connecting line to better display the differences between them. (B) A similar analysis to that in (A), but done with the manually-curated categories that were used in a previous study on S. cerevisiae [3]. (C) Violin plots showing the mean of proximity (values shown on the plots) between the genes coding for the proteins acting in macromolecular complexes (Complex, red) belonging to the same GO, but do not form complexes (Same_GO, green) and other gene pairs that do not belong to the previous groups (No_group, blue). A t-test was applied for the statistical significance of the difference. **** p-value < 2.2 × 10⁻¹⁶ (lowest numerical value displayed in R). An ANOVA also detected a significant difference (p-value < 2.2 × 10⁻¹⁶) among the three gene groups in all the organisms the first time they were cited.
Figure 4 6VPs for the selected GOs and manually curated groups in S. cerevisiae, S. pombe and HeLa cells. (A) We selected four GO terms corresponding to well-known groups of functionally related genes/proteins. The ID of the GO and its name are shown for S. cerevisiae (left), S. pombe (center) and HeLa (right). The maximum number of genes used (maxN) to determine the average value and standard error is shown. In some variables, this number may be lower due to the lack of information for some particular genes in some datasets. In this figure, unlike Figure 3, we independently represent mRNA and protein parts without a connecting line to better display the differences between them. (B) A similar analysis to that in (A), but done with the manually-curated categories that were used in a previous study on S. cerevisiae [3]. (C) Violin plots showing the mean of proximity (values shown on the plots) between the genes coding for the proteins acting in macromolecular complexes (Complex, red) belonging to the same GO, but do not form complexes (Same_GO, green) and other gene pairs that do not belong to the previous groups (No_group, blue). A t-test was applied for the statistical significance of the difference. **** p-value < 2.2 × 10⁻¹⁶ (lowest numerical value displayed in R). An ANOVA also detected a significant difference (p-value < 2.2 × 10⁻¹⁶) among the three gene groups in all the organisms the first time they were cited.CC BY · PubMed Central
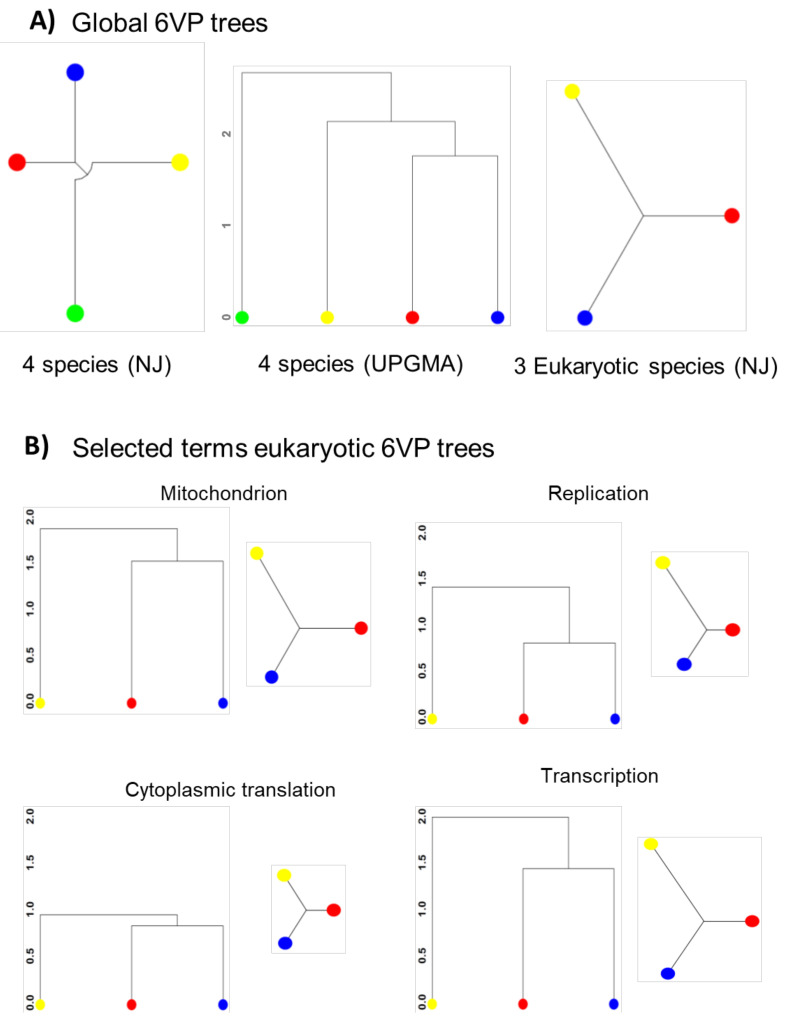
Figure 5 Phenograms of the four organisms based on their 6VPs. (A) Global neighbor-joining (NJ) and UPGMA trees based on the 6VPs derived from 53 GO Biological Process (BP) and 2 GO Cellular Component (CC) terms for S. cerevisiae (red dots), S. pombe (blue dots), E. coli (green dots) and H. sapiens (HeLa cell line, yellow dots) (left and center), or only the NJ tree for the three eukaryotes with 353 GO BP, plus 84 GO CC terms (right). (B) NJ and UPGMA trees based on the available GO terms linked (manually curated) with cytoplasmic translation, transcription, mitochondrion and replication. All the NJ and UPGMA unrooted trees are, respectively, on the same scale, but NJ and UPGMA are represented with a different kind of branching to show complementary information. The lists of the GO terms used in each tree are provided in Supplementary Table S5. Additional phenograms for other GO terms are shown in Supplementary Figure S2.
Figure 5 Phenograms of the four organisms based on their 6VPs. (A) Global neighbor-joining (NJ) and UPGMA trees based on the 6VPs derived from 53 GO Biological Process (BP) and 2 GO Cellular Component (CC) terms for S. cerevisiae (red dots), S. pombe (blue dots), E. coli (green dots) and H. sapiens (HeLa cell line, yellow dots) (left and center), or only the NJ tree for the three eukaryotes with 353 GO BP, plus 84 GO CC terms (right). (B) NJ and UPGMA trees based on the available GO terms linked (manually curated) with cytoplasmic translation, transcription, mitochondrion and replication. All the NJ and UPGMA unrooted trees are, respectively, on the same scale, but NJ and UPGMA are represented with a different kind of branching to show complementary information. The lists of the GO terms used in each tree are provided in Supplementary Table S5. Additional phenograms for other GO terms are shown in Supplementary Figure S2.CC BY · PubMed Central

Verification

Claims the paper makes

The claims and statistics of this paper haven’t been checked yet.

Run the check — free, no account needed. It reads the open-access text and checks the sources it cites.

A few free checks a day · papers already verified open instantly · results are public

Self-check

Percentages, sums and reported differences re-computed from the paper’s own numbers.

The self-check needs the paper’s full text.

Citations

Cites

Research works printed but not linked: 80

  1. 1958, On protein synthesis, Symp Soc Exp Biol., 13, 138
  2. 10.1002/pmic.201000327 · DOI · Paper page
  3. 10.1186/gb-2007-8-10-r222 · DOI
  4. 10.1016/j.cell.2016.03.014 · DOI · Paper page
  5. 10.1371/journal.pgen.1005206 · DOI · Paper page
  6. 2017, Absolute Quantification of protein and mRNA abundances demonstrate variability in gene-specific translation efficiency in yeast, Cell Syst., 4, 495, 10.1016/j.cels.2017.03.003 · DOI · Paper page
  7. 10.1093/nar/gkx898 · DOI
  8. 10.1126/science.aaa8332 · DOI
  9. 10.1039/C5MB00310E · DOI
  10. 10.1038/nrg3185 · DOI · Paper page
  11. 10.1073/pnas.0605420103 · DOI · Paper page
  12. 2019, Homeostasis in the Central Dogma of molecular biology: the importance of mRNA instability, RNA Biol., 16, 1659, 10.1080/15476286.2019.1655352 · DOI · Paper page
  13. 10.1016/j.tig.2007.03.006 · DOI
  14. 10.1371/journal.pbio.0020137 · DOI
  15. 10.1038/nature04785 · DOI · Paper page
  16. 10.1038/ng1807 · DOI · Paper page
  17. 2000, Where does fission yeast sit on the tree of life?, Genome Biol., 1, REVIEWS101
  18. 10.1038/nrg2811 · DOI
  19. 10.1073/pnas.0403984101 · DOI · Paper page
  20. 10.1534/genetics.115.181503 · DOI
  21. 2015, Cancer cell line panels empower genomics-based discovery of precision cancer medicine, Yonsei Med J, 56, 1186, 10.3349/ymj.2015.56.5.1186 · DOI
  22. 10.1038/msb.2010.112 · DOI
  23. 10.1261/rna.045104.114 · DOI
  24. 10.1371/journal.pcbi.1000865 · DOI · Paper page
  25. 10.1016/j.celrep.2014.10.065 · DOI · Paper page
  26. 10.1016/j.cell.2015.04.051 · DOI · Paper page
  27. 10.1371/journal.pone.0015442 · DOI
  28. 10.1126/science.1168978 · DOI · Paper page
  29. 10.1038/msb.2010.38 · DOI
  30. 10.15252/msb.20156526 · DOI
  31. 10.1101/gr.130161.111 · DOI
  32. 10.1016/j.cell.2012.09.019 · DOI · Paper page
  33. 10.1016/j.molcel.2007.03.002 · DOI · Paper page
  34. 10.1074/mcp.M112.023754 · DOI
  35. 10.1101/gr.130559.111 · DOI
  36. 10.1038/msb.2011.81 · DOI · Paper page
  37. 10.15252/msb.20155865 · DOI
  38. 10.1021/pr101183k · DOI · Paper page
  39. 10.1038/msb.2012.44 · DOI · Paper page
  40. 10.1038/nmeth.2834 · DOI · Paper page
  41. 10.1093/nar/gkt1150 · DOI
  42. 10.1186/s12864-015-1482-8 · DOI
  43. 10.1016/j.cell.2014.02.033 · DOI
  44. 10.1039/c3mb70119k · DOI · Paper page
  45. 10.1038/nbt.3418 · DOI
  46. 10.1093/nar/gkw1003 · DOI
  47. 2018, Bayesian testing, variable selection and model averaging in linear models using R with BayesVarSel, The R Journal, 10, 155, 10.32614/RJ-2018-021 · DOI
  48. 2008, clValid: An R package for cluster validation, J Statist Software, 25, 4
  49. 10.1093/bioinformatics/17.2.126 · DOI
  50. 1995, Controlling the false discovery rate: a practical and powerful approach to multiple testing, J. R.Stat. Soc. B., 57, 289, 10.1111/j.2517-6161.1995.tb02031.x · DOI · Paper page
  51. 2020, Gene Ontology semantic similarity analysis using GOSemSim, Methods Mol Biol., 2117, 207, 10.1007/978-1-0716-0301-7_11 · DOI · Paper page
  52. 1999, Semantic similarity in a taxonomy: An information-based measure and its application to problems of ambiguity in natural language, J Artif Intell Res., 11, 95, 10.1613/jair.514 · DOI
  53. Lin, D. (1998) An information-theoretic definition of similarity. In: Proceedings of the 15th International Conference on Machine Learning. pp 296–304
  54. 10.1093/bioinformatics/btq706 · DOI
  55. 10.1534/g3.113.005777 · DOI
  56. 10.1038/nature22293 · DOI · Paper page
  57. 2017, Wilhelm et al. reply, Nature, 547, E23, 10.1038/nature22294 · DOI
  58. 10.1093/nar/gkz033 · DOI
  59. 10.7554/eLife.32536 · DOI
  60. 10.1128/MCB.24.12.5534-5547.2004 · DOI
  61. 10.1016/j.jmb.2013.02.029 · DOI
  62. 10.1261/rna.072892.119 · DOI
  63. 10.1016/j.ymeth.2017.02.003 · DOI
  64. 10.1038/nrm.2017.91 · DOI · Paper page
  65. 10.1016/j.cell.2015.02.029 · DOI · Paper page
  66. 10.1186/s12864-016-3237-6 · DOI
  67. 10.1016/j.tim.2009.04.004 · DOI
  68. 10.1038/msb.2013.47 · DOI · Paper page
  69. 10.1371/journal.pone.0021800 · DOI · Paper page
  70. 10.1007/978-1-60327-853-9_8 · DOI · Paper page
  71. 10.1016/j.molcel.2004.06.004 · DOI
  72. 10.1016/j.molcel.2017.11.002 · DOI
  73. 2018, Unification of protein abundance datasets yields a quantitative Saccharomyces cerevisiae proteome, Cell Syst., 6, 192, 10.1016/j.cels.2017.12.004 · DOI
  74. 10.1016/j.cell.2017.03.031 · DOI · Paper page
  75. 10.1016/j.cell.2013.10.047 · DOI
  76. 10.1007/s00239-001-0054-5 · DOI
  77. 1999, The genomic tree as revealed from whole proteome comparisons, Genome Res., 9, 550, 10.1101/gr.9.6.550 · DOI
  78. 10.1126/science.aaa0769 · DOI
  79. 10.1016/j.ympev.2004.10.020 · DOI
  80. 10.1038/nature13424 · DOI

Metadata

Authors
Forés-Martos, J., Forte, A., García-Martínez, J., & Pérez-Ortín, J. E.
Affiliations
Universitat de València (ES)
Corresponding author
Pérez-Ortín, José E.
Venue
Cells
Publisher
openRxiv
Published
2020-09-06
Volume
10
Issue
2
Pages
334-334
ISSN
2073-4409 (ISSN-L)
OpenAlex
W3128917776
Cited by
8
References
2
Citations by year
2026: 1 · 2024: 2 · 2023: 3 · 2022: 2
FWCI
0.55
Type
journal article
Language
en
Open access
Locations
  • Cells (publishedVersion, cc-by)
  • bioRxiv (Cold Spring Harbor Laboratory) (acceptedVersion)
  • PubMed Central (publishedVersion, cc-by)
  • PubMed (publishedVersion)
  • LA Referencia (Red Federada de Repositorios Institucionales de Publicaciones Científicas) (submittedVersion, cc-by-nc)
  • DOAJ (DOAJ: Directory of Open Access Journals) (submittedVersion, cc-by-sa)
  • Repository of Digital Objects for Teaching Research and Culture (University of Valencia) (submittedVersion, other-oa)
Funders
  • Ministerio de Ciencia, Innovación y Universidades (BFU2016-77728-C3-3-P)
  • European Commission
  • Generalitat Valenciana (AICO2019/088)
Topics
  • Life Sciences › Biochemistry, Genetics and Molecular Biology › Molecular Biology › Bioinformatics and Genomic Networks
  • Life Sciences › Biochemistry, Genetics and Molecular Biology › Molecular Biology › Gene Regulatory Network Analysis
  • Life Sciences › Biochemistry, Genetics and Molecular Biology › Molecular Biology › Fungal and yeast genetics research
Keywords
gene expression regulation, mRNA levels, protein abundance, mRNA synthesis rate, protein synthesis rate, protein degradation rate, phylogenetic relationships, Saccharomyces cerevisiae, Schizosaccharomyces pombe, HeLa cells, Escherichia coli, transcription rate, translation (biology), macromolecular complexes
MeSH terms
Humans, Saccharomyces cerevisiae, Transcription, Genetic, Gene Expression Regulation, Fungal, RNA Stability

About these checks

Registry, retraction, Cites and statistics results are computed, not judged, with one exception: a printed reference that no index lists is read once by a model before it counts as a citation error. Claims are extracted by a model and kept only when their quote appears verbatim in the text; each cited source is then checked, with a model’s help, for whether it says what the claim relies on. Those verdicts can be wrong — read the claim’s quote and the cited source before relying on one.

Statistics and arithmetic are recomputed, not judged.

Confidence bands are shown only for fields calibrated on our annotated test set. None is calibrated yet, so no band is shown.

What counts as a claim ›How we measure confidence ›How we check this ›

Are you an author, or do you see a problem with this page? Request a review