

The DOI matches its Crossref record; 1 of the 1 references it cites were found in a registry or an index.
AI-driven prediction of SARS-CoV-2 variant binding trends from atomistic simulations
Open accessPreprint — published as 10.1140/epje/s10189-021-00119-5 · Paper page
Abstract
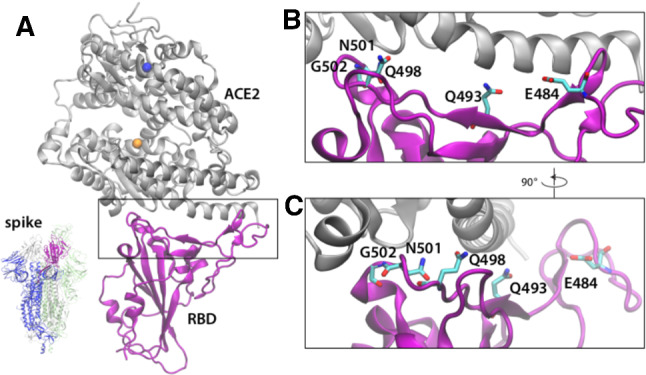
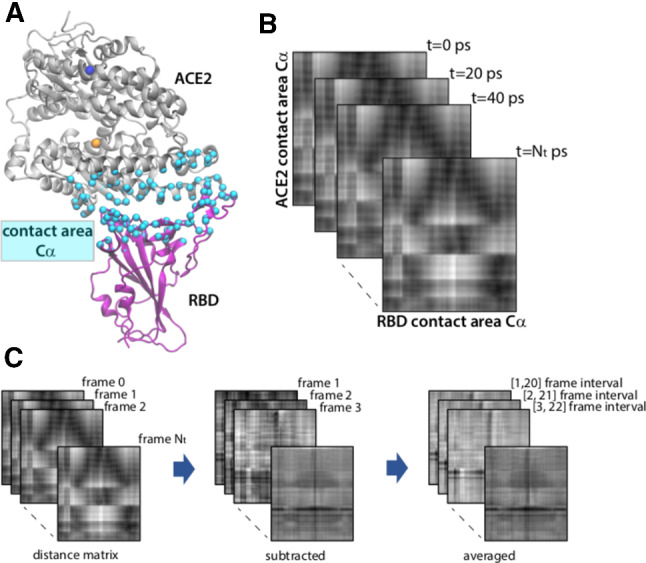
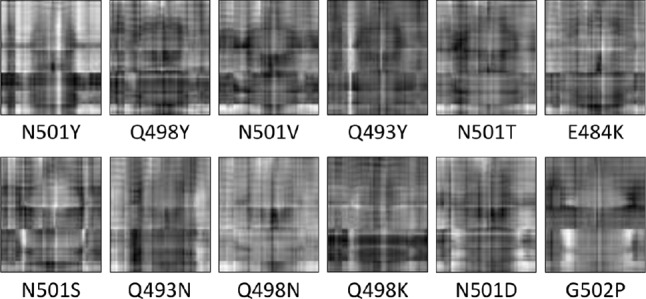
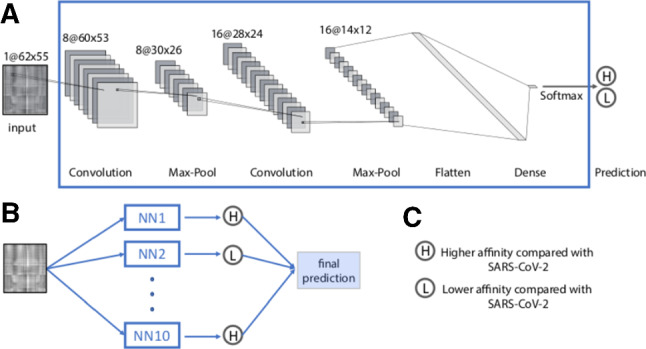
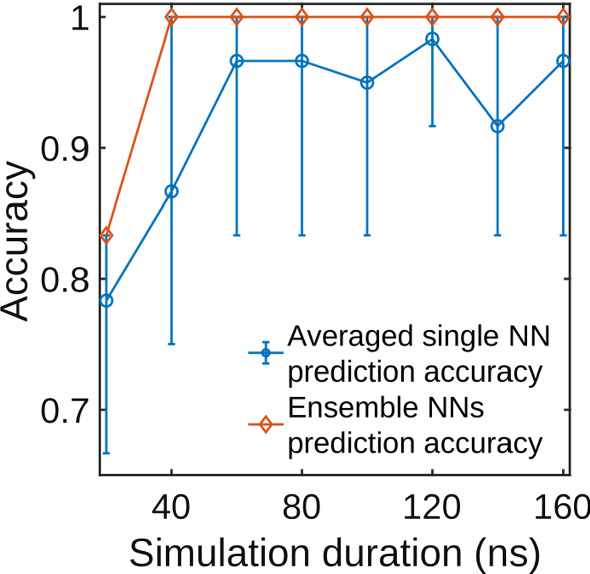
We present a novel technique to predict binding affinity trends between two molecules from atomistic molecular dynamics simulations. The technique uses a neural network algorithm applied to a series of images encoding the distance between two molecules in time. We demonstrate that our algorithm is capable of separating with high accuracy non-hydrophobic mutations with low binding affinity from those with high binding affinity. Moreover, we show high accuracy in prediction using a small subset of the simulation, therefore requiring a much shorter simulation time. We apply our algorithm to the binding between several variants of the SARS-CoV-2 spike protein and the human receptor ACE2.
Overview
The claims and statistics of this paper haven’t been checked yet.
Run the check — free, no account needed. It reads the open-access text and checks the sources it cites.
Integrity signals
Registry
Cites
Statistics
Figures
Verification
Claims the paper makes
The claims and statistics of this paper haven’t been checked yet.
Run the check — free, no account needed. It reads the open-access text and checks the sources it cites.
Self-check
Percentages, sums and reported differences re-computed from the paper’s own numbers.
The self-check needs the paper’s full text.
Citations
Cites
Markov state models of biomolecular conformational dynamics
Chodera, J. D., & Noé, F. (2014) · Current Opinion in Structural Biology · doi:10.1016/j.sbi.2014.04.002 · Cited by 776
Research works printed but not linked: 67
- H. J. Maier , E. Bickerton , and P. Britton , Coronaviruses: Methods and Protocols, 1–282 (2015).https://doi.org/10.1007/978-1-4939-2438-7 · DOI
- 2016, Annu. Rev. Virol, 3, 237, 10.1146/annurev-virology-110615-042301 · DOI · Paper page
- 10.3390/v4061011 · DOI · Paper page
- 2005, Virology, 335, 176
- 10.1073/pnas.1708727114 · DOI
- 10.1128/JVI.77.16.8801-8811.2003 · DOI · Paper page
- 2019, Advances in Virus Research, 105, 94
- 10.1126/science.abb2507 · DOI · Paper page
- 10.1016/j.cell.2020.02.035 · DOI
- 2020, Nature, 581, 215, 10.1038/s41586-020-2180-5 · DOI · Paper page
- 10.1038/s41586-020-2179-y · DOI · Paper page
- 10.1016/j.cell.2020.05.034 · DOI
- 10.1126/science.abb2762 · DOI
- 10.1038/s41586-020-2012-7 · DOI · Paper page
- 2020, Cell, 182, 1295, 10.1016/j.cell.2020.08.012 · DOI · Paper page
- 2021, Cell Host and Microbe, 29, 44, 10.1016/j.chom.2020.11.007 · DOI · Paper page
- 2020, Pharmacology and Translational Science, 3, 1023, 10.1021/acsptsci.0c00113 · DOI
- 2020, ACS Central Science, 6, 1654, 10.1021/acscentsci.0c01236 · DOI
- C. Peng , et al, ChemrXiv (2020).https://doi.org/10.26434/chemrxiv.11877492.v1 · DOI
- 2020, Journal of Computer-Aided Molecular Design, 35, 195
- 2021, J. Phys. Chem. Lett, 21, 5494
- 10.1073/pnas.2008209117 · DOI
- 10.1021/acs.jmedchem.1c00311 · DOI
- 2020, Sci. R, 10, 14214
- 2021, Biophys. J, 120, 1072, 10.1016/j.bpj.2020.10.036 · DOI
- 2020, J. Phys. Chem. B, 140, 10034
- 2020, J. Chem. Inf. Model, 60, 5794, 10.1021/acs.jcim.0c00679 · DOI
- J. M. Delgado and N. Duro and D. M. Rogers and A. Tkatchenko and S. A. Pandit and S. Varma , Proteins, 1–11, (2021)https://doi.org/10.1002/prot.260865794-5802 · DOI
- 2020, J. Phys. Chem. B, 124, 7336, 10.1021/acs.jpcb.0c04511 · DOI
- 10.1038/nchem.2785 · DOI
- G. R. Bowman , V. S. Pande , F. Noé . Dordrecht: Springer Science and Business Media. 148(2014).
- 10.1063/1.1472510 · DOI
- 10.1016/S0006-3495(96)79552-8 · DOI
- 2017, Annu Rev Biophys, 46, 43, 10.1146/annurev-biophys-070816-033834 · DOI
- 2011, J. Comput. Chem, 13, 2810
- 2009, Biophys J, 7, 2004
- C. Chipot and A. Pohorille , Free Energy Calculations, Springer (2007). · DOI
- 2020, J. Phys. Chem. Lett, 11, 9656, 10.1021/acs.jpclett.0c03130 · DOI
- 2020, Lecture Notes in Physics, 968, 331, 10.1007/978-3-030-40245-7_16 · DOI
- L. Casalino , et al, BioRxiv (2020).https://doi.org/10.1101/2020.11.19.390187 · DOI
- 2019, Massive computational acceleration by using neural networks to emulate mechanismbased biological models, Nature Communications, 10, 19
- 2020, Predictive biology: modelling, understanding and harnessing microbial complexity, Nature Reviews Microbiology, 18, 507, 10.1038/s41579-020-0372-5 · DOI
- 2020, J. Phys. Chem. b, 124, 9103, 10.1021/acs.jpcb.0c05977 · DOI
- 2020, Journal of Chemical Information and Modeling, 60, 2766, 10.1021/acs.jcim.0c00026 · DOI
- 10.1016/j.bpj.2019.12.016 · DOI · Paper page
- 2019, Bioinformatics, 35, i269, 10.1093/bioinformatics/btz339 · DOI
- 10.1038/s41586-020-2179-y · DOI · Paper page
- 2016, J. Chem. Thory Comput, 12, 405, 10.1021/acs.jctc.5b00935 · DOI
- 2008, J. Chem. Thory Comput, 29, 1859, 10.1002/jcc.20945 · DOI · Paper page
- 10.1016/0263-7855(96)00018-5 · DOI · Paper page
- 10.1002/jcc.20289 · DOI · Paper page
- 2005, J. Chem. Phys, 153, 044130
- 10.1038/nmeth.4067 · DOI
- 10.1063/1.445869 · DOI
- 1993, J. Chem. Phys, 103, 4613
- 10.1063/1.467468 · DOI
- 10.1063/1.464397 · DOI
- 10.1063/1.470117 · DOI
- 10.1080/08927029108022142 · DOI
- 10.1016/0021-9991(77)90098-5 · DOI
- R. J. Gowers , et al. In S. Benthall and S. Rostrup , editors,Proceedings of the 15th Python in Science Conference, 98–105 (2016).
- 10.1002/jcc.21787 · DOI
- 2021, Collective colony growth is optimized by branching pattern formation in Pseudomonas aeruginosa, Molecular Systems Biology, 17, e10089, 10.15252/msb.202010089 · DOI
- G. Schreiber and G. Haran and H.-X. Zhou , Chem. Rev., 109, (2008). · DOI
- 10.1073/pnas.2133366100 · DOI
- 2019, Biochemistry, 58, 156, 10.1021/acs.biochem.8b00977 · DOI
- 2020, Nature Machine Intelligence, 2, 116, 10.1038/s42256-020-0149-6 · DOI · Paper page
Metadata
- Authors
- Capponi, S., Wang, S., Navarro, E. J., & Bianco, S.
- Affiliations
- University of California, San Francisco (US)
- Corresponding author
- Bianco, Simone
- Venue
- The European Physical Journal E
- Publisher
- openRxiv
- Published
- 2021-03-08
- Volume
- 44
- Issue
- 10
- Pages
- 123-123
- ISSN
- 1292-8941 (ISSN-L)
- PMC
- PMC8493367
- OpenAlex
- W3202379675
- Cited by
- 12
- References
- 1
- Citations by year
- 2026: 2 · 2025: 2 · 2024: 3 · 2023: 1 · 2022: 3 · 2021: 1
- FWCI
- 0.63
- Type
- journal article
- Language
- en
- Open access
- hybrid
- doi.org
- Licence
- Locations
- The European Physical Journal E (publishedVersion, cc-by)
- bioRxiv (Cold Spring Harbor Laboratory) (acceptedVersion, cc-by-nc)
- Europe PMC (PubMed Central) (publishedVersion, other-oa)
- PubMed Central (publishedVersion, cc-by)
- PubMed (publishedVersion)
- Springer Link (Chiba Institute of Technology) (submittedVersion)
- Funders
- National Science Foundation (1548297)
- Rensselaer Polytechnic Institute
- Topics
- Health Sciences › Medicine › Infectious Diseases › SARS-CoV-2 and COVID-19 Research
- Life Sciences › Biochemistry, Genetics and Molecular Biology › Molecular Biology › Protein Structure and Dynamics
- Life Sciences › Pharmacology, Toxicology and Pharmaceutics › Drug Discovery › Computational Drug Discovery Methods
- Keywords
- SARS-CoV-2 variants, spike protein, ACE2 receptor, protein-protein binding affinity, binding affinity prediction, artificial neural networks, molecular dynamics simulation, atomistic simulation
- MeSH terms
- Angiotensin-Converting Enzyme 2, SARS-CoV-2, Algorithms, Artificial Intelligence, Humans, Models, Molecular, Mutation, Protein Binding, Protein Conformation, Neural Networks, Computer, Molecular Dynamics Simulation, Spike Glycoprotein, Coronavirus
About these checks
Registry, retraction, Cites and statistics results are computed, not judged, with one exception: a printed reference that no index lists is read once by a model before it counts as a citation error. Claims are extracted by a model and kept only when their quote appears verbatim in the text; each cited source is then checked, with a model’s help, for whether it says what the claim relies on. Those verdicts can be wrong — read the claim’s quote and the cited source before relying on one.
Statistics and arithmetic are recomputed, not judged.
Confidence bands are shown only for fields calibrated on our annotated test set. None is calibrated yet, so no band is shown.
What counts as a claim ›How we measure confidence ›How we check this ›
Are you an author, or do you see a problem with this page? Request a review
