

The DOI matches its Crossref record; 2 of the 2 references it cites were found in a registry or an index.
Exploring the alternative conformation of a known protein structure based on contact map prediction
Open accessPreprint — published as 10.1021/acs.jcim.3c01381
Abstract
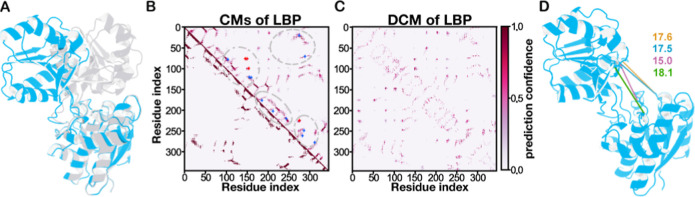
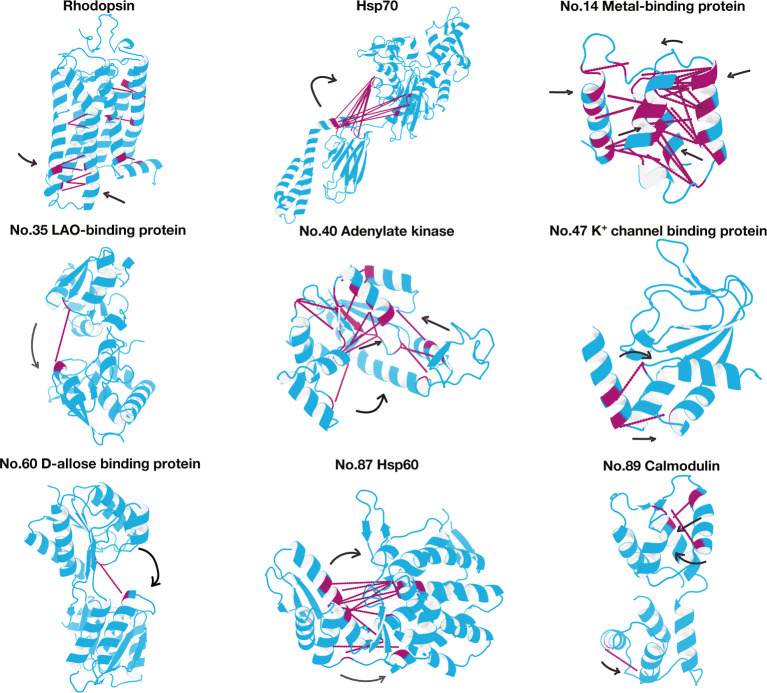
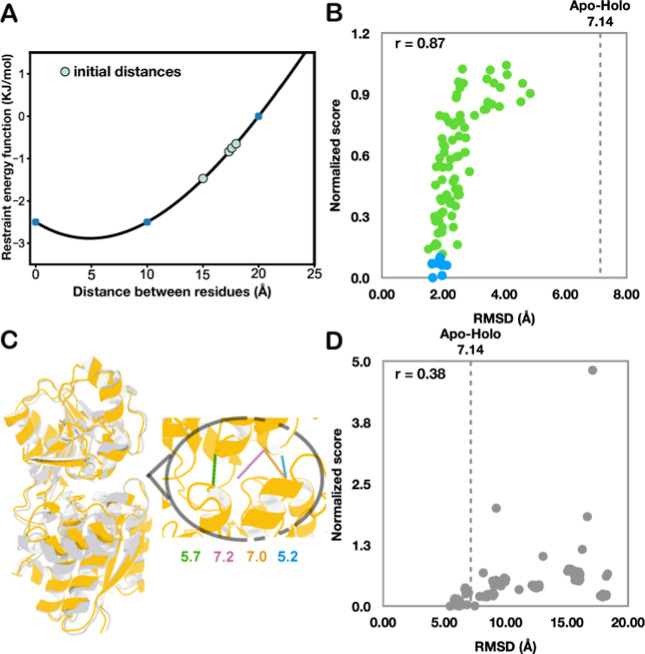
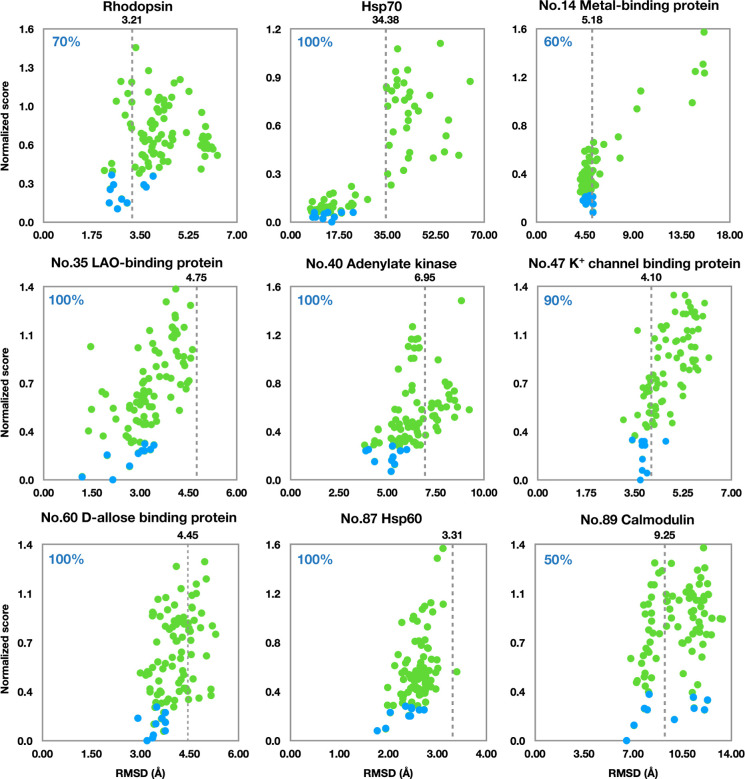
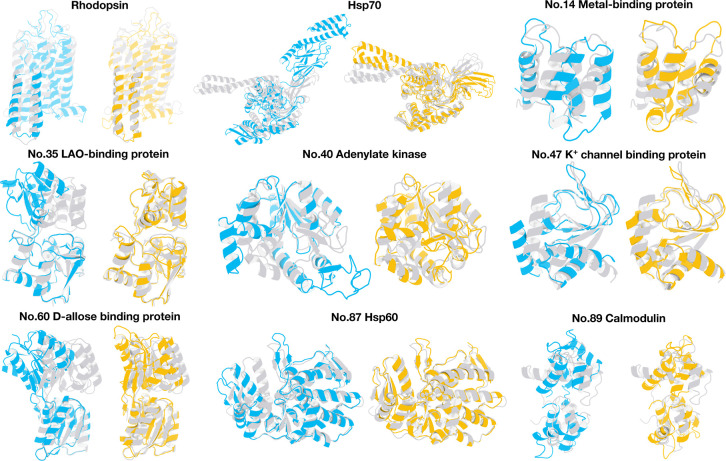
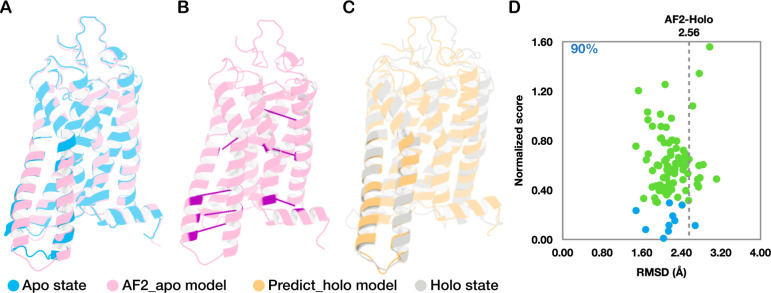
The rapid development of deep learning-based methods has considerably advanced the field of protein structure prediction. The accuracy of predicting the 3D structures of simple proteins is comparable to that of experimentally determined structures, providing broad possibilities for structure-based biological studies. Another critical question is whether and how multistate structures can be predicted from a given protein sequence. In this study, analysis of multiple two-state proteins demonstrated that deep learning-based contact map predictions contain structural information on both states, which suggests that it is probably appropriate to change the target of deep learningbased protein structure prediction from one specific structure to multiple likely structures. Furthermore, by combining deep learning- and physics-based computational methods, we developed a protocol for exploring alternative conformations from a known structure of a given protein, by which we successfully approached the holo-state conformation of a leucine-binding protein from its apo-state structure.
Overview
The claims and statistics of this paper haven’t been checked yet.
Run the check — free, no account needed. It reads the open-access text and checks the sources it cites.
Integrity signals
Registry
Cites
Statistics
Figures
Verification
Claims the paper makes
The claims and statistics of this paper haven’t been checked yet.
Run the check — free, no account needed. It reads the open-access text and checks the sources it cites.
Self-check
Percentages, sums and reported differences re-computed from the paper’s own numbers.
The self-check needs the paper’s full text.
Citations
Cites
Highly accurate protein structure prediction with AlphaFold
Jumper, J., Evans, R., Pritzel, A., Green, T., Figurnov, M., Ronneberger, O., Tunyasuvunakool, K., Bates, R., Žídek, A., Potapenko, A., et al. (2021) · Nature · doi:10.1038/s41586-021-03819-2 · Cited by 43,764
Sampling alternative conformational states of transporters and receptors with AlphaFold2
del Alamo, D., Sala, D., Mchaourab, H. S., & Meiler, J. (2022) · eLife · doi:10.7554/elife.75751 · Cited by 511
Research works printed but not linked: 60
- 1995, The protein folding problem and tertiary structure prediction, FEBS Letters, 361, 129, 10.1016/0014-5793(99)90003-0 · DOI
- 10.1126/science.1219021 · DOI · Paper page
- 10.1038/nbt.2419 · DOI · Paper page
- 2017, Accurate de novo prediction of protein contact map by ultra-deep learning model, PLoS Computational Biology, 13, e1005324, 10.1371/journal.pcbi.1005324 · DOI · Paper page
- 2019, A further leap of improvement in tertiary structure prediction in CASP13 prompts new routes for future assessments, Proteins: Structure, Function, and Bioinformatics, 87, 1100, 10.1002/prot.25787 · DOI · Paper page
- 2019, Deep-learning contactmap guided protein structure prediction in CASP13, Proteins: Structure, Function, and Bioinformatics, 87, 1149, 10.1002/prot.25792 · DOI · Paper page
- 2019, Analysis of distance-based protein structure prediction by deep learning in CASP13, Proteins: Structure, Function, and Bioinformatics, 87, 1069, 10.1002/prot.25810 · DOI
- 10.1126/science.abj8754 · DOI · Paper page
- 10.1016/j.sbi.2021.01.007 · DOI · Paper page
- 2021, Highly accurate protein structure prediction for the human proteome, Nature, 596, 590, 10.1038/s41586-021-03828-1 · DOI · Paper page
- 2021, Assessment of the CASP14 assembly predictions, Proteins, 89, 1787, 10.1002/prot.26199 · DOI · Paper page
- 10.1038/nmeth.3213 · DOI · Paper page
- 10.1371/journal.pcbi.1006805 · DOI
- 2020, High-accuracy protein structures by combining machine-learning with physics-based refinement, Proteins: Structure, Function and Bioinformatics, 88, 637, 10.1002/prot.25847 · DOI
- 2021, Physics-based protein structure refinement in the era of artificial intelligence, Proteins, 89, 1870, 10.1002/prot.26161 · DOI
- 2020, Discovering protein conformational flexibility through artificial-intelligence-aided molecular dynamics, Journal of Physical Chemistry B, 124, 8221, 10.1021/acs.jpcb.0c03985 · DOI
- 10.1002/prot.21510 · DOI
- 10.1021/bi0260839 · DOI
- 10.1038/nature11896 · DOI
- 10.1016/j.neuron.2015.08.032 · DOI · Paper page
- 10.1016/j.mam.2012.07.001 · DOI · Paper page
- Heo, L. ; Feig, M. Multi-state modeling of G-protein coupled receptors at experimental accuracy. Proteins: Structure, Function, and Bioinformatics 2022, · DOI · Paper page
- 10.1038/nature06522 · DOI · Paper page
- 10.1016/j.cell.2015.03.049 · DOI
- 10.1126/science.1208351 · DOI · Paper page
- Orellana, L. ; Yoluk, O. ; Carrillo, O. ; Orozco, M. ; Lindahl, E. Prediction and validation of protein intermediate states from structurally rich ensembles and coarse-grained simulations. Nature Communications 2016, 7. · DOI
- 2019, Biophysical techniques in structural biology, Annual Review of Biochemistry, 88, 25, 10.1146/annurev-biochem-013118-111947 · DOI
- 2019, Protein Data Bank: The single global archive for 3D macromolecular structure data, Nucleic Acids Research, 47, D520, 10.1093/nar/gky949 · DOI · Paper page
- 10.1073/pnas.1315625110 · DOI
- 10.1016/j.str.2015.10.025 · DOI
- 2021, Probing allosteric regulations with coevolution-driven molecular simulations, Science Advances, 7, eabj0786, 10.1126/sciadv.abj0786 · DOI
- 2022, Uncovering the Dominant Motion Modes of Allosteric Regulation Improves Allosteric Site Prediction, Journal of Chemical Information and Modeling, 62, 187, 10.1021/acs.jcim.1c01267 · DOI
- 10.1093/bioinformatics/btv390 · DOI
- 10.1073/pnas.1821309116 · DOI · Paper page
- 2020, Difference contact maps: From what to why in the analysis of the conformational flexibility of proteins, PLoS ONE, 15, e0226702, 10.1371/journal.pone.0226702 · DOI
- 2020, FingerprintContacts: Predicting alternative conformations of proteins from coevolution, Journal of Physical Chemistry B, 124, 3605, 10.1021/acs.jpcb.9b11869 · DOI
- 10.1103/PhysRevLett.82.656 · DOI
- 10.1016/j.molcel.2019.06.007 · DOI
- 10.1016/j.molcel.2012.09.023 · DOI
- 10.1074/jbc.M311890200 · DOI
- Saldaño, T. et al. Impact of protein conformational diversity on AlphaFold predictions. Bioinformatics 2022, btac202. · DOI · Paper page
- 2015, Protein structure determination by combining sparse NMR data with evolutionary couplings, Nature Methods, 12, 751, 10.1038/nmeth.3455 · DOI
- 10.1073/pnas.1914677117 · DOI · Paper page
- 2021, Predicting new protein conformations from molecular dynamics simulation conformational landscapes and machine learning, Proteins: Structure, Function, and Bioinformatics, 89, 915, 10.1002/prot.26068 · DOI
- 2022, Membrane contact probability: An essential and predictive character for the structural and functional studies of membrane proteins, PLoS Computational Biology, 18, e1009972, 10.1371/journal.pcbi.1009972 · DOI · Paper page
- 10.1021/cr4003769 · DOI
- 10.1016/j.molcel.2007.08.022 · DOI
- 2019, The Hsp70 chaperone network, Nature Reviews Molecular Cell Biology, 20, 665, 10.1038/s41580-019-0133-3 · DOI · Paper page
- 10.1111/j.1365-2958.1996.tb02484.x · DOI
- 2012, HHblits: Lightning-fast iterative protein sequence searching by HMM-HMM alignment, Nature Methods, 9, 173, 10.1038/nmeth.1818 · DOI · Paper page
- Sikic, K. ; Jeren, B. ; Tomic, S. The protein secondary structure flexibility. Proceedings of the 2008 International Conference on Bioinformatics and Computational Biology 2008, 918–926.
- 10.1093/bioinformatics/btq007 · DOI
- 10.1073/pnas.96.10.5482 · DOI
- 2016, Simultaneous optimization of biomolecular energy functions on features from small molecules and macromolecules, Journal of Chemical Theory and Computation, 12, 6201, 10.1021/acs.jctc.6b00819 · DOI
- 10.1016/J.SOFTX.2015.06.001 · DOI · Paper page
- 2016, CHARMM36m: An improved force field for folded and intrinsically disordered proteins, Nature Methods, 14, 71
- 10.1063/1.448118 · DOI
- 10.1063/1.464397 · DOI
- 2018, Faster simulations with a 5 fs time step for lipids in the CHARMM force field, Journal of Chemical Theory and Computation, 14, 3342, 10.1021/acs.jctc.8b00267 · DOI
- 10.1016/0263-7855(96)00018-5 · DOI · Paper page
Metadata
- Authors
- Li, J., Wang, L., Zhu, Z., & Song, C.
- Affiliations
- Peking University (CN)
- Corresponding author
- Song, Chen
- Venue
- Journal of Chemical Information and Modeling
- Publisher
- openRxiv
- Published
- 2022-06-09
- Volume
- 64
- Issue
- 1
- Pages
- 301-315
- ISSN
- 1549-9596 (ISSN-L)
- PMC
- PMC10777399
- OpenAlex
- W4389993920
- Cited by
- 21
- References
- 2
- Citations by year
- 2026: 5 · 2025: 10 · 2024: 4 · 2023: 1 · 2022: 1
- FWCI
- 1.78
- Type
- journal article
- Language
- en
- Open access
- hybrid
- doi.org
- Licence
- cc-by-nc-nd
- Locations
- Journal of Chemical Information and Modeling (publishedVersion, cc-by-nc-nd)
- bioRxiv (Cold Spring Harbor Laboratory) (acceptedVersion, cc-by-nc-nd)
- PubMed Central (publishedVersion, cc-by-nc-nd)
- PubMed (publishedVersion)
- Funders
- National Natural Science Foundation of China (21873006, 32071251)
- Peking University
- National Key Research and Development Program of China (2021YFE0108100)
- Topics
- Life Sciences › Biochemistry, Genetics and Molecular Biology › Molecular Biology › Protein Structure and Dynamics
- Life Sciences › Biochemistry, Genetics and Molecular Biology › Molecular Biology › Machine Learning in Bioinformatics
- Life Sciences › Biochemistry, Genetics and Molecular Biology › Structural Biology › Enzyme Structure and Function
- Keywords
- contact map prediction, two-state proteins, deep learning protein structure prediction, conformational change
- MeSH terms
- Amino Acid Sequence, Protein Conformation, Proteins, Computational Biology
About these checks
Registry, retraction, Cites and statistics results are computed, not judged, with one exception: a printed reference that no index lists is read once by a model before it counts as a citation error. Claims are extracted by a model and kept only when their quote appears verbatim in the text; each cited source is then checked, with a model’s help, for whether it says what the claim relies on. Those verdicts can be wrong — read the claim’s quote and the cited source before relying on one.
Statistics and arithmetic are recomputed, not judged.
Confidence bands are shown only for fields calibrated on our annotated test set. None is calibrated yet, so no band is shown.
What counts as a claim ›How we measure confidence ›How we check this ›
Are you an author, or do you see a problem with this page? Request a review
