PreprintCited by 21Bacterial Genetics and BiotechnologyMicrobial Metabolic Engineering and BioproductionBacterial biofilms and quorum sensing

The DOI matches its Crossref record; 1 of the 1 references it cites were found in a registry or an index.

Systems-wide dissection of organic acid assimilation in Pseudomonas aeruginosa reveals a novel path to underground metabolism

Open access

Preprint — published as 10.1128/mbio.02541-22 · Paper page

Abstract

The human pathogen Pseudomonas aeruginosa (Pa) is one of the most frequent and severe causes of nosocomial infection. This organism is also a major cause of airway infections in people with cystic fibrosis (CF). Pa is known to have a remarkable metabolic plasticity, allowing it to thrive in diverse environmental conditions and ecological niches, yet little is known about the central metabolic pathways which sustain its growth during infection, or precisely how these pathways operate. In this work, we used a combination of ‘omics approaches (transcriptomics, proteomics, metabolomics and 13 C-fluxomics) and reverse genetics to provide a systems-level insight into how the infection-relevant organic acids, succinate and propionate, are metabolized by Pa. Moreover, through structural and kinetic analysis of the 2-methylcitrate synthase (PrpC) and its paralogue, citrate synthase (GltA), we show how these two crucial enzymatic steps are interconnected in Pa organic acid assimilation. We found that Pa can rapidly adapt to the loss of GltA function by acquiring mutations in a transcriptional repressor, which then de-represses prpC expression. Our findings provide a clear example of how ‘underground metabolism’, facilitated by enzyme substrate promiscuity, “rewires” Pa metabolism, allowing it to overcome the loss of a crucial enzyme. This pathogen-specific knowledge is critical for the advancement of a model-driven framework to target bacterial central metabolism.

Overview

The claims and statistics of this paper haven’t been checked yet.

Run the check — free, no account needed. It reads the open-access text and checks the sources it cites.

A few free checks a day · papers already verified open instantly · results are public

Integrity signals

Registry

Crossref · 10.1101/2022.08.25.505149

Cites

1 of 1 references verified0 citation errors · 0 not checkable

Statistics

Figures

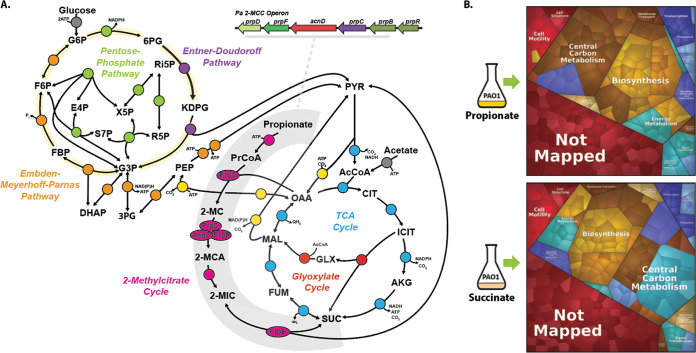
FIG 1 Proteomic analysis of Pa grown on succinate and propionate. (A) Schematic depicting the Pa 2-methylcitrate cycle (2MCC) in Pa central carbon metabolism. The Pa central metabolic network shown here consists of six main blocks, designated with different colors: (i) the Embden-Meyerhoff-Parnas pathway (EMP; orange); (ii) the pentose phosphate pathway (PPP; green); (iii) the Entner-Doudoroff pathway (EDP; purple); (iv) the tricarboxylic acid cycle (TCA; blue) and glyoxylate shunt (red); (v) anaplerotic and gluconeogenic reactions (yellow); and (vi) the 2MCC (pink). The 2MCC operon arrangement (inset, gray underline) consists of genes that encode a transcriptional regulator (designated here as prpR), which is thought to encode a ligand-responsive repressor, a methylcitrate synthase (prpC), which condenses propionyl-CoA (PrCoA) with oxaloacetate (OAA) to form 2-methylcitrate (2-MC), a 2-methylcitrate dehydratase/hydratase (prpD), which dehydrates 2-MC to yield 2-methylaconitate (2-MCA), a 2-methylcitrate dehydratase (acnD) and 2-methylaconitate cis-trans isomerase (prpF), which provide an alternative route for the generation of 2-MCA from 2-MC (the reason for an alternative route for 2-MCA generation in Pa is currently unclear), and a 2-methylisocitrate lyase (prpB), which cleaves 2-methylisocitrate (2-MIC) to yield pyruvate (PYR) and succinate (SUC). Note that the 2-MCA generated in the PrpD or AcnD/PrpF reactions is rehydrated by an unlinked aconitase (likely AcnB in Pa) to yield the PrpB substrate 2-MIC. Also, the enzyme responsible for the initial activation of propionate to yield PrCoA has not yet been identified for Pa, although in other organisms this function is carried out by a dedicated propionyl-CoA synthase (PrpE), by acetyl-CoA synthase (AcsA), by a combination of phosphotransacetylase (Pta) and acetate kinase (AckA) activities, or by an additional, uncharacterized propionyl-CoA ligase (7). AcCoA, acetyl-coenzyme A; CIT, citrate; ICIT, isocitrate; AKG, α-ketoglutarate; FUM, fumarate; MAL, malate; KDPG, 2-keto-3-deoxy-6-phosphogluconate; G3P, glyceraldehyde 3-phosphate; FBP, fructose 1,6-bisphosphate; F6P, fructose 6-phosphate; G6P, glucose 6-phosphate; 6PG, 6-phosphogluconate; Ri5P, ribulose 5-phosphate; R5P, ribose 5-phosphate; X5P, xylulose 5-phosphate; S7P, sedoheptulose 7-phosphate; E4P, erythrose 4-phosphate; PEP, phosphoenolpyruvate. (B) Illustration of the statistically significant proteomic changes (P ≤ 0.05, fold change of ≥1) during growth on propionate or succinate, as represented by Voronoi tessellations. Pathway assignment was performed using the KEGG data set. Proteome alterations that could not be assigned to a specific pathway (uncharacterised/hypothetical proteins) are shown as “Not Mapped.” The specific protein identities for the protein clusters that were upregulated during growth on propionate are shown in Fig. S1A in the supplemental material, and statistical analyses of these data are illustrated in Fig. S1B to D. The complete proteomics data set is presented in Data Set S1.
FIG 1 Proteomic analysis of Pa grown on succinate and propionate. (A) Schematic depicting the Pa 2-methylcitrate cycle (2MCC) in Pa central carbon metabolism. The Pa central metabolic network shown here consists of six main blocks, designated with different colors: (i) the Embden-Meyerhoff-Parnas pathway (EMP; orange); (ii) the pentose phosphate pathway (PPP; green); (iii) the Entner-Doudoroff pathway (EDP; purple); (iv) the tricarboxylic acid cycle (TCA; blue) and glyoxylate shunt (red); (v) anaplerotic and gluconeogenic reactions (yellow); and (vi) the 2MCC (pink). The 2MCC operon arrangement (inset, gray underline) consists of genes that encode a transcriptional regulator (designated here as prpR), which is thought to encode a ligand-responsive repressor, a methylcitrate synthase (prpC), which condenses propionyl-CoA (PrCoA) with oxaloacetate (OAA) to form 2-methylcitrate (2-MC), a 2-methylcitrate dehydratase/hydratase (prpD), which dehydrates 2-MC to yield 2-methylaconitate (2-MCA), a 2-methylcitrate dehydratase (acnD) and 2-methylaconitate cis-trans isomerase (prpF), which provide an alternative route for the generation of 2-MCA from 2-MC (the reason for an alternative route for 2-MCA generation in Pa is currently unclear), and a 2-methylisocitrate lyase (prpB), which cleaves 2-methylisocitrate (2-MIC) to yield pyruvate (PYR) and succinate (SUC). Note that the 2-MCA generated in the PrpD or AcnD/PrpF reactions is rehydrated by an unlinked aconitase (likely AcnB in Pa) to yield the PrpB substrate 2-MIC. Also, the enzyme responsible for the initial activation of propionate to yield PrCoA has not yet been identified for Pa, although in other organisms this function is carried out by a dedicated propionyl-CoA synthase (PrpE), by acetyl-CoA synthase (AcsA), by a combination of phosphotransacetylase (Pta) and acetate kinase (AckA) activities, or by an additional, uncharacterized propionyl-CoA ligase (7). AcCoA, acetyl-coenzyme A; CIT, citrate; ICIT, isocitrate; AKG, α-ketoglutarate; FUM, fumarate; MAL, malate; KDPG, 2-keto-3-deoxy-6-phosphogluconate; G3P, glyceraldehyde 3-phosphate; FBP, fructose 1,6-bisphosphate; F6P, fructose 6-phosphate; G6P, glucose 6-phosphate; 6PG, 6-phosphogluconate; Ri5P, ribulose 5-phosphate; R5P, ribose 5-phosphate; X5P, xylulose 5-phosphate; S7P, sedoheptulose 7-phosphate; E4P, erythrose 4-phosphate; PEP, phosphoenolpyruvate. (B) Illustration of the statistically significant proteomic changes (P ≤ 0.05, fold change of ≥1) during growth on propionate or succinate, as represented by Voronoi tessellations. Pathway assignment was performed using the KEGG data set. Proteome alterations that could not be assigned to a specific pathway (uncharacterised/hypothetical proteins) are shown as “Not Mapped.” The specific protein identities for the protein clusters that were upregulated during growth on propionate are shown in Fig. S1A in the supplemental material, and statistical analyses of these data are illustrated in Fig. S1B to D. The complete proteomics data set is presented in Data Set S1.CC BY · PubMed Central
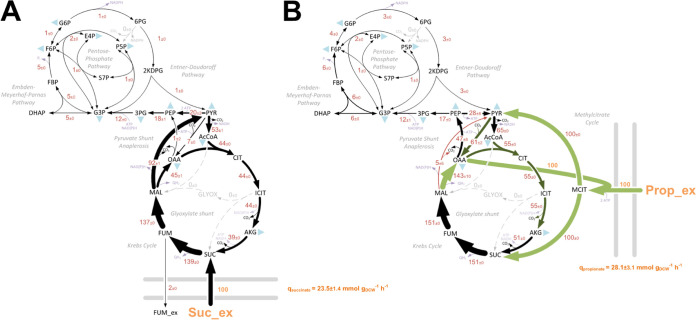
FIG 2 (A and B) In vivo carbon flux distributions in central metabolism of Pa PAO1 during growth on succinate (A) or propionate (B) as sole carbon sources. Flux is expressed as a molar percentage of the average uptake rate for succinate (23.5 mmol g−1 h−1) or propionate (28.1 mmol g−1 h−1), calculated from the individual rates in Data Set S2 in the supplemental material. Anabolic pathways from 11 precursors to biomass are indicated by the filled blue triangles. The flux distributions with bidirectional resolution (i.e., net and exchange fluxes), including the drain from metabolic intermediates to biomass and confidence intervals of the flux estimates, are provided in Data Set S2. The errors given for each flux reflect the corresponding 90% confidence intervals. The full flux data sets are presented in Data Set S2. Colors qualitatively indicate fluxomic correlation with changes on the protein level during growth on propionate compared with growth on succinate (light green or red, significant up- or downregulation (respectively); dark green or red, less significant up- or downregulation).
FIG 2 (A and B) In vivo carbon flux distributions in central metabolism of Pa PAO1 during growth on succinate (A) or propionate (B) as sole carbon sources. Flux is expressed as a molar percentage of the average uptake rate for succinate (23.5 mmol g−1 h−1) or propionate (28.1 mmol g−1 h−1), calculated from the individual rates in Data Set S2 in the supplemental material. Anabolic pathways from 11 precursors to biomass are indicated by the filled blue triangles. The flux distributions with bidirectional resolution (i.e., net and exchange fluxes), including the drain from metabolic intermediates to biomass and confidence intervals of the flux estimates, are provided in Data Set S2. The errors given for each flux reflect the corresponding 90% confidence intervals. The full flux data sets are presented in Data Set S2. Colors qualitatively indicate fluxomic correlation with changes on the protein level during growth on propionate compared with growth on succinate (light green or red, significant up- or downregulation (respectively); dark green or red, less significant up- or downregulation).CC BY · PubMed Central
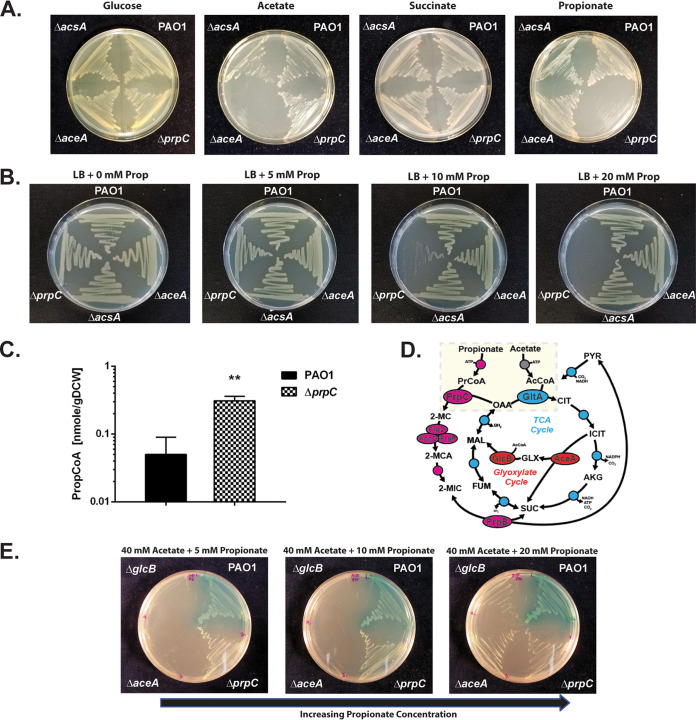
FIG 3 The Pa ORF (prpC) encoding 2-methylcitrate synthase is essential for growth on propionate. (A) Wild-type Pa (PAO1) and the ΔacsA, ΔaceA, and ΔprpC mutants all grow comparably on MOPS agar containing glucose (20 mM) or succinate (30 mM) as a sole carbon source. The ΔacsA mutant has a growth defect during growth on MOPS-acetate (40 mM) and MOPS-propionate (40 mM). The ΔprpC mutant cannot grow on MOPS propionate. The plates were photographed after 24 h of incubation. (B) Wild-type PAO1 and the ΔacsA, ΔaceA, and ΔprpC mutants were cultured on LB agar containing an increasing concentration of propionate (0, 5, 10, and 20 mM, as indicated). The ΔprpC mutant displays a pronounced growth defect in the presence of propionate concentrations of >10 mM. The plates were photographed after 24 h of incubation. (C) Intracellular propionyl-CoA concentration in wild-type Pa (PAO1) and in the ΔprpC mutant following a 3-h exposure to propionate (5 mM) during growth in succinate (unpaired t test with Welch’s correction, P = 0.0026). The experiment was performed using biological triplicates. (D) Illustration of the interwoven reactions for propionate and acetate activation in Pa, feeding into the 2-methylcitrate cycle and TCA cycle, respectively. Following uptake, acetate and propionate are activated by AcsA. The resulting propionyl-CoA (PrCoA) is condensed with oxaloacetate (OAA) in a PrpC-catalyzed reaction to form 2-methylcitrate (2-MC), whereas the acetyl-CoA (AcCoA) is condensed with oxaloacetate in a GltA-catalyzed reaction to form citrate (CIT). (E) Growth of the Pa glyoxylate shunt mutants ΔaceA and ΔglcB is blocked on MOPS agar plates containing a combination of high acetate concentration (40 mM) and low propionate concentration (5 mM) as the carbon source. However, this growth inhibition is partially overcome by increasing the propionate concentration to 20 mM (left to right in the figure). The plates were photographed after 48 h of growth. The data are representative of two independent experiments, each performed in triplicate.
FIG 3 The Pa ORF (prpC) encoding 2-methylcitrate synthase is essential for growth on propionate. (A) Wild-type Pa (PAO1) and the ΔacsA, ΔaceA, and ΔprpC mutants all grow comparably on MOPS agar containing glucose (20 mM) or succinate (30 mM) as a sole carbon source. The ΔacsA mutant has a growth defect during growth on MOPS-acetate (40 mM) and MOPS-propionate (40 mM). The ΔprpC mutant cannot grow on MOPS propionate. The plates were photographed after 24 h of incubation. (B) Wild-type PAO1 and the ΔacsA, ΔaceA, and ΔprpC mutants were cultured on LB agar containing an increasing concentration of propionate (0, 5, 10, and 20 mM, as indicated). The ΔprpC mutant displays a pronounced growth defect in the presence of propionate concentrations of >10 mM. The plates were photographed after 24 h of incubation. (C) Intracellular propionyl-CoA concentration in wild-type Pa (PAO1) and in the ΔprpC mutant following a 3-h exposure to propionate (5 mM) during growth in succinate (unpaired t test with Welch’s correction, P = 0.0026). The experiment was performed using biological triplicates. (D) Illustration of the interwoven reactions for propionate and acetate activation in Pa, feeding into the 2-methylcitrate cycle and TCA cycle, respectively. Following uptake, acetate and propionate are activated by AcsA. The resulting propionyl-CoA (PrCoA) is condensed with oxaloacetate (OAA) in a PrpC-catalyzed reaction to form 2-methylcitrate (2-MC), whereas the acetyl-CoA (AcCoA) is condensed with oxaloacetate in a GltA-catalyzed reaction to form citrate (CIT). (E) Growth of the Pa glyoxylate shunt mutants ΔaceA and ΔglcB is blocked on MOPS agar plates containing a combination of high acetate concentration (40 mM) and low propionate concentration (5 mM) as the carbon source. However, this growth inhibition is partially overcome by increasing the propionate concentration to 20 mM (left to right in the figure). The plates were photographed after 48 h of growth. The data are representative of two independent experiments, each performed in triplicate.CC BY · PubMed Central
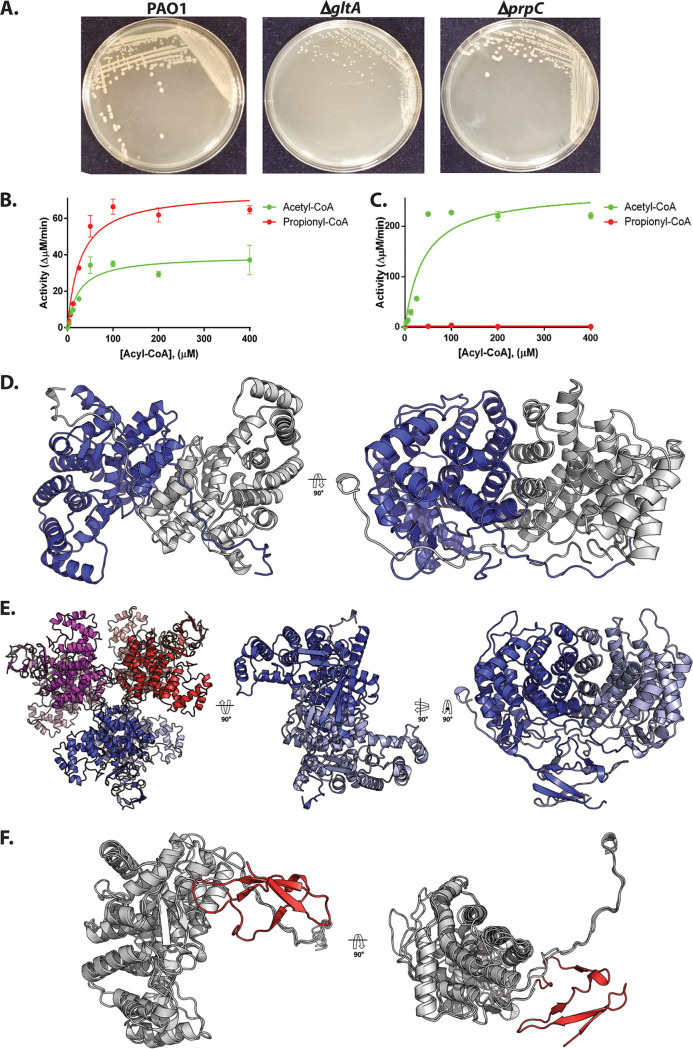
FIG 4 Biochemical and structural analysis of PrpC and GltA from Pa. (A) A ΔgltA mutant exhibits a growth defect when cultured on LB agar, whereas a ΔprpC mutant displays a wild-type colony morphotype. The plates were photographed after 48 h. The data are representative of two independent experiments, each performed in triplicate. (B) Purified PrpCPa exhibits both citrate synthase activity (with acetyl-CoA as a substrate) and 2-methylcitrate synthase activity (with propionyl-CoA as a substrate). The concentration of OAA in each reaction was fixed at 0.5 mM. The data are representative of two independent experiments, each performed in triplicate. (C) Purified GltAPa is a citrate synthase with no detectable 2-methylcitrate synthase activity. The concentration of OAA was fixed at 0.5 mM. The data are representative of two independent experiments, each performed in triplicate. (D) The X-ray crystal structure of PrpCPa (PDB: 6S6F). PrpCPa is a homodimer. In the ribbon diagram shown, the protomers are colored blue and gray. (E) Cartoon representation of the GltAPa hexamer in the asymmetric unit (left) and, for comparison with PrpCPa, the extracted GltAPa dimers (middle and right). (F) Superposition of the PrpCPa and GltAPa structures. PrpCPa and GltAPa share similar core α-helical folds (shown in gray to highlight similarities). However, GltAPa has an additional antiparallel β-sheet at its N terminus (colored in red to showcase differences).
FIG 4 Biochemical and structural analysis of PrpC and GltA from Pa. (A) A ΔgltA mutant exhibits a growth defect when cultured on LB agar, whereas a ΔprpC mutant displays a wild-type colony morphotype. The plates were photographed after 48 h. The data are representative of two independent experiments, each performed in triplicate. (B) Purified PrpCPa exhibits both citrate synthase activity (with acetyl-CoA as a substrate) and 2-methylcitrate synthase activity (with propionyl-CoA as a substrate). The concentration of OAA in each reaction was fixed at 0.5 mM. The data are representative of two independent experiments, each performed in triplicate. (C) Purified GltAPa is a citrate synthase with no detectable 2-methylcitrate synthase activity. The concentration of OAA was fixed at 0.5 mM. The data are representative of two independent experiments, each performed in triplicate. (D) The X-ray crystal structure of PrpCPa (PDB: 6S6F). PrpCPa is a homodimer. In the ribbon diagram shown, the protomers are colored blue and gray. (E) Cartoon representation of the GltAPa hexamer in the asymmetric unit (left) and, for comparison with PrpCPa, the extracted GltAPa dimers (middle and right). (F) Superposition of the PrpCPa and GltAPa structures. PrpCPa and GltAPa share similar core α-helical folds (shown in gray to highlight similarities). However, GltAPa has an additional antiparallel β-sheet at its N terminus (colored in red to showcase differences).CC BY · PubMed Central
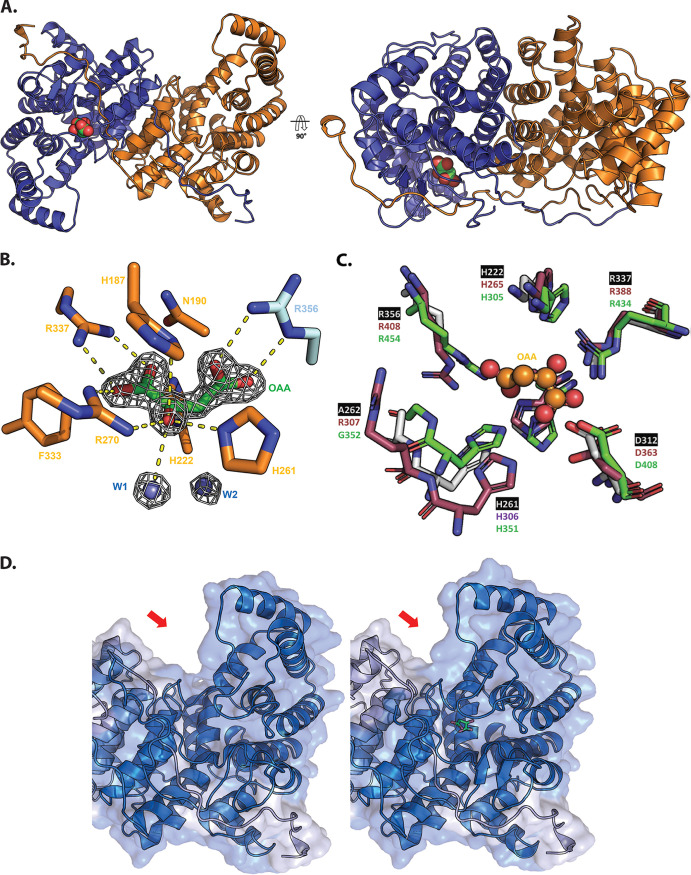
FIG 5 Structural analysis of oxaloacetate-bound PrpCPa. (A) Crystal structure of oxaloacetate-bound PrpCPa represented in cartoon (PDB: 6S87). One protomer is colored blue and the other orange. A 90° rotation about the x axis is shown (right). Oxaloacetate is shown as green and red spheres. (B) Oxaloacetate binding site from P. aeruginosa PrpC chain D. Water molecules are shown in cyan spheres. Chain D and chain C residues are shown in orange and cyan, respectively. The electron density map (2Fo-Fc) in white is contoured at 1.5σ. (C) Superposition of the PrpCPa (white), GltAPa (pink), and A. fumigatus PrpC (5UQR) (green) oxaloacetate binding site. Oxaloacetate is shown in orange spheres. Most of the amino acid residues forming this site are conserved, except R307 (GltAPa numbering). (D) The left-hand image shows the open (red) apo conformation of PrpCPa, the middle image shows the partially closed (blue) holo conformation of PrpCPa, and the right-hand image shows a superposition of both conformations of PrpCPa. Note the structural rearrangement in the oxaloacetate-bound PrpCPa protomer (indicated by the red arrow).
FIG 5 Structural analysis of oxaloacetate-bound PrpCPa. (A) Crystal structure of oxaloacetate-bound PrpCPa represented in cartoon (PDB: 6S87). One protomer is colored blue and the other orange. A 90° rotation about the x axis is shown (right). Oxaloacetate is shown as green and red spheres. (B) Oxaloacetate binding site from P. aeruginosa PrpC chain D. Water molecules are shown in cyan spheres. Chain D and chain C residues are shown in orange and cyan, respectively. The electron density map (2Fo-Fc) in white is contoured at 1.5σ. (C) Superposition of the PrpCPa (white), GltAPa (pink), and A. fumigatus PrpC (5UQR) (green) oxaloacetate binding site. Oxaloacetate is shown in orange spheres. Most of the amino acid residues forming this site are conserved, except R307 (GltAPa numbering). (D) The left-hand image shows the open (red) apo conformation of PrpCPa, the middle image shows the partially closed (blue) holo conformation of PrpCPa, and the right-hand image shows a superposition of both conformations of PrpCPa. Note the structural rearrangement in the oxaloacetate-bound PrpCPa protomer (indicated by the red arrow).CC BY · PubMed Central
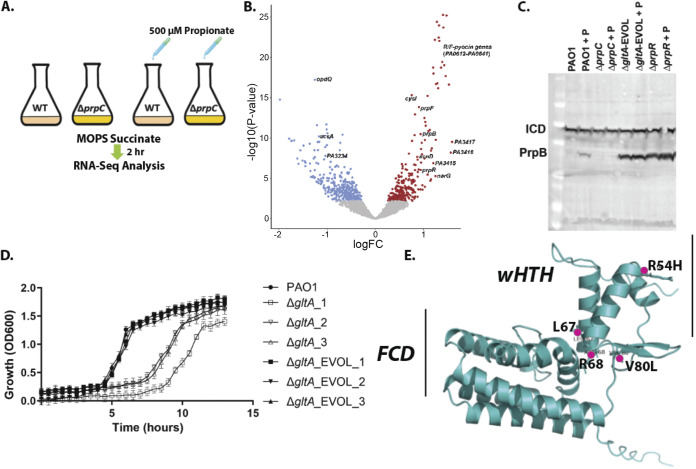
FIG 6 RNA-seq analysis uncovers that propionate exposure induces expression of the prp operon and of the genes associated with branched-chain amino acid catabolism in Pa. (A) Schematic of the experimental design. At an OD of 0.2, 500 μM sodium propionate was spiked into (triplicate) cultures of PAO1 and the ΔprpC mutant. An equal volume of H2O was added to the control PAO1 and ΔprpC-mutant cultures (also grown in triplicate). The cultures were harvested 2 h after the propionate addition, corresponding to an OD600 of ≅0.6 (exponential growth), and RNA-seq analysis was carried out. (B) Volcano plot illustrating the log2 fold change in transcript abundance versus adjusted P values for wild-type PAO1 grown in MOPS-succinate versus wild-type PAO1 grown in MOPS-succinate + 500 μM propionate. Transcripts that are significantly (q < 0.05) increased (red) or decreased (blue) in abundance are indicated. Selected transcripts are labeled. (C) Western blot showing protein expression levels of PrpB (32.1 kDa) in PAO1 and in the ΔprpC mutant, the ΔgltA_EVOL mutant, and the ΔprpR mutant after exposure to 4 mM propionate (+P) for 3 h. Isocitrate dehydrogenase (ICD; 45.6 kDa) served as loading control. Note that the ΔgltA_EVOL and ΔprpR mutants display constitutively active PrpB expression, independent of propionate addition. Data are representative of three independent experiments. (D) Growth of ΔgltA and ΔgltA_EVOL1 to 3 mutants compared with PAO1 in MOPS-acetate medium. The data are representative of three independent experiments, each performed in triplicate. (E) AlphaFold model of PrpR with the locations of the residues mutated and/or deleted in the ΔgltA_EVOL_1 to 3 mutants highlighted. The winged helix-turn-helix (wHTH) motif and the GntR family FadR C-terminal domain (FCD) are shown.
FIG 6 RNA-seq analysis uncovers that propionate exposure induces expression of the prp operon and of the genes associated with branched-chain amino acid catabolism in Pa. (A) Schematic of the experimental design. At an OD of 0.2, 500 μM sodium propionate was spiked into (triplicate) cultures of PAO1 and the ΔprpC mutant. An equal volume of H2O was added to the control PAO1 and ΔprpC-mutant cultures (also grown in triplicate). The cultures were harvested 2 h after the propionate addition, corresponding to an OD600 of ≅0.6 (exponential growth), and RNA-seq analysis was carried out. (B) Volcano plot illustrating the log2 fold change in transcript abundance versus adjusted P values for wild-type PAO1 grown in MOPS-succinate versus wild-type PAO1 grown in MOPS-succinate + 500 μM propionate. Transcripts that are significantly (q < 0.05) increased (red) or decreased (blue) in abundance are indicated. Selected transcripts are labeled. (C) Western blot showing protein expression levels of PrpB (32.1 kDa) in PAO1 and in the ΔprpC mutant, the ΔgltA_EVOL mutant, and the ΔprpR mutant after exposure to 4 mM propionate (+P) for 3 h. Isocitrate dehydrogenase (ICD; 45.6 kDa) served as loading control. Note that the ΔgltA_EVOL and ΔprpR mutants display constitutively active PrpB expression, independent of propionate addition. Data are representative of three independent experiments. (D) Growth of ΔgltA and ΔgltA_EVOL1 to 3 mutants compared with PAO1 in MOPS-acetate medium. The data are representative of three independent experiments, each performed in triplicate. (E) AlphaFold model of PrpR with the locations of the residues mutated and/or deleted in the ΔgltA_EVOL_1 to 3 mutants highlighted. The winged helix-turn-helix (wHTH) motif and the GntR family FadR C-terminal domain (FCD) are shown.CC BY · PubMed Central
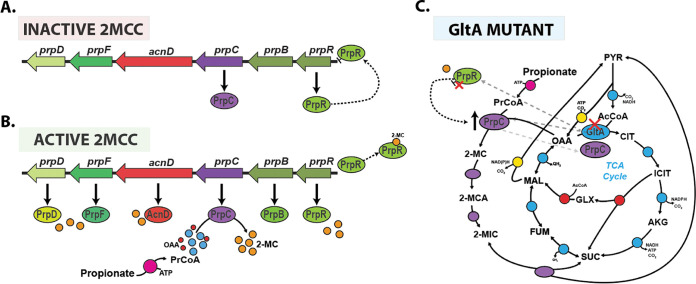
FIG 7 Model for the operation of the 2MCC in Pa. (A) During growth in the absence of propionate or propionyl-CoA generating substrates, the 2MCC operon (prp) expression is repressed through the binding of PrpR to its upstream promoter region. Incomplete repression of the operon (from basal cellular propionyl-CoA or competing transcriptional activators) results in a basal, low level of prpC transcription. (B) As the cellular propionyl-CoA levels rise, this metabolite is condensed with oxaloacetate by PrpC, resulting in the formation of 2-MC; 2-MC likely then binds to PrpR, inducing conformational changes that lead to the dissociation of PrpR from the DNA. This derepresses the prp operon, allowing expression of the 2MCC enzymes. However, as the concentration of propionyl-CoA falls (due to depletion of propionate or BCAAs due to 2MCC activity) so too does the concentration of 2-MC, which, in turn, leads to rebinding of PrpR to the prp promoter region and a resumption in prp operon repression. (C) In the absence of citrate synthase (GltA), Pa can survive because of the low-level basal expression of PrpC, a promiscuous enzyme that also has citrate synthase activity. However, this low total citrate synthase activity is unable to meet cellular demand, resulting in a severe growth defect and a strong selection pressure to acquire mutations that increase prpC expression. Based on our work, it seems that mutations in prpR that abolish its repressor activity are the most commonly selected mechanism for achieving this. These mutations lead to constitutive expression of the prp genes and, thus, an increase total cellular citrate synthase activity (compensating for the loss of GltA activity).
FIG 7 Model for the operation of the 2MCC in Pa. (A) During growth in the absence of propionate or propionyl-CoA generating substrates, the 2MCC operon (prp) expression is repressed through the binding of PrpR to its upstream promoter region. Incomplete repression of the operon (from basal cellular propionyl-CoA or competing transcriptional activators) results in a basal, low level of prpC transcription. (B) As the cellular propionyl-CoA levels rise, this metabolite is condensed with oxaloacetate by PrpC, resulting in the formation of 2-MC; 2-MC likely then binds to PrpR, inducing conformational changes that lead to the dissociation of PrpR from the DNA. This derepresses the prp operon, allowing expression of the 2MCC enzymes. However, as the concentration of propionyl-CoA falls (due to depletion of propionate or BCAAs due to 2MCC activity) so too does the concentration of 2-MC, which, in turn, leads to rebinding of PrpR to the prp promoter region and a resumption in prp operon repression. (C) In the absence of citrate synthase (GltA), Pa can survive because of the low-level basal expression of PrpC, a promiscuous enzyme that also has citrate synthase activity. However, this low total citrate synthase activity is unable to meet cellular demand, resulting in a severe growth defect and a strong selection pressure to acquire mutations that increase prpC expression. Based on our work, it seems that mutations in prpR that abolish its repressor activity are the most commonly selected mechanism for achieving this. These mutations lead to constitutive expression of the prp genes and, thus, an increase total cellular citrate synthase activity (compensating for the loss of GltA activity).CC BY · PubMed Central

Verification

Claims the paper makes

The claims and statistics of this paper haven’t been checked yet.

Run the check — free, no account needed. It reads the open-access text and checks the sources it cites.

A few free checks a day · papers already verified open instantly · results are public

Self-check

Percentages, sums and reported differences re-computed from the paper’s own numbers.

The self-check needs the paper’s full text.

Citations

Cites

Show all 1 references

Research works printed but not linked: 105

  1. 2020, Pseudomonas aeruginosa adaptation and evolution in patients with cystic fibrosis, Nature Reviews Microbiology 2020 19:5, 19, 331
  2. 10.1073/pnas.0910308106 · DOI
  3. 10.1371/journal.pone.0103778 · DOI
  4. 10.1128/JB.187.15.5267-5277.2005 · DOI
  5. 10.1371/journal.ppat.1005846 · DOI
  6. 6. Koh A , De Vadder F , Kovatcheva-Datchary P , Bäckhed F. 2016. From dietary fiber to host physiology: Short-chain fatty acids as key bacterial metabolites. Cell. Cell Press https://doi.org/10.1016/j.cell.2016.05.041. · DOI · Paper page
  7. Dolan SK , Wijaya A , Geddis SM , Spring DR , Silva-Rocha R , Welch M . 2018. Loving the poison: The methylcitrate cycle and bacterial pathogenesis. Microbiology (United Kingdom) 164. · DOI
  8. 10.1111/j.1365-2958.2006.05155.x · DOI
  9. 10.1111/mmi.12664 · DOI
  10. 2008, Methylcitrate synthase from Aspergillus fumigatus is essential for manifestation of invasive aspergillosis, Cellular Microbiology, 10, 134
  11. 10.1016/j.tim.2011.04.003 · DOI
  12. 2020, Methylcitrate cycle gene MCD is essential for the virulence of Talaromyces marneffei, Medical Mycology, 58, 351, 10.1093/mmy/myz063 · DOI
  13. 10.1371/journal.ppat.1002813 · DOI
  14. 10.1099/13500872-145-6-1381 · DOI
  15. 10.1046/j.1432-1327.2001.02262.x · DOI
  16. 10.1128/JB.00163-12 · DOI
  17. 10.1002/(SICI)1521-1878(199802)20:2<181::AID-BIES10>3.0.CO;2-0 · DOI
  18. 10.1073/pnas.1314810111 · DOI
  19. 2009, Visualizing gene expression data via voronoi treemaps, 6th International Symposium on Voronoi Diagrams in Science and Engineering, ISVD, 2009, 233
  20. 10.1016/j.ymben.2019.01.008 · DOI
  21. 10.1128/AEM.01564-06 · DOI
  22. 10.1099/mic.0.2007/011239-0 · DOI
  23. 10.1074/jbc.RA119.009156 · DOI
  24. 10.1128/jb.172.12.7151-7156.1990 · DOI
  25. 10.1016/j.femsre.2004.11.002 · DOI
  26. 10.1074/jbc.RA118.004514 · DOI
  27. Dolan SK , Kohlstedt M , Trigg S , Vallejo Ramirez P , Kaminski CF , Wittmann C , Welch M . 2020. Contextual Flexibility in Pseudomonas aeruginosa Central Carbon Metabolism during Growth in Single Carbon Sources. mBio 11. · DOI
  28. 10.1016/0006-291X(81)91715-0 · DOI
  29. 1984, Uncoupling by Acetic Acid Limits Growth of and Acetogenesis by Clostridium thermoaceticum, Applied and Environmental Microbiology, 48, 1134, 10.1128/aem.48.6.1134-1139.1984 · DOI
  30. 10.1371/journal.pone.0177825 · DOI
  31. 10.1128/JB.185.21.6448-6455.2003 · DOI
  32. 10.1128/JB.01615-14 · DOI
  33. 10.1128/JB.05074-11 · DOI
  34. 10.1111/1462-2920.13434 · DOI
  35. Massey LK , Sokatch JR , Conrad RS . 1976. Branched chain amino acid catabolism in bacteria. Bacteriological Reviews. American Society for Microbiology (ASM) https://doi.org/10.1128/mmbr.40.1.42-54.1976. · DOI
  36. Steeles MI , Lorenzj D , Hatter K , Parkt A , Sokatchs JR. 1992. Characterization of the mmsAB Operon of Pseudomonas aeruginosa P A 0 Encoding Methylmalonate-semialdehyde Dehydrogenase and 3-Hydroxyisobutyrate Dehydrogenase. · DOI
  37. 10.1016/S0065-2911(08)60006-5 · DOI
  38. 10.1074/jbc.M100244200 · DOI
  39. 10.1111/j.1432-1033.2004.04255.x · DOI
  40. 10.1016/j.bbrc.2003.09.193 · DOI
  41. 10.1021/acs.biochem.7b00778 · DOI
  42. 10.1099/00221287-144-4-929 · DOI
  43. 1999, Salmonella typhimurium LT2 Catabolizes Propionate via the 2-Methylcitric Acid Cycle Salmonella typhimurium LT2 Catabolizes Propionate via the 2-Methylcitric Acid Cycle, 181, 5615
  44. 2003, Insights into the evolution of allosteric properties. The NADH binding site of hexameric type II citrate synthases, Biochemistry, 42, 5555, 10.1021/bi020622s · DOI
  45. 2011, Crystal structure of Salmonella typhimurium 2- methylcitrate synthase: Insights on domain movement and substrate specificity, Journal of Structural Biology, 174, 58, 10.1016/j.jsb.2010.10.008 · DOI
  46. 10.1128/JB.01301-09 · DOI
  47. 1973, Half-site reactivity and the “induced-fit” hypothesis, Journal of Molecular Biology, 74, 73, 10.1016/0022-2836(73)90356-2 · DOI
  48. 10.1128/jb.171.10.5542-5550.1989 · DOI
  49. 10.1016/0022-2836(84)90373-5 · DOI
  50. 10.1016/0022-2836(82)90452-1 · DOI
  51. 10.1111/mmi.14362 · DOI
  52. 10.1074/jbc.M112.442814 · DOI
  53. 10.1007/s00203-010-0593-5 · DOI
  54. Badal D , Jayarani AV , Kollaran MA , Prakash D, P M , Singh V . 2021. Foraging Signals Promote Swarming in Starving Pseudomonas aeruginosa. mBio https://doi.org/10.1128/MBIO.02033-21. · DOI
  55. 10.1111/j.1574-6976.2010.00218.x · DOI
  56. Sonnleitner E , Valentini M , Wenner N , Haichar F el Z , Haas D , Lapouge K . 2012. Novel Targets of the CbrAB/Crc Carbon Catabolite Control System Revealed by Transcript Abundance in Pseudomonas aeruginosa. PLoS ONE 7:e44637. · DOI
  57. 10.1021/bi500871a · DOI
  58. 10.1016/j.jbiotec.2011.09.009 · DOI
  59. 10.1128/AEM.71.11.6856-6862.2005 · DOI
  60. 10.1093/nar/gkz724 · DOI
  61. 10.1093/NAR/GKAB1061 · DOI · Paper page
  62. Tummler K , Zimmermann M , Schubert OT , Aebersold R , Kühn C , Sauer U , Klipp E. 2018. Two parallel pathways implement robust propionate catabolism and detoxification in mycobacteria. bioRxiv 258947. · DOI
  63. 10.1371/journal.ppat.1004679 · DOI
  64. 10.1073/pnas.1900570116 · DOI
  65. 10.1073/pnas.1419677112 · DOI · Paper page
  66. Lopatkin AJ , Bening SC , Manson AL , Stokes JM , Kohanski MA , Badran AH , Earl AM , Cheney NJ , Yang JH , Collins JJ . 2021. Clinically relevant mutations in core metabolic genes confer antibiotic resistance. Science 371. · DOI
  67. Gil-Gil T , Corona F , Martínez JL , Bernardini A . 2020. The Inactivation of Enzymes Belonging to the Central Carbon Metabolism Is a Novel Mechanism of Developing Antibiotic Resistance. mSystems 5. · DOI
  68. 10.1016/j.chembiol.2014.08.020 · DOI
  69. 10.1073/pnas.1414218112 · DOI
  70. 10.1038/35023079 · DOI
  71. LaBauve AE , Wargo MJ . 2012. Growth and laboratory maintenance of Pseudomonas aeruginosa. Curr Protoc Microbiol Chapter 6:Unit 6E.1. · DOI
  72. 10.1371/journal.pone.0088368 · DOI
  73. 10.1093/bioinformatics/btu170 · DOI · Paper page
  74. Liao Y , Smyth GK , Shi W . 2019. The R package Rsubread is easier, faster, cheaper and better for alignment and quantification of RNA sequencing reads. Nucleic Acids Research 47. · DOI
  75. 10.1186/s13059-014-0550-8 · DOI · Paper page
  76. 10.1093/bioinformatics/btr645 · DOI
  77. Smyth GK . 2005. limma: Linear Models for Microarray Data, p. 397–420. In Bioinformatics and Computational Biology Solutions Using R and Bioconductor. Springer-Verlag, New York. · DOI · Paper page
  78. Benjamini Y , Hochberg Y . 1995. Controlling the False Discovery Rate: A Practical and Powerful Approach to Multiple Testing. Journal of the Royal Statistical Society Series B (Methodological). WileyRoyal Statistical Society https://doi.org/10.2307/2346101. · DOI · Paper page
  79. 10.1038/nbt.1754 · DOI · Paper page
  80. 10.1186/s12866-017-1112-5 · DOI
  81. 2006, . mini-Tn7 insertion in bacteria with single attTn7 sites: example Pseudomonas aeruginosa, Nature Protocols, 1, 153, 10.1038/nprot.2006.24 · DOI
  82. Heath Damron F , McKenney ES , Barbier M , Liechti GW , Goldberg JB. 2013. Construction of Mobilizable Mini-Tn7 Vectors for Bioluminescent Detection and Single Copy Promoter lux Reporter Analysis in Gram-Negative Bacteria. CAMBRIDGE UNIVERSITY LIBRARY https://doi.org/10.1128/AEM.00640-13. · DOI
  83. 10.1186/1475-2859-6-6 · DOI
  84. 10.1016/j.ymben.2012.07.005 · DOI
  85. 10.1074/jbc.M115.687749 · DOI
  86. 10.1099/00221287-133-11-3159 · DOI
  87. 10.1099/00221287-148-12-3839 · DOI
  88. 2017, Reconstruction of the metabolic network of Pseudomonas aeruginosa to interrogate virulence factor synthesis, Nature Communications, 8, 14631, 10.1038/ncomms14631 · DOI
  89. 2017, Reconstruction of the metabolic network of Pseudomonas aeruginosa to interrogate virulence factor synthesis, Nature Communications, 8, 14631, 10.1038/ncomms14631 · DOI
  90. 10.1099/00221287-147-10-2671 · DOI
  91. 10.1111/j.1574-6968.1993.tb06012.x · DOI
  92. 2017, Pathway- Consensus Approach to Metabolic Network Reconstruction for Pseudomonas putida KT2440 by Systematic Comparison of Published Models, PLOS ONE, 12, e0169437, 10.1371/journal.pone.0169437 · DOI
  93. 2013, Reconciling in vivo and in silico key biological parameters of Pseudomonas putidaKT2440 during growth on glucose under carbon-limited condition, BMC Biotechnology, 13, 93, 10.1186/1472-6750-13-93 · DOI
  94. 2013, Reconciling in vivo and in silico key biological parameters of Pseudomonas putidaKT2440 during growth on glucose under carbon-limited condition, BMC Biotechnology, 13, 93, 10.1186/1472-6750-13-93 · DOI
  95. Srere PA , Brazil H , Gonen L . 1963. The Citrate Condensing Enzyme of Pigeon Breast Muscle and Moth Flight Muscle. ACTA Chemica Scandinavica. · DOI
  96. 10.1107/S0021889809045701 · DOI
  97. 10.1107/S0021889807021206 · DOI · Paper page
  98. 10.1107/S0907444911001314 · DOI
  99. 10.1107/S0907444912001308 · DOI · Paper page
  100. 10.1107/S0907444904019158 · DOI · Paper page
  101. 10.1107/S0021889809045701 · DOI
  102. 10.1107/S0907444911001314 · DOI
  103. 10.1107/S0907444912001308 · DOI · Paper page
  104. 10.1107/S0907444904019158 · DOI · Paper page
  105. 2020, A common approach for absolute quantification of short chain CoA thioesters in prokaryotic and eukaryotic microbes, Microbial Cell Factories 2020 19:1, 19, 1

Metadata

Authors
Dolan, S. K., Wijaya, A., Kohlstedt, M., Gläser, L., Brear, P., Silva-Rocha, R., Wittmann, C., & Welch, M.
Affiliations
  • Georgia Institute of Technology (US)
  • University of Dundee (GB)
  • Saarland University (DE)
  • University of Cambridge (GB)
Corresponding author
  • Dolan, Stephen K.
  • Welch, Martin
Venue
mBio
Publisher
openRxiv
Published
2022-08-25
Volume
13
Issue
6
Pages
e0254122-e0254122
ISSN
2150-7511 (ISSN-L)
OpenAlex
W4309048142
Cited by
21
References
1
Citations by year
2026: 2 · 2025: 6 · 2024: 9 · 2023: 4
FWCI
3.01
Type
journal article
Language
en
Open access
Licence
cc-by
Locations
  • mBio (publishedVersion, cc-by)
  • bioRxiv (Cold Spring Harbor Laboratory) (acceptedVersion, cc-by)
  • PubMed Central (publishedVersion, cc-by)
  • PubMed (publishedVersion)
  • Discovery Research Portal (University of Dundee) (submittedVersion, cc-by)
  • Apollo (University of Cambridge) (submittedVersion, cc-by)
  • DOAJ (DOAJ: Directory of Open Access Journals) (submittedVersion, cc-by-sa)
  • Apollo (cc-by)
Funders
  • UK Research and Innovation (BB/R005435/1/FAPESP, BB/M019411/1)
  • Deutsche Forschungsgemeinschaft (WI 1796/4-1)
  • Fundação de Amparo à Pesquisa do Estado de São Paulo
  • Bundesministerium für Bildung und Forschung (03V0757, FKZ 03V0757, 031B0344A, FKZ 031B0344A)
  • Directorate for Biological Sciences
  • Biotechnology and Biological Sciences Research Council (BB/R005435/1, BB/M019411/1, BB/R005435/1/FAPESP)
Topics
  • Life Sciences › Biochemistry, Genetics and Molecular Biology › Genetics › Bacterial Genetics and Biotechnology
  • Life Sciences › Biochemistry, Genetics and Molecular Biology › Molecular Biology › Microbial Metabolic Engineering and Bioproduction
  • Life Sciences › Biochemistry, Genetics and Molecular Biology › Molecular Biology › Bacterial biofilms and quorum sensing
Keywords
Pseudomonas aeruginosa, propionate metabolism, cellular prion protein, citrate synthase, moonlighting enzymes, bacterial metabolism, antibiotic resistance, opportunistic pathogens
MeSH terms
Citrate (si)-Synthase, Humans, Kinetics, Propionates, Pseudomonas aeruginosa, Pseudomonas Infections, Transcription Factors

About these checks

Registry, retraction, Cites and statistics results are computed, not judged, with one exception: a printed reference that no index lists is read once by a model before it counts as a citation error. Claims are extracted by a model and kept only when their quote appears verbatim in the text; each cited source is then checked, with a model’s help, for whether it says what the claim relies on. Those verdicts can be wrong — read the claim’s quote and the cited source before relying on one.

Statistics and arithmetic are recomputed, not judged.

Confidence bands are shown only for fields calibrated on our annotated test set. None is calibrated yet, so no band is shown.

What counts as a claim ›How we measure confidence ›How we check this ›

Are you an author, or do you see a problem with this page? Request a review

How to cite

Cite CoChat for the checks on this page, and the paper for its own findings.

This page
CoChat. (2026). Citation check: Systems-wide dissection of organic acid assimilation in Pseudomonas aeruginosa reveals a novel path to underground metabolism. https://app.cochat.ai/papers/10.1101/2022.08.25.505149
The paper
Dolan, S. K., Wijaya, A., Kohlstedt, M., Gläser, L., Brear, P., Silva-Rocha, R., Wittmann, C., & Welch, M. (2022). Systems-wide dissection of organic acid assimilation in Pseudomonas aeruginosa reveals a novel path to underground metabolism. mBio. https://doi.org/10.1101/2022.08.25.505149