PreprintCited by 2

The DOI matches its Crossref record; 6 of the 6 references it cites were found in a registry or an index.

Codon affinity in mitochondrial DNA shapes evolutionary and somatic fitness

Lareau, Caleb A., Yin, Yajie, Gutierrez, Jacob C., Dhindsa, Ryan S., Gribling-Burrer, Anne-Sophie, Hsieh, Yu-Hsin, Nitsch, Lena, Buquicchio, Frank A., Abay, Tsion, Zielinski, Sebastian, Stickels, Robert R., Ulirsch, Jacob C., Yan, Patrick, Wang, Fangyi, Miao, Zhuang, Sandor, Katalin, Daniel, Bence, Liu, Vincent, Wang, Quanli, Hu, Fengyuan, Smith, Katherine R., Deevi, Sri V.V., Maschmeyer, Patrick, Petrovski, Slavé, Smyth, Redmond P., Greenleaf, William J., Kundaje, Anshul, Munschauer, Mathias, Ludwig, Leif S., Satpathy, Ansuman T.·2023

Abstract

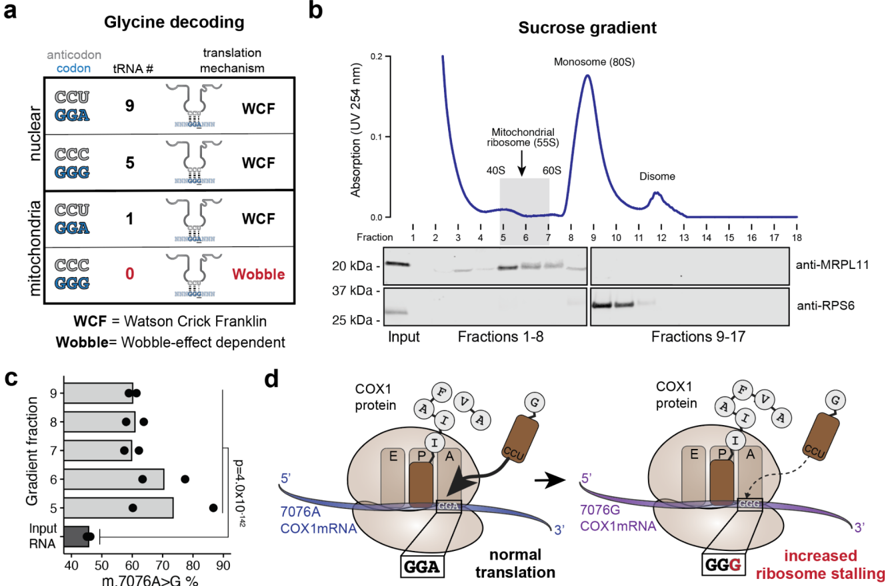
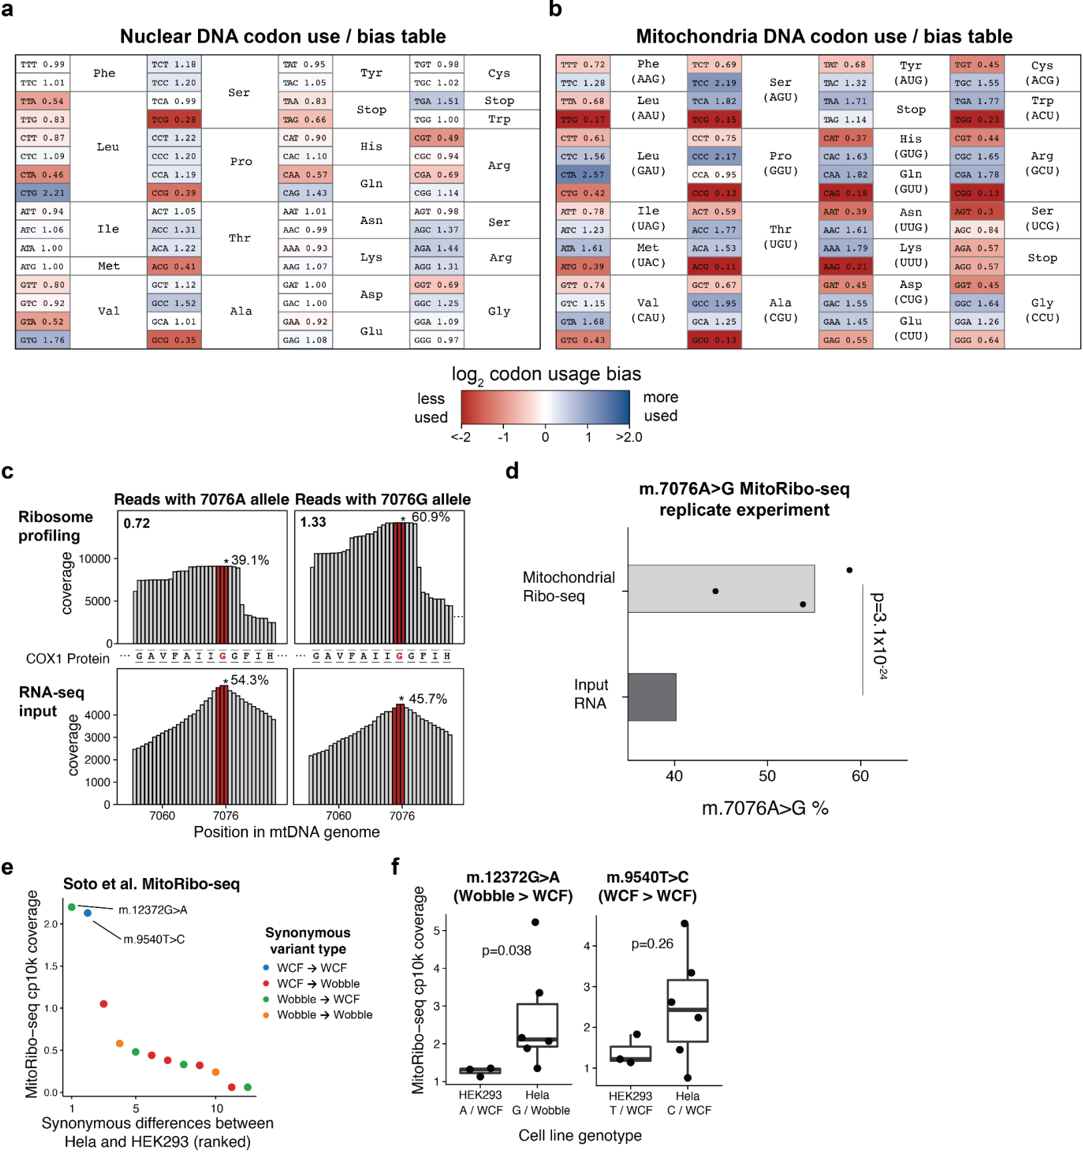
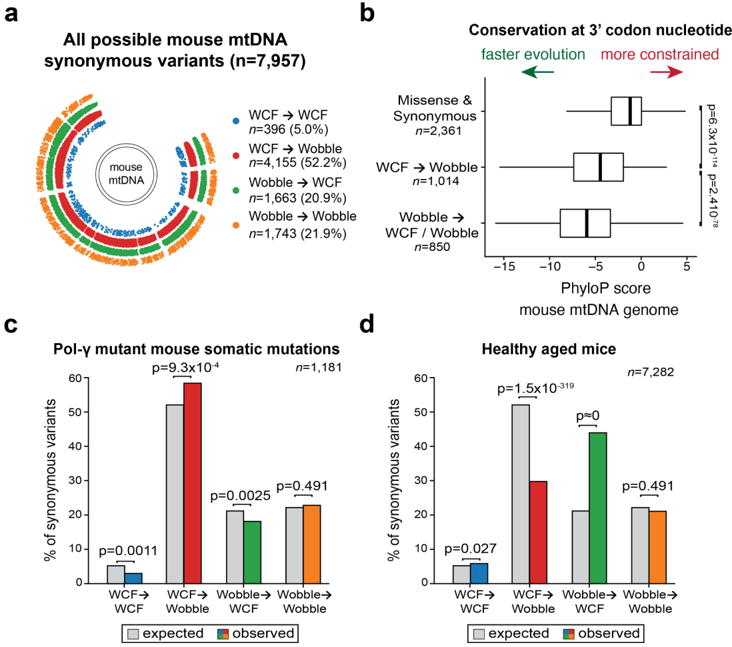
Summary Paragraph: Somatic variation contributes to biological heterogeneity by modulating cellular proclivity to differentiate, expand, adapt, or die. While large-scale sequencing efforts have revealed the foundational role of somatic variants to drive human tumor evolution, our understanding of the contribution of mutations to modulate cellular fitness in non-malignant contexts remains understudied. Here, we identify a mosaic synonymous variant (m.7076A>G) in the mitochondrial DNA (mtDNA) encoded cytochrome c-oxidase subunit 1 gene ( MT-CO1 , p.Gly391=), which was present at homoplasmy in 47% of immune cells from a healthy donor. Using single-cell multi-omics, we discover highly specific selection against the m.7076G mutant allele in the CD8 + effector memory T cell compartment in vivo , reminiscent of selection observed for pathogenic mtDNA alleles 1, 2 and indicative of lineage-specific metabolic requirements. While the wildtype m.7076A allele is translated via Watson-Crick-Franklin base-pairing, the anticodon diversity of the mitochondrial transfer RNA pool is limited, requiring wobble-dependent translation of the m.7076G mutant allele. Notably, mitochondrial ribosome profiling revealed altered codon-anticodon affinity at the wobble position as evidenced by stalled translation of the synonymous m.7076G mutant allele encoding for glycine. Generalizing this observation, we provide a new ontogeny of the 8,482 synonymous variants in the human mitochondrial genome that enables interpretation of functional mtDNA variation. Specifically, via inter- and intra-species evolutionary analyses, population-level complex trait associations, and the occurrence of germline and somatic mtDNA mutations from large-scale sequencing studies, we demonstrate that synonymous variation impacting codon:anticodon affinity is actively evolving across the entire mitochondrial genome and has broad functional and phenotypic effects. In summary, our results introduce a new ontogeny for mitochondrial genetic variation and support a model where organismal principles can be discerned from somatic evolution via single-cell genomics.

Overview

The claims and statistics of this paper haven’t been checked yet.

Run the check — free, no account needed. It reads the open-access text and checks the sources it cites.

A few free checks a day · papers already verified open instantly · results are public

Integrity signals

Registry

Crossref · 10.1101/2023.04.23.537997

Cites

6 of 6 references verified0 citation errors · 0 not checkable

Statistics

Figures

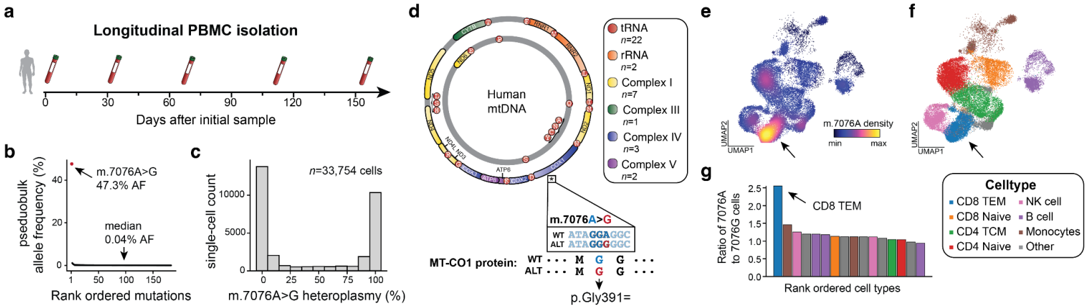
Figure 1 Identification of a mosaic synonymous mtDNA variant with a CD8 + T-cell restricted selection bias. (a) Schematic of longitudinal peripheral blood samples obtained from a healthy donor. A total of 5 draws spanning 150 days were taken and processed with the mtscATAC-seq assay. (b) Summary of somatic mtDNA mutations called from aggregated draws. The overall median heteroplasmy is noted, as well as the m.7076A>G allele that is present at a 47.3% pseudobulk heteroplasmy. (c) Distribution of single-cell heteroplasmy across all cells profiled for the m.7076A>G allele. (d) Schematic of the mitochondrial genome with genes contributing to indicated complexes of the respiratory chain (I, III, IV, and V) being color-coded. The asterisk under the MT-CO1 genes denotes the position of the m.7076 allele. Annotation of the mutation, including the protein consequence (p.Gly391=) of the synonymous variant is shown below. (e) Uniform manifold approximation and projection (UMAP) of accessible chromatin profiles of PBMCs assayed via mtscATAC-seq colored by the density of the m.7076A (wildtype) allele. (f) Cluster annotation and cell type labeling of the same cells as in (e). The arrow indicates the CD8 + T effector memory (CD8 + TEM) population. (g) Ratio of homoplasmic cells with wildtype m.7076A to mutant m.7076G variants across indicated cell state clusters. The arrow highlights the CD8 + TEM cell state as the population with the greatest skew (p < 2.2e-16; binomial test).
Figure 1 Identification of a mosaic synonymous mtDNA variant with a CD8 + T-cell restricted selection bias. (a) Schematic of longitudinal peripheral blood samples obtained from a healthy donor. A total of 5 draws spanning 150 days were taken and processed with the mtscATAC-seq assay. (b) Summary of somatic mtDNA mutations called from aggregated draws. The overall median heteroplasmy is noted, as well as the m.7076A>G allele that is present at a 47.3% pseudobulk heteroplasmy. (c) Distribution of single-cell heteroplasmy across all cells profiled for the m.7076A>G allele. (d) Schematic of the mitochondrial genome with genes contributing to indicated complexes of the respiratory chain (I, III, IV, and V) being color-coded. The asterisk under the MT-CO1 genes denotes the position of the m.7076 allele. Annotation of the mutation, including the protein consequence (p.Gly391=) of the synonymous variant is shown below. (e) Uniform manifold approximation and projection (UMAP) of accessible chromatin profiles of PBMCs assayed via mtscATAC-seq colored by the density of the m.7076A (wildtype) allele. (f) Cluster annotation and cell type labeling of the same cells as in (e). The arrow indicates the CD8 + T effector memory (CD8 + TEM) population. (g) Ratio of homoplasmic cells with wildtype m.7076A to mutant m.7076G variants across indicated cell state clusters. The arrow highlights the CD8 + TEM cell state as the population with the greatest skew (p < 2.2e-16; binomial test).CC-BY-NC-ND · From the PDF
Image 2
CC-BY-NC-ND · From the PDF
Image 3
CC-BY-NC-ND · From the PDF
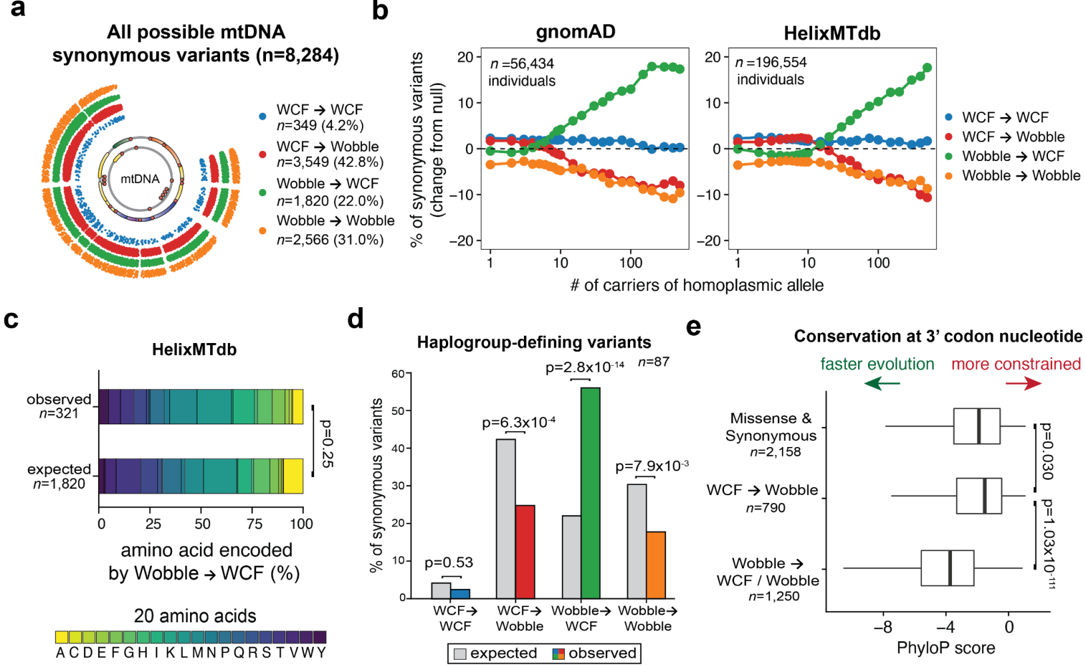
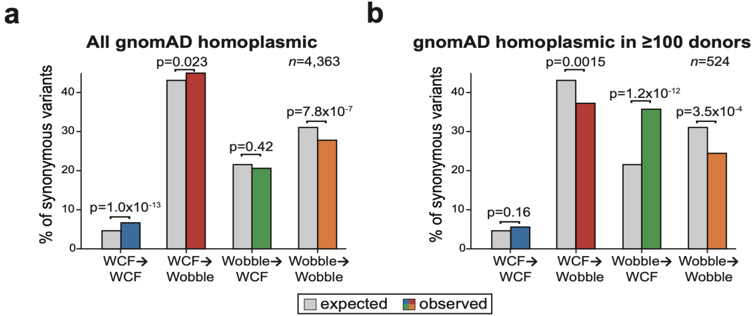
Figure 4 A new ontogeny of synonymous mtDNA mutations reveals patterns of human germline variation mediated by wobble-dependent translation. (a) Classification of all 8,284 possible synonymous mtDNA variants based on Watson-Crick-Franklin (WCF) or wobble-dependent base-pairing at either the reference or alternative allele. (b) The abundance of each synonymous variant class at different thresholds for the number of carriers for two population-scale sequencing databases. The difference in the percent of all synonymous variants is plotted for the four variant classes (null: dotted line at 0). (c) The proportion of the amino acid encoded by the codons relevant for the Wobble→WCF variants. The observed variants represent Wobble→WCF present in at least 100 individuals from HelixMTdb. The test statistic is a Chi-squared test for the number of observed Wobble→WCF variants encoding each amino acid. (d) Comparison of % observed (color) versus expected (grey) for 87 haplogroup-defining, synonymous mtDNA mutations. P-values represent the statistical significance of a two-sided binomial test statistic. (e) Inter-species conservation at wobble-position nucleotides in mitochondrial codons. Reference alleles that can be mutated to different outcomes are specified and grouped with the number of wobble-position codons in each class noted. P-values represent a Wilcoxon test.
Figure 4 A new ontogeny of synonymous mtDNA mutations reveals patterns of human germline variation mediated by wobble-dependent translation. (a) Classification of all 8,284 possible synonymous mtDNA variants based on Watson-Crick-Franklin (WCF) or wobble-dependent base-pairing at either the reference or alternative allele. (b) The abundance of each synonymous variant class at different thresholds for the number of carriers for two population-scale sequencing databases. The difference in the percent of all synonymous variants is plotted for the four variant classes (null: dotted line at 0). (c) The proportion of the amino acid encoded by the codons relevant for the Wobble→WCF variants. The observed variants represent Wobble→WCF present in at least 100 individuals from HelixMTdb. The test statistic is a Chi-squared test for the number of observed Wobble→WCF variants encoding each amino acid. (d) Comparison of % observed (color) versus expected (grey) for 87 haplogroup-defining, synonymous mtDNA mutations. P-values represent the statistical significance of a two-sided binomial test statistic. (e) Inter-species conservation at wobble-position nucleotides in mitochondrial codons. Reference alleles that can be mutated to different outcomes are specified and grouped with the number of wobble-position codons in each class noted. P-values represent a Wilcoxon test.CC-BY-NC-ND · From the PDF
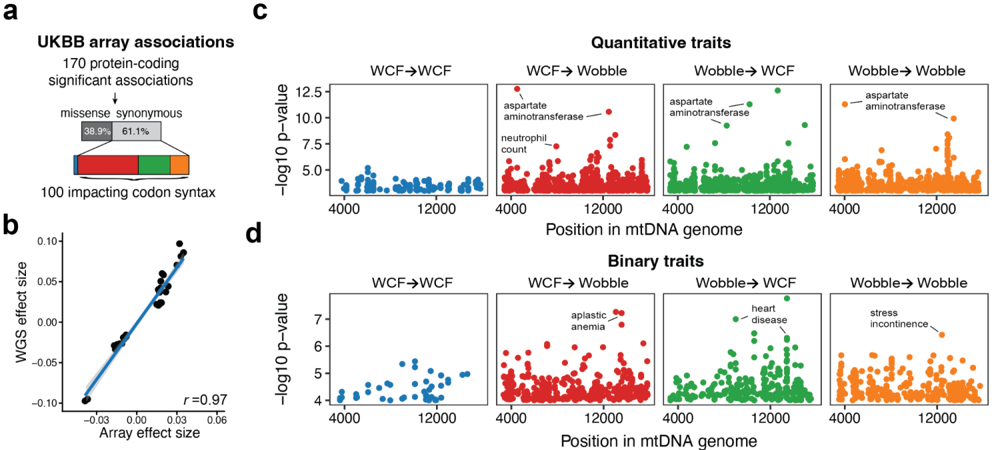
Figure 5 Complex human phenotypes are associated with synonymous mtDNA mutations. (a) Reanalysis of statistically significant associations in protein-coding genes between mtDNA variants measured by a genotyping array and complex traits assayed in the UKBB 29 . (b) Correlation of effect sizes for common variants estimated from WGS (y-axis; computed in this study) and prior array-based work 29 . Only variant-quantitative trait pairs that were statistically significant in the array-based study 29 are noted, and the Pearson correlation between the effect sizes is shown. (c) Manhattan plots of all synonymous mtDNA variants stratified by wobble-dependent ontogeny using a large biobank of whole-genome sequencing data. (d) Same as in (c) but for binary traits. Each dot represents a unique trait-genotype association with a p-value <1x10 -4 .
Figure 5 Complex human phenotypes are associated with synonymous mtDNA mutations. (a) Reanalysis of statistically significant associations in protein-coding genes between mtDNA variants measured by a genotyping array and complex traits assayed in the UKBB 29 . (b) Correlation of effect sizes for common variants estimated from WGS (y-axis; computed in this study) and prior array-based work 29 . Only variant-quantitative trait pairs that were statistically significant in the array-based study 29 are noted, and the Pearson correlation between the effect sizes is shown. (c) Manhattan plots of all synonymous mtDNA variants stratified by wobble-dependent ontogeny using a large biobank of whole-genome sequencing data. (d) Same as in (c) but for binary traits. Each dot represents a unique trait-genotype association with a p-value <1x10 -4 .CC-BY-NC-ND · From the PDF
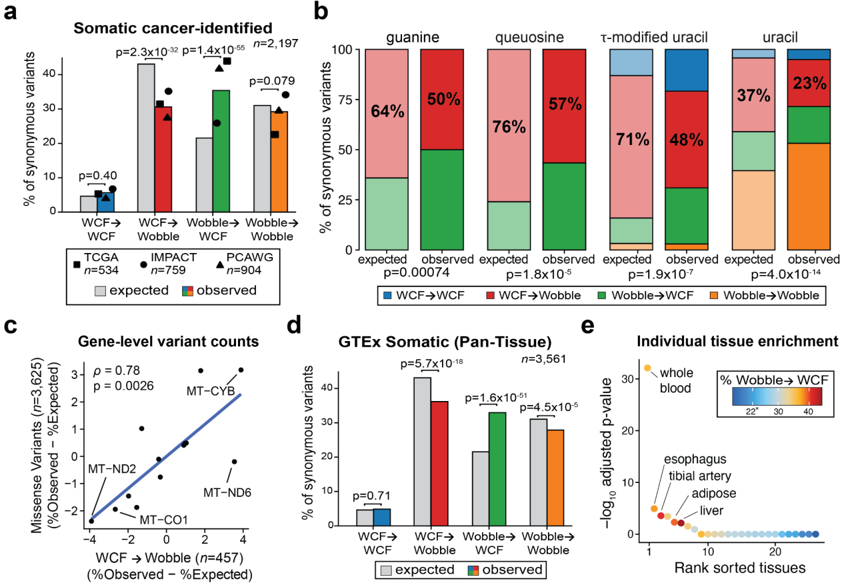
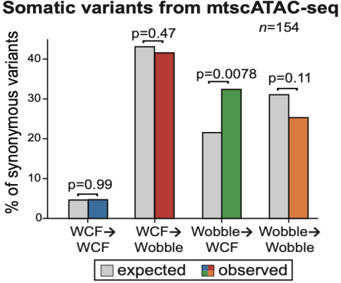
Figure 6 Wobble-dependent translation reveals patterns of synonymous somatic mtDNA variation in tumors and healthy tissues. (a) Comparison of observed (color) versus expected (grey) somatic synonymous mtDNA mutations based on three tumor atlas sequencing cohorts (TCGA, IMPACT, PCAWG). P-values represent the statistical significance of a two-sided binomial test statistic. (b) Stratification of synonymous variants by tRNA base in the anticodon wobble position. Faded colors represent the expected numbers of mutations under a null model. Percents represent the fraction of mutations that are WCF→Wobble. Chi-squared test of association between observed and expected mutation values based on numbers of potential or observed mutations in each synonymous mutation class are shown below each pair of bar plots. (c) Gene-level abundances of missense and WCF→Wobble variants comparing expected (based on all possible variants) versus observed variants across the entire dataset. The Pearson correlation and p-value from the Pearson correlation test are noted. (d) Same as in (a) but for somatic mutations identified in the mtDNA genome in one or more non-cancerous GTEx tissues 13 . (e) The proportion of synonymous variants that are Wobble→WCF within individual tissues. 22% (noted by the asterisk) is the abundance under the null. Tissues are rank-ordered by statistical significance using the p-value from a two-sided binomial test.
Figure 6 Wobble-dependent translation reveals patterns of synonymous somatic mtDNA variation in tumors and healthy tissues. (a) Comparison of observed (color) versus expected (grey) somatic synonymous mtDNA mutations based on three tumor atlas sequencing cohorts (TCGA, IMPACT, PCAWG). P-values represent the statistical significance of a two-sided binomial test statistic. (b) Stratification of synonymous variants by tRNA base in the anticodon wobble position. Faded colors represent the expected numbers of mutations under a null model. Percents represent the fraction of mutations that are WCF→Wobble. Chi-squared test of association between observed and expected mutation values based on numbers of potential or observed mutations in each synonymous mutation class are shown below each pair of bar plots. (c) Gene-level abundances of missense and WCF→Wobble variants comparing expected (based on all possible variants) versus observed variants across the entire dataset. The Pearson correlation and p-value from the Pearson correlation test are noted. (d) Same as in (a) but for somatic mutations identified in the mtDNA genome in one or more non-cancerous GTEx tissues 13 . (e) The proportion of synonymous variants that are Wobble→WCF within individual tissues. 22% (noted by the asterisk) is the abundance under the null. Tissues are rank-ordered by statistical significance using the p-value from a two-sided binomial test.CC-BY-NC-ND · From the PDF
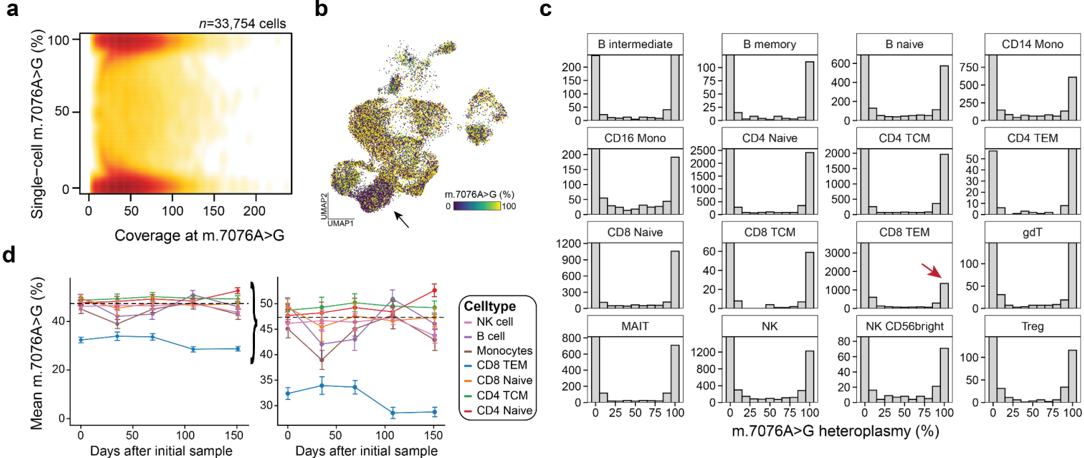
Extended Data Fig. 1. Supporting information for selection against mutant m.7076G in CD8 + TEM. (a) Heatmap of single-cells comparing the coverage of both m.7076 alleles against heteroplasmy. (b) Compare to Fig. 1e with the smoothed representation. (c) Histograms comparing the 16 most common cell types from the Azimuth/Bridge Integration annotation. The red arrow highlights the significant reduction of cells with the m.7076A>G variant specifically in CD8 + TEM cells, but not other cell types. (d) Longitudinal heteroplasmy of different cell populations over >150 days of sampling. The right panel is a zoom of the region on the left panel (note axis). Pseudobulk heteroplasmy estimates including the standard error of the mean are shown.
Extended Data Fig. 1. Supporting information for selection against mutant m.7076G in CD8 + TEM. (a) Heatmap of single-cells comparing the coverage of both m.7076 alleles against heteroplasmy. (b) Compare to Fig. 1e with the smoothed representation. (c) Histograms comparing the 16 most common cell types from the Azimuth/Bridge Integration annotation. The red arrow highlights the significant reduction of cells with the m.7076A>G variant specifically in CD8 + TEM cells, but not other cell types. (d) Longitudinal heteroplasmy of different cell populations over >150 days of sampling. The right panel is a zoom of the region on the left panel (note axis). Pseudobulk heteroplasmy estimates including the standard error of the mean are shown.CC-BY-NC-ND · From the PDF
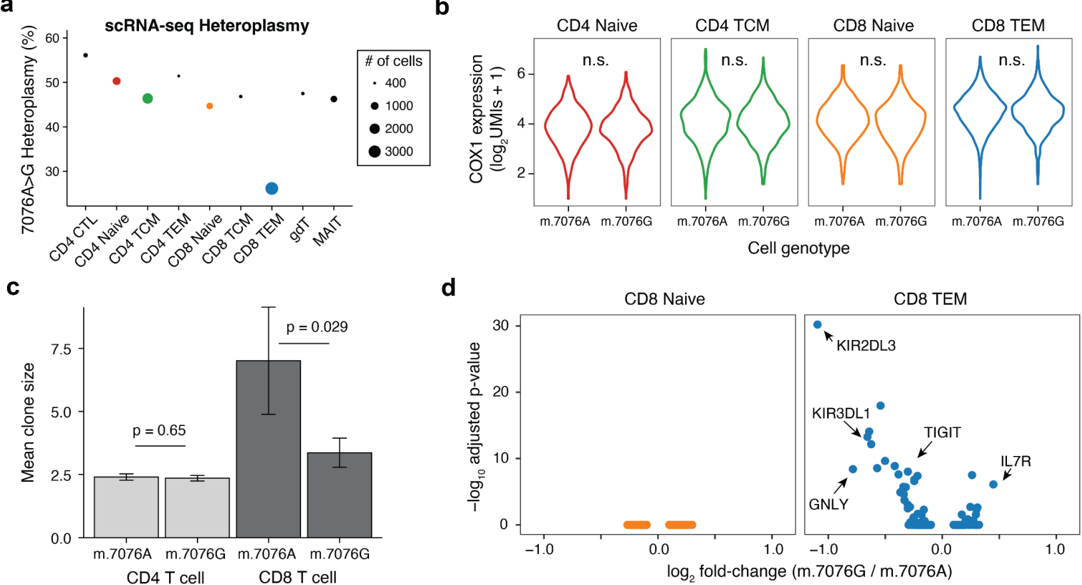
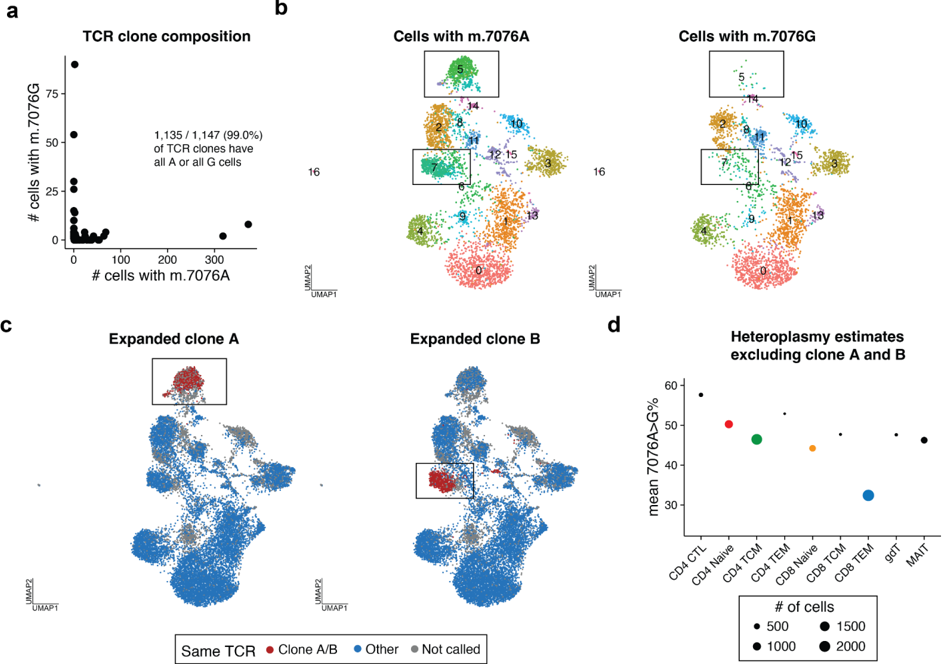
Extended Data Fig. 2. Supporting information for selection against mutant m.7076A>G using scRNA-seq. (a) Overlap of TCR clones with respective m.7076 alleles. Each dot is a TCR clone (min. 2 cells) summarizing the number of cells with either wildtype m.7076A or mutant m.7076G homoplasmy. (b Unsupervised clustering and dimensionality reduction of T cells stratified by m.7076A or m.7076G homoplasmy. Black boxes around clusters 5 (98.1%) and 7 (95.9%) represent specific cell states that are primarily restricted to cells harboring the m.7076A allele. (c) Annotation of two highly expanded TCR clones restricted to cells homoplasmic for wildtype m.7076A. Blue represents TCR clones (n≥2 cells) that were not highly expanded. (d) Heteroplasmy of the m.7076A>G allele in indicated T cell subpopulations based on scRNA-seq after excluding clones A and B from panel (c). The size of each dot is scaled by the abundance of cells in each cell state.
Extended Data Fig. 2. Supporting information for selection against mutant m.7076A>G using scRNA-seq. (a) Overlap of TCR clones with respective m.7076 alleles. Each dot is a TCR clone (min. 2 cells) summarizing the number of cells with either wildtype m.7076A or mutant m.7076G homoplasmy. (b Unsupervised clustering and dimensionality reduction of T cells stratified by m.7076A or m.7076G homoplasmy. Black boxes around clusters 5 (98.1%) and 7 (95.9%) represent specific cell states that are primarily restricted to cells harboring the m.7076A allele. (c) Annotation of two highly expanded TCR clones restricted to cells homoplasmic for wildtype m.7076A. Blue represents TCR clones (n≥2 cells) that were not highly expanded. (d) Heteroplasmy of the m.7076A>G allele in indicated T cell subpopulations based on scRNA-seq after excluding clones A and B from panel (c). The size of each dot is scaled by the abundance of cells in each cell state.CC-BY-NC-ND · From the PDF
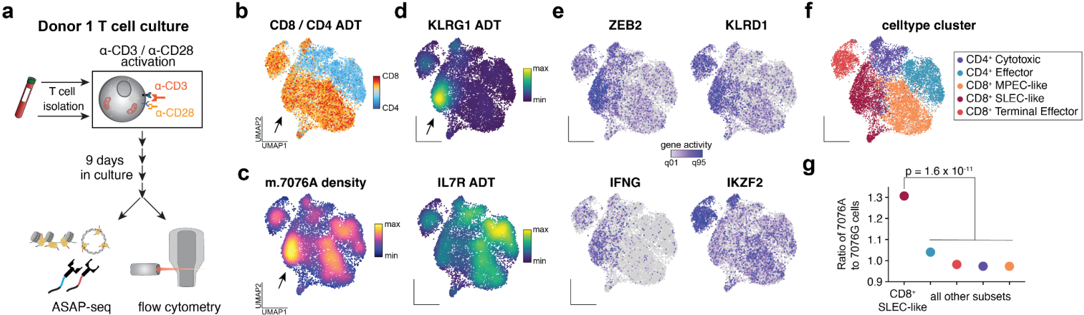
Extended Data Figure 3. In vitro activation of T cells refines cell states depleted of the mutant 7076G allele. (a) Schematic of experimental design. T cells were isolated from Donor 1, in vitro activated, and cultured for 9 days before profiling via flow cytometry and ASAP-seq. (b) UMAP of accessible chromatin profiles and projected ratio of CD8 over CD4 antibody-derived tags from day 9 cells profiled via ASAP-seq. Arrow indicates a population highly enriched for the m.7076A (wildtype) allele. (c) Same as (b) but colored by the density of the m.7076A (wildtype) allele. (d) UMAP embedding colored by KLRG1 (top) and IL7R (bottom) antibody tag density. (e) UMAP colored by selected gene activity scores for four indicated gene loci. (f) UMAP colored by indicated cell state cluster. (g) Ratio of wildtype m.7076A to mutant m.7076G cells within indicated cell states. P-value represents the statistical significance of a two-sided binomial test statistic.
Extended Data Figure 3. In vitro activation of T cells refines cell states depleted of the mutant 7076G allele. (a) Schematic of experimental design. T cells were isolated from Donor 1, in vitro activated, and cultured for 9 days before profiling via flow cytometry and ASAP-seq. (b) UMAP of accessible chromatin profiles and projected ratio of CD8 over CD4 antibody-derived tags from day 9 cells profiled via ASAP-seq. Arrow indicates a population highly enriched for the m.7076A (wildtype) allele. (c) Same as (b) but colored by the density of the m.7076A (wildtype) allele. (d) UMAP embedding colored by KLRG1 (top) and IL7R (bottom) antibody tag density. (e) UMAP colored by selected gene activity scores for four indicated gene loci. (f) UMAP colored by indicated cell state cluster. (g) Ratio of wildtype m.7076A to mutant m.7076G cells within indicated cell states. P-value represents the statistical significance of a two-sided binomial test statistic.CC-BY-NC-ND · From the PDF
Image 10
CC-BY-NC-ND · From the PDF
Image 11
CC-BY-NC-ND · From the PDF
Image 12
CC-BY-NC-ND · From the PDF
Image 13
CC-BY-NC-ND · From the PDF

Verification

Claims the paper makes

The claims and statistics of this paper haven’t been checked yet.

Run the check — free, no account needed. It reads the open-access text and checks the sources it cites.

A few free checks a day · papers already verified open instantly · results are public

Claims other papers make about this one

Each is checked against this paper’s own text: does it say what the citing paper says it does?

Self-check

Percentages, sums and reported differences re-computed from the paper’s own numbers.

The self-check needs the paper’s full text.

Citations

Cites

Show all 6 references

Research works printed but not linked: 55

  1. 2020, Purifying Selection against Pathogenic Mitochondrial DNA in Human T Cells, N. Engl. J. Med, 383, 1556, 10.1056/NEJMoa2001265 · DOI
  2. Lareau, C. A. et al. Single-cell multi-omics reveals dynamics of purifying selection of pathogenic mitochondrial DNA across human immune cells. Preprint at https://doi.org/10.1101/2022.11.20.517242. · DOI
  3. 10.1038/nrg3966 · DOI
  4. 10.1038/s41586-022-04713-1 · DOI
  5. 2022, Single-cell multi-omics of human clonal hematopoiesis reveals that DNMT3A R882 mutations perturb early progenitor states through selective hypomethylation, Nat. Genet, 54, 1514, 10.1038/s41588-022-01179-9 · DOI · Paper page
  6. 10.1038/s41587-020-0645-6 · DOI · Paper page
  7. 2022, Mitochondrial variant enrichment from high-throughput single-cell RNA sequencing resolves clonal populations, Nat. Biotechnol, 40, 1030, 10.1038/s41587-022-01210-8 · DOI
  8. 10.1038/s41587-021-00927-2 · DOI · Paper page
  9. 10.1016/j.cell.2019.01.022 · DOI · Paper page
  10. Bolze, A. et al. A catalog of homoplasmic and heteroplasmic mitochondrial DNA variants in humans. Preprint at https://doi.org/10.1101/798264. · DOI
  11. Karczewski, K. J. , Francioli, L. C. & MacArthur, D. G. The mutational constraint spectrum quantified from variation in 141,456 humans. Yearbook of Paediatric Endocrinology Preprint at https://doi.org/10.1530/ey.17.14.3 (2020). · DOI
  12. 10.3389/fimmu.2017.01516 · DOI
  13. 10.1016/j.immuni.2011.12.007 · DOI · Paper page
  14. 10.1038/s41557-022-01091-z · DOI
  15. 2022, Two isoleucyl tRNAs that decode synonymous codons divergently regulate breast cancer metastatic growth by controlling translation of proliferation-regulating genes, Nat Cancer, 3, 1484, 10.1038/s43018-022-00469-9 · DOI
  16. 10.1016/j.cell.2016.05.046 · DOI
  17. 2022, Synonymous mutations in representative yeast genes are mostly strongly non-neutral, Nature, 606, 725, 10.1038/s41586-022-04823-w · DOI · Paper page
  18. 10.1038/nsmb.1370 · DOI
  19. Soto, I. et al. Balanced mitochondrial and cytosolic translatomes underlie the biogenesis of human respiratory complexes. Preprint at https://doi.org/10.1101/2021.05.31.446345. · DOI
  20. 10.1101/gr.276013.121 · DOI
  21. 10.1101/2022.12.16.520778 · DOI · Paper page
  22. 10.1093/nar/gkw233 · DOI
  23. 2015, PhyloTree Build 17: Growing the human mitochondrial DNA tree, Forensic Science International: Genetics Supplement Series, 5, e392
  24. 10.1101/gr.097857.109 · DOI · Paper page
  25. 10.1038/s41588-021-00868-1 · DOI
  26. 10.1101/2021.08.18.456802 · DOI
  27. 10.3748/wjg.v18.i29.3775 · DOI
  28. 2021, Codon optimality in cancer, Oncogene, 40, 6309, 10.1038/s41388-021-02022-x · DOI
  29. 10.1038/s41467-020-18068-6 · DOI
  30. 10.1038/s42255-021-00378-8 · DOI
  31. 2020, Mitochondrial ubiquinol oxidation is necessary for tumour growth, Nature, 585, 288, 10.1038/s41586-020-2475-6 · DOI
  32. 2021, The mtDNA mutation spectrum in the PolG mutator mouse reveals germline and somatic selection, BMC Genom Data, 22, 52, 10.1186/s12863-021-01005-x · DOI
  33. 10.1101/2022.08.30.505884 · DOI
  34. 10.1182/blood-2008-08-169474 · DOI
  35. 10.1038/s41586-019-1672-7 · DOI · Paper page
  36. 10.1038/s41586-020-1961-1 · DOI · Paper page
  37. 10.1038/s41586-019-1670-9 · DOI · Paper page
  38. 2004, Mitochondrial-DNA nucleotides G4298A and T10010C as pathogenic mutations: the confirmation in two new cases, Mitochondrion, 3, 279, 10.1016/j.mito.2004.02.004 · DOI
  39. 10.1101/2022.07.13.499964 · DOI
  40. 10.1101/2022.08.22.504687 · DOI
  41. Kruglyak, L. et al. No evidence that synonymous mutations in yeast genes are mostly deleterious. Preprint at https://doi.org/10.1101/2022.07.14.500130. · DOI
  42. 10.1093/nar/gki242 · DOI
  43. Boguszewska, K. , Szewczuk, M. , Kaźmierczak-Barańska, J. & Karwowski, B. T . The Similarities between Human Mitochondria and Bacteria in the Context of Structure, Genome, and Base Excision Repair System. Molecules 25, (2020). · DOI
  44. 10.1038/s41592-021-01282-5 · DOI · Paper page
  45. 10.1016/j.cell.2019.05.031 · DOI · Paper page
  46. 10.1101/2022.02.24.481684 · DOI
  47. 10.1016/J.CELL.2021.04.048 · DOI · Paper page
  48. Garrison, E. & Marth, G . Haplotype-based variant detection from short-read sequencing. arXiv [q-bio.GN] (2012).
  49. 2021, Monitoring mammalian mitochondrial translation with MitoRiboSeq, Nat. Protoc, 16, 2802, 10.1038/s41596-021-00517-1 · DOI
  50. 2020, Control of human hemoglobin switching by LIN28B-mediated regulation of BCL11A translation, Nat. Genet, 52, 138, 10.1038/s41588-019-0568-7 · DOI · Paper page
  51. 2021, Rare variant contribution to human disease in 281,104 UK Biobank exomes, Nature, 597, 527, 10.1038/s41586-021-03855-y · DOI · Paper page
  52. 10.4161/fly.19695 · DOI · Paper page
  53. 10.1093/NAR/GKAB1049 · DOI · Paper page
  54. 10.1016/j.ajhg.2012.09.004 · DOI · Paper page
  55. 10.1016/j.ajhg.2017.01.017. · DOI · Paper page

Cited by

See all 2

Metadata

Authors
Lareau, C. A., Yin, Y., Gutierrez, J. C., Dhindsa, R. S., Gribling-Burrer, A.-S., Hsieh, Y.-H., Nitsch, L., Buquicchio, F. A., Abay, T., Zielinski, S., Stickels, R. R., Ulirsch, J. C., Yan, P., Wang, F., Miao, Z., Sandor, K., Daniel, B., Liu, V., Wang, Q., Hu, F., Smith, K. R., Deevi, S. V. V., Maschmeyer, P., Petrovski, S., Smyth, R. P., Greenleaf, W. J., Kundaje, A., Munschauer, M., Ludwig, L. S., & Satpathy, A. T.
Publisher
openRxiv
Published
2023-04-23
Cited by
2
References
6
Type
Preprint

About these checks

Registry, retraction, Cites and statistics results are computed, not judged, with one exception: a printed reference that no index lists is read once by a model before it counts as a citation error. Claims are extracted by a model and kept only when their quote appears verbatim in the text; each cited source is then checked, with a model’s help, for whether it says what the claim relies on. Those verdicts can be wrong — read the claim’s quote and the cited source before relying on one.

Statistics and arithmetic are recomputed, not judged.

Confidence bands are shown only for fields calibrated on our annotated test set. None is calibrated yet, so no band is shown.

What counts as a claim ›How we measure confidence ›How we check this ›

Are you an author, or do you see a problem with this page? Request a review

How to cite

Cite CoChat for the checks on this page, and the paper for its own findings.

This page
CoChat. (2026). Citation check: Codon affinity in mitochondrial DNA shapes evolutionary and somatic fitness. https://app.cochat.ai/papers/10.1101/2023.04.23.537997
The paper
Lareau, C. A., Yin, Y., Gutierrez, J. C., Dhindsa, R. S., Gribling-Burrer, A.-S., Hsieh, Y.-H., Nitsch, L., Buquicchio, F. A., Abay, T., Zielinski, S., Stickels, R. R., Ulirsch, J. C., Yan, P., Wang, F., Miao, Z., Sandor, K., Daniel, B., Liu, V., Wang, Q., . . . Satpathy, A. T. (2023). Codon affinity in mitochondrial DNA shapes evolutionary and somatic fitness. https://doi.org/10.1101/2023.04.23.537997