PreprintCited by 1Protein Kinase Regulation and GTPase SignalingMelanoma and MAPK PathwaysProtein Tyrosine Phosphatases

The DOI matches its Crossref record; 3 of the 3 references it cites were found in a registry or an index.

Unveiling the Domain-Specific and RAS Isoform-Specific Details of BRAF Regulation

Open access
Trebino, Tarah, Markusic, Borna, Nan, Haihan, Banerjee, Shrhea, Wang, Zhihong·2023·bioRxiv (Cold Spring Harbor Laboratory)

Preprint — published as 10.7554/elife.88836.3 · Paper page

Abstract

BRAF is a key member in the MAPK signaling pathway essential for cell growth, proliferation, and differentiation. Dysregulation or mutation of BRAF is often the underlying cause of various types of cancer. RAS, a small GTPase protein that acts upstream of BRAF, has been identified as a driver of up to one-third of all cancers. When BRAF interacts with RAS via the RAS binding domain (RBD) and membrane recruitment, BRAF undergoes a conformational change from an inactive, autoinhibited monomer to an active dimer and subsequently phosphorylates MEK to propagate the signal. Despite the central role of BRAF in cellular signaling, the exact order and magnitude of its activation steps has yet to be confirmed experimentally. By studying the inter- and intramolecular interactions of BRAF, we unveil the domain-specific and isoform-specific details of BRAF regulation. We employed pulldown assays, open surface plasmon resonance (OpenSPR), and hydrogen-deuterium exchange mass spectrometry (HDX-MS) to investigate the roles of the regulatory regions in BRAF activation and autoinhibition. Our results demonstrate that the BRAF specific region (BSR) and cysteine rich domain (CRD) play a crucial role in regulating the activity of BRAF. Moreover, we quantified the autoinhibitory binding affinities between the N-terminal domains and the kinase domain (KD) of BRAF and revealed the individual roles of the BRAF regulatory domains. Additionally, our findings provide evidence that the BSR negatively regulates BRAF activation in a RAS isoform-specific manner. Our findings also indicate that oncogenic BRAF-KD D594G mutant has a lower affinity for the regulatory domains, implicating that pathogenic BRAF acts through decreased propensity for autoinhibition. Collectively, our study provides valuable insights into the activation mechanism of BRAF kinase and may help to guide the development of new therapeutic strategies for cancer treatment.

Overview

The claims and statistics of this paper haven’t been checked yet.

Run the check — free, no account needed. It reads the open-access text and checks the sources it cites.

A few free checks a day · papers already verified open instantly · results are public

Integrity signals

Registry

Crossref · 10.1101/2023.04.24.538112

Cites

3 of 3 references verified0 citation errors · 0 not checkable

Statistics

Figures

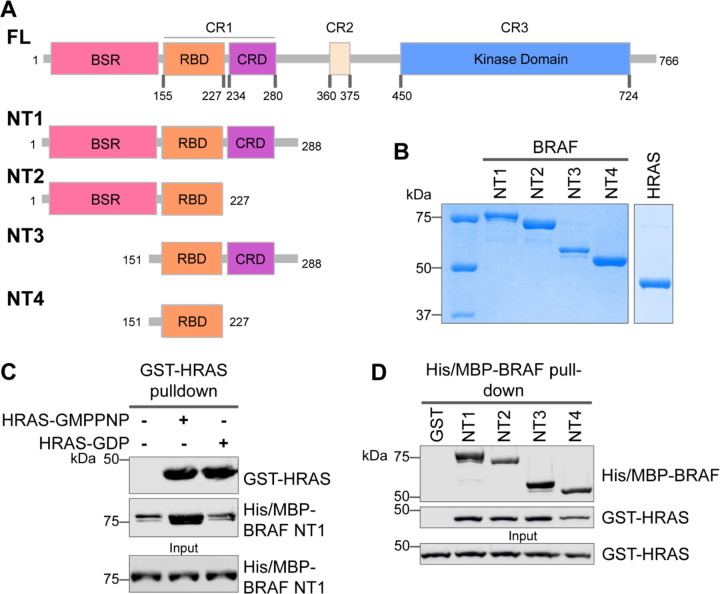
Figure 1. Specific purified N-terminal domains are involved in HRAS interactions. (A) Diagram of BRAF-NT constructs. Top panel is full-length BRAF, followed by proteins NT1-4 expressed in E. coli and purified. Not shown: 6xHis/MBP tag on the N-terminal of NT proteins. BSR: BRAF specific region; RBD: RAS binding domain; CRD: cysteine rich domain. (B) Coomassie stained gels of purified NT1-4 and GST-HRAS. (C) Western blot of HRAS-GMPPNP or HRAS-GDP pulled down on glutathione resin to probe for NT1 binding. (D) Western blot of BRAF NT1-4 pulled down on amylose resin to probe for HRAS-GMPPNP binding.
Figure 1. Specific purified N-terminal domains are involved in HRAS interactions. (A) Diagram of BRAF-NT constructs. Top panel is full-length BRAF, followed by proteins NT1-4 expressed in E. coli and purified. Not shown: 6xHis/MBP tag on the N-terminal of NT proteins. BSR: BRAF specific region; RBD: RAS binding domain; CRD: cysteine rich domain. (B) Coomassie stained gels of purified NT1-4 and GST-HRAS. (C) Western blot of HRAS-GMPPNP or HRAS-GDP pulled down on glutathione resin to probe for NT1 binding. (D) Western blot of BRAF NT1-4 pulled down on amylose resin to probe for HRAS-GMPPNP binding.CC BY · PubMed Central
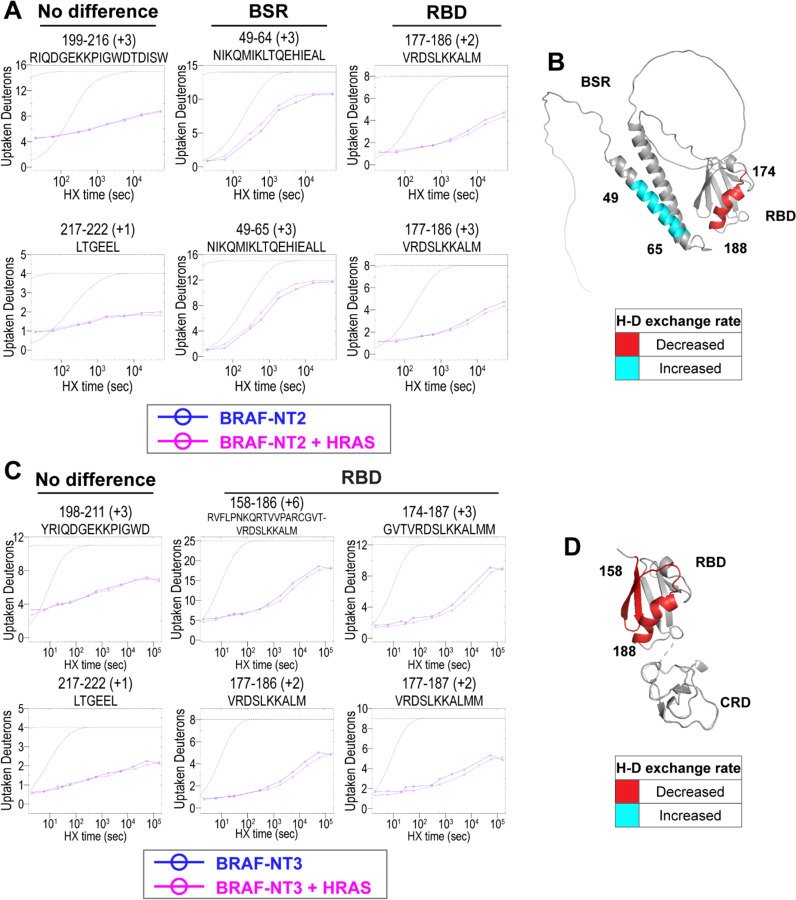
Figure 2. HDX-MS revealed conformational changes of BRAF N-terminal domains in response to active HRAS binding. (A, C) Representative NT2 (A) and NT3 (C) peptides identified from HDX-MS in the absence (blue) and presence (pink) of HRAS. Peptides with no difference in H-D exchange rate are consistent in both NT2 and NT3. Presented peptide plots displaying differences in H-D exchange rate are representative of a trend of multiple overlapping peptides in the BSR and/or RBD. Gray dotted lines represent the theoretical exchange behavior for specified peptide that is fully unstructured (top) or for specified peptide with a uniform protection factor (fraction of time the residue is involved in protecting the H-bond) of 100 (lower). (B, D) Deuteron uptake differences of NT2 (B) and NT3 (D) mapped on the predicted BRAF AlphaFold structure, where deuterium exchange is decreased (red) or increased (cyan).
Figure 2. HDX-MS revealed conformational changes of BRAF N-terminal domains in response to active HRAS binding. (A, C) Representative NT2 (A) and NT3 (C) peptides identified from HDX-MS in the absence (blue) and presence (pink) of HRAS. Peptides with no difference in H-D exchange rate are consistent in both NT2 and NT3. Presented peptide plots displaying differences in H-D exchange rate are representative of a trend of multiple overlapping peptides in the BSR and/or RBD. Gray dotted lines represent the theoretical exchange behavior for specified peptide that is fully unstructured (top) or for specified peptide with a uniform protection factor (fraction of time the residue is involved in protecting the H-bond) of 100 (lower). (B, D) Deuteron uptake differences of NT2 (B) and NT3 (D) mapped on the predicted BRAF AlphaFold structure, where deuterium exchange is decreased (red) or increased (cyan).CC BY · PubMed Central
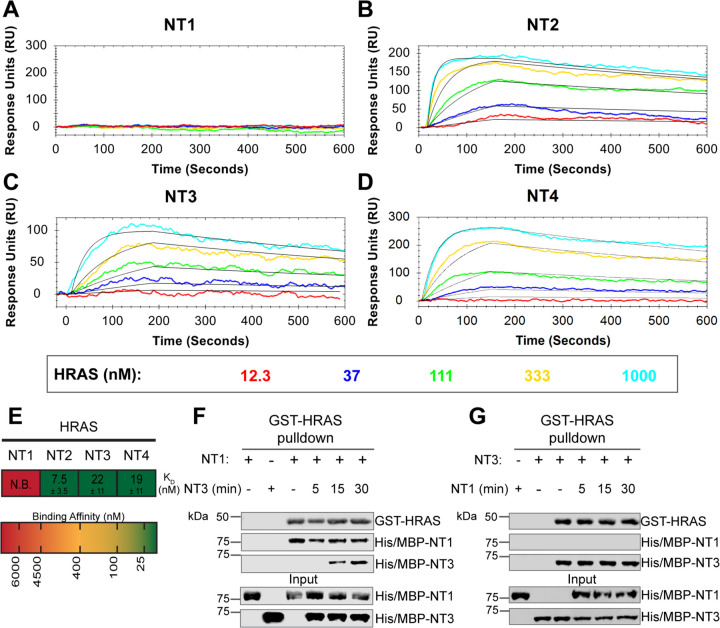
Figure 3. BRAF specific region (BSR) in conjunction with the cysteine rich domain (CRD) reduces binding affinity for HRAS. (A-D) OpenSPR binding curves of HRAS flowed over NT1-4 immobilized on NTA sensors and the best fit curves (black) produced from a 1:1 fitting model kinetic evaluation. Representative of independent experiments with similar results each (NT1: n=7, NT2: n=2, NT3: n=2, NT4: n=3). (E) Diagram of the average dissociation constant (KD) ± standard deviation from independent OpenSPR experiments of HRAS flowed over immobilized NT1-4. (F-G) Western blot of purified His/MBP-NT1 (F) or -NT3 (G) binding to active GST-HRAS on glutathione resin in a pulldown assay and subsequent competition with NT3 (F) or NT1 (G). Representative of 2 independent experiments each with similar results.
Figure 3. BRAF specific region (BSR) in conjunction with the cysteine rich domain (CRD) reduces binding affinity for HRAS. (A-D) OpenSPR binding curves of HRAS flowed over NT1-4 immobilized on NTA sensors and the best fit curves (black) produced from a 1:1 fitting model kinetic evaluation. Representative of independent experiments with similar results each (NT1: n=7, NT2: n=2, NT3: n=2, NT4: n=3). (E) Diagram of the average dissociation constant (KD) ± standard deviation from independent OpenSPR experiments of HRAS flowed over immobilized NT1-4. (F-G) Western blot of purified His/MBP-NT1 (F) or -NT3 (G) binding to active GST-HRAS on glutathione resin in a pulldown assay and subsequent competition with NT3 (F) or NT1 (G). Representative of 2 independent experiments each with similar results.CC BY · PubMed Central
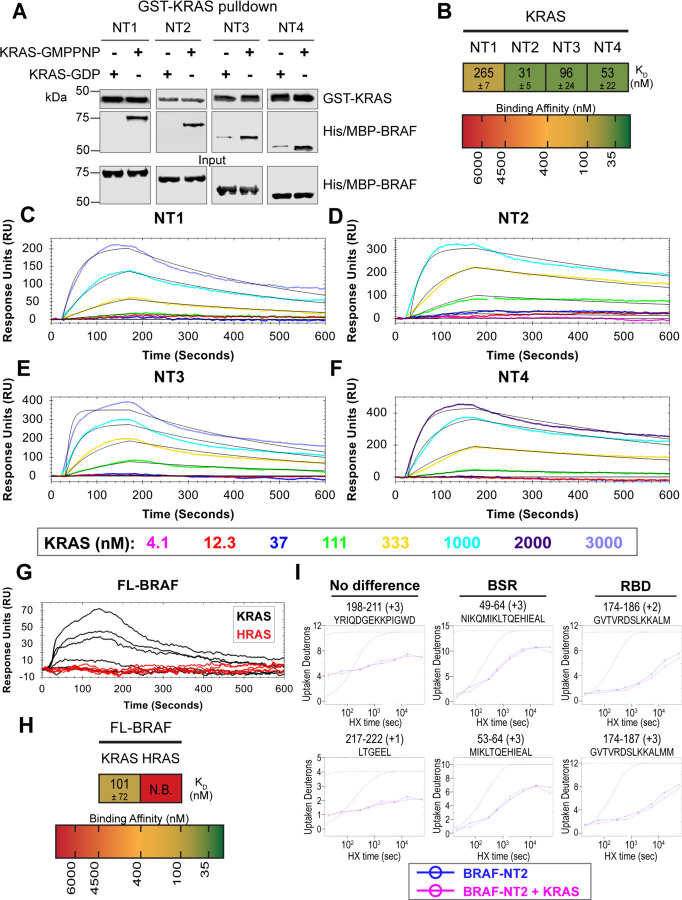
Figure 4. BSR differentiates the BRAF-KRAS interaction from the BRAF-HRAS interaction. (A) Western blot of purified His/MBP-NT1-4 binding to GST-KRAS on glutathione resin in a pulldown assay. Representative of 2 independent experiments with similar results. (B) Diagram of the average dissociation constant (KD) ± standard deviation from independent OpenSPR experiments of KRAS flowed over immobilized NT1-4. (C-F) OpenSPR binding curves of KRAS flowed over NT1-4 immobilized on NTA sensors and the best fit curves (black) produced from a 1:1 fitting model kinetic evaluation. Representative of at least 2 independent experiments with similar results each. (G) OpenSPR binding curves of KRAS and HRAS flowed over FL-BRAF immobilized on NTA sensors and the best fit curves (black) produced from a 1:1 fitting model kinetic evaluation. K- and HRAS flowed over at increasing concentrations of 12.3, 37, 111, 333, 1000, and 3000 nM at 30 μL/min. Representative of 2 independent experiments with similar results each. (H) Diagram of the average dissociation constant (KD) ± standard deviation from independent OpenSPR experiments of H/KRAS flowed over immobilized FL-BRAF. (I) Representative NT2 peptides identified from HDX-MS in the absence (blue) and presence (pink) of KRAS. Peptides with no difference in H-D exchange rate are exemplified under “no difference”. Presented peptide plots displaying differences in H-D exchange rate are representative of a trend of 4+ overlapping peptides in the RBD. Gray dotted lines represent the theoretical exchange behavior for specified peptide that is fully unstructured (top) or for specified peptide with a uniform protection factor (fraction of time the residue is involved in protecting the H-bond) of 100 (lower).
Figure 4. BSR differentiates the BRAF-KRAS interaction from the BRAF-HRAS interaction. (A) Western blot of purified His/MBP-NT1-4 binding to GST-KRAS on glutathione resin in a pulldown assay. Representative of 2 independent experiments with similar results. (B) Diagram of the average dissociation constant (KD) ± standard deviation from independent OpenSPR experiments of KRAS flowed over immobilized NT1-4. (C-F) OpenSPR binding curves of KRAS flowed over NT1-4 immobilized on NTA sensors and the best fit curves (black) produced from a 1:1 fitting model kinetic evaluation. Representative of at least 2 independent experiments with similar results each. (G) OpenSPR binding curves of KRAS and HRAS flowed over FL-BRAF immobilized on NTA sensors and the best fit curves (black) produced from a 1:1 fitting model kinetic evaluation. K- and HRAS flowed over at increasing concentrations of 12.3, 37, 111, 333, 1000, and 3000 nM at 30 μL/min. Representative of 2 independent experiments with similar results each. (H) Diagram of the average dissociation constant (KD) ± standard deviation from independent OpenSPR experiments of H/KRAS flowed over immobilized FL-BRAF. (I) Representative NT2 peptides identified from HDX-MS in the absence (blue) and presence (pink) of KRAS. Peptides with no difference in H-D exchange rate are exemplified under “no difference”. Presented peptide plots displaying differences in H-D exchange rate are representative of a trend of 4+ overlapping peptides in the RBD. Gray dotted lines represent the theoretical exchange behavior for specified peptide that is fully unstructured (top) or for specified peptide with a uniform protection factor (fraction of time the residue is involved in protecting the H-bond) of 100 (lower).CC BY · PubMed Central
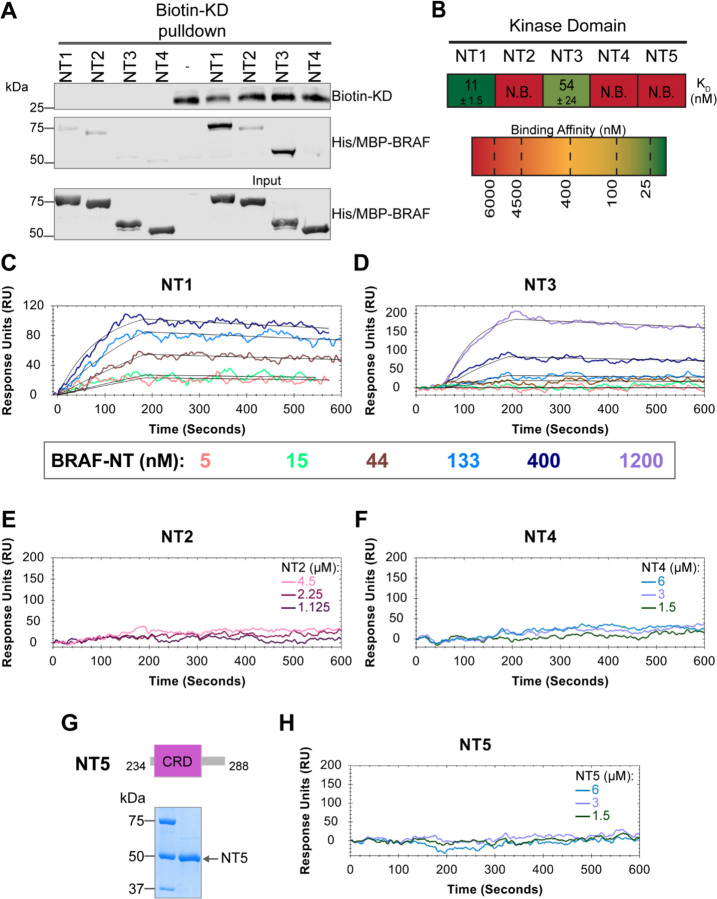
Figure 5. BSR and CRD promote BRAF autoinhibitory interactions. (A) Western blot of purified His/MBP-NT1-4 binding to biotinylated His-KD on streptavidin beads in a pulldown assay. Representative of 3 independent experiments with similar results. (B) Diagram of the average dissociation constant (KD) ± standard deviation from independent OpenSPR experiments of NTs flowed over immobilized KD. (C-D) OpenSPR binding curves of NT1 and NT3 at 5, 15, 44, 133, 400, and 1200 nM (NT3 only) flowed over KD and the best fit curves (black) produced from a 1:1 fitting model kinetic evaluation. Representative of independent experiments with similar results (NT3: n=2, NT1: n=3). (E-F) No binding of NT2 or NT4 to immobilized KD was observed by OpenSPR even at high concentrations (NT2: 1.125, 2.25, 4.5 μM; NT4: 1.5, 3, 6 μM). Representative of 2 independent experiments each with similar results. (G) Diagram of BRAF-NT5 (top) and Coomassie stained gel of recombinant NT5 (lower). (H) NT5 at 1.5, 3, and 6 μM flowed over immobilized KD on a carboxyl sensor. Representative of 3 independent experiments.
Figure 5. BSR and CRD promote BRAF autoinhibitory interactions. (A) Western blot of purified His/MBP-NT1-4 binding to biotinylated His-KD on streptavidin beads in a pulldown assay. Representative of 3 independent experiments with similar results. (B) Diagram of the average dissociation constant (KD) ± standard deviation from independent OpenSPR experiments of NTs flowed over immobilized KD. (C-D) OpenSPR binding curves of NT1 and NT3 at 5, 15, 44, 133, 400, and 1200 nM (NT3 only) flowed over KD and the best fit curves (black) produced from a 1:1 fitting model kinetic evaluation. Representative of independent experiments with similar results (NT3: n=2, NT1: n=3). (E-F) No binding of NT2 or NT4 to immobilized KD was observed by OpenSPR even at high concentrations (NT2: 1.125, 2.25, 4.5 μM; NT4: 1.5, 3, 6 μM). Representative of 2 independent experiments each with similar results. (G) Diagram of BRAF-NT5 (top) and Coomassie stained gel of recombinant NT5 (lower). (H) NT5 at 1.5, 3, and 6 μM flowed over immobilized KD on a carboxyl sensor. Representative of 3 independent experiments.CC BY · PubMed Central
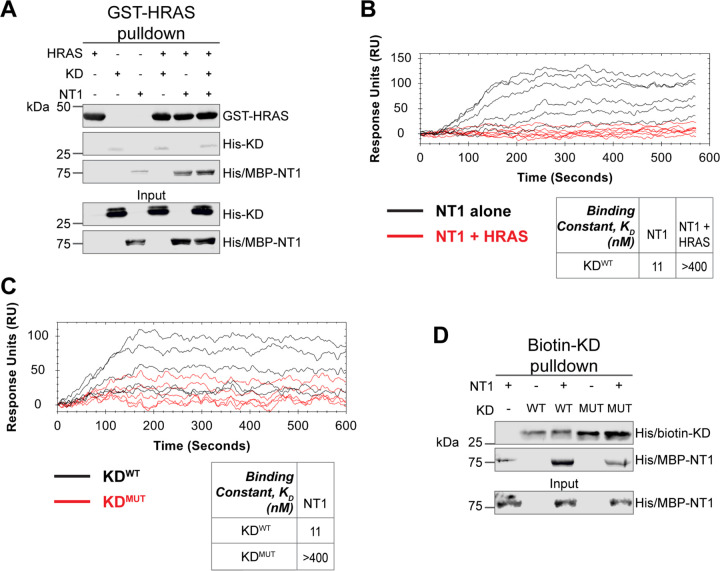
Figure 6. HRAS and KDD594G disrupt BRAF autoinhibition. (A) Western blot of pulldown assay of pre-incubated His/MBP-NT1 and His-KD added to purified active GST-HRAS on glutathione resin. Representative data of 2 independent replicates with similar results. (B) OpenSPR experiments in which NT1 at 5, 15, 44, 133, 400 nM (black) and NT1 + HRAS-GMPPNP (1:1) at 5, 15, 44, 133, and 400 nM (red) flowed over KD immobilized on carboxyl sensors. Representative data of 3 independent replicates with similar results. (C) OpenSPR experiments of NT1 at 5, 15, 44, 133, and 400 nM flowed over immobilized KDWT (black) or KDMUT (D594G; red) on carboxyl sensors. Representative data of 3 independent replicates with similar results. (D) Western blot of purified His/MBP-NT1 binding to either biotinylated His-KDWT or His-KDMUT (D594G) in pulldown assays on streptavidin beads. Representative data of 3 independent replicates with similar results.
Figure 6. HRAS and KDD594G disrupt BRAF autoinhibition. (A) Western blot of pulldown assay of pre-incubated His/MBP-NT1 and His-KD added to purified active GST-HRAS on glutathione resin. Representative data of 2 independent replicates with similar results. (B) OpenSPR experiments in which NT1 at 5, 15, 44, 133, 400 nM (black) and NT1 + HRAS-GMPPNP (1:1) at 5, 15, 44, 133, and 400 nM (red) flowed over KD immobilized on carboxyl sensors. Representative data of 3 independent replicates with similar results. (C) OpenSPR experiments of NT1 at 5, 15, 44, 133, and 400 nM flowed over immobilized KDWT (black) or KDMUT (D594G; red) on carboxyl sensors. Representative data of 3 independent replicates with similar results. (D) Western blot of purified His/MBP-NT1 binding to either biotinylated His-KDWT or His-KDMUT (D594G) in pulldown assays on streptavidin beads. Representative data of 3 independent replicates with similar results.CC BY · PubMed Central
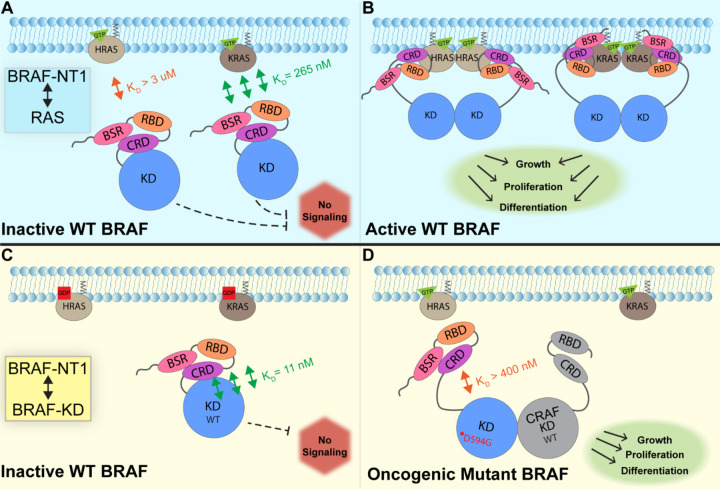
Figure 7. Model of BRAF activation. (A) BRAF is initially an autoinhibited monomer in the cytosol, in which signaling through the RAS-RAF-MEK-ERK cascade is not promoted. The BRAF N-terminal region (NT1; aa 1–288), including the BRAF Specific Region (BSR), Cysteine Rich Domain (CRD), and RAS Binding Domain (RBD), interacts with active GTP-bound RAS at the membrane in an isoform specific manner. BRAF has higher affinity for KRAS due to isoform differences, as shown through the different dissociation constants (KD) determined through OpenSPR. (B) Once bound to active H- or K-RAS, BRAF is unable to remain in the autoinhibited conformation and is subsequently activated upon dimerization, which stimulates signaling for events such as cell growth, proliferation, and differentiation. (C) Tight binding is observed with the BRAF Kinase Domain (KD; aa 442–723) and BRAF NT1, revealing the concerted action of the BSR, RBD, and CRD domains to reinforce the autoinhibited conformation and restrict signaling without upstream activation. (D) Oncogenic BRAFD594G stimulates activation of MAPK pathway through a decreased ability to remain in the autoinhibited conformation and an increased potential to dimerize with CRAF. Evading autoinhibitory regulation leads to overactivation of the signaling cascade and tumorigenesis.
Figure 7. Model of BRAF activation. (A) BRAF is initially an autoinhibited monomer in the cytosol, in which signaling through the RAS-RAF-MEK-ERK cascade is not promoted. The BRAF N-terminal region (NT1; aa 1–288), including the BRAF Specific Region (BSR), Cysteine Rich Domain (CRD), and RAS Binding Domain (RBD), interacts with active GTP-bound RAS at the membrane in an isoform specific manner. BRAF has higher affinity for KRAS due to isoform differences, as shown through the different dissociation constants (KD) determined through OpenSPR. (B) Once bound to active H- or K-RAS, BRAF is unable to remain in the autoinhibited conformation and is subsequently activated upon dimerization, which stimulates signaling for events such as cell growth, proliferation, and differentiation. (C) Tight binding is observed with the BRAF Kinase Domain (KD; aa 442–723) and BRAF NT1, revealing the concerted action of the BSR, RBD, and CRD domains to reinforce the autoinhibited conformation and restrict signaling without upstream activation. (D) Oncogenic BRAFD594G stimulates activation of MAPK pathway through a decreased ability to remain in the autoinhibited conformation and an increased potential to dimerize with CRAF. Evading autoinhibitory regulation leads to overactivation of the signaling cascade and tumorigenesis.CC BY · PubMed Central

Verification

Claims the paper makes

The claims and statistics of this paper haven’t been checked yet.

Run the check — free, no account needed. It reads the open-access text and checks the sources it cites.

A few free checks a day · papers already verified open instantly · results are public

Self-check

Percentages, sums and reported differences re-computed from the paper’s own numbers.

The self-check needs the paper’s full text.

Citations

Cites

Show all 3 references

Research works printed but not linked: 53

  1. 10.1038/nrm3979 · DOI · Paper page
  2. 10.1038/nrc1097 · DOI · Paper page
  3. 10.1038/364308a0 · DOI
  4. 10.1016/0092-8674(93)90307-C · DOI
  5. 10.1073/pnas.95.16.9214 · DOI
  6. 10.1074/jbc.M210318200 · DOI
  7. 10.1038/nature08314 · DOI
  8. 10.1073/pnas.89.17.8205 · DOI
  9. 10.1080/02699050500284218 · DOI
  10. 10.1158/0008-5472.CAN-11-2612 · DOI · Paper page
  11. 10.1038/nature00766 · DOI · Paper page
  12. 10.1210/er.2017-00232 · DOI
  13. 10.1038/s41586-019-1694-1 · DOI · Paper page
  14. 10.1016/j.ccell.2015.08.001 · DOI · Paper page
  15. 10.1038/nature08833 · DOI
  16. 10.1038/nature08902 · DOI
  17. 10.1038/s41586-019-1660-y · DOI
  18. 10.1038/358417a0 · DOI
  19. 10.1074/jbc.272.32.20139 · DOI
  20. 10.1016/s0021-9258(17)36981-8 · DOI
  21. 10.1074/jbc.M607458200 · DOI
  22. 10.1016/j.str.2018.01.011 · DOI
  23. 10.1074/jbc.270.17.9809 · DOI
  24. 10.1074/jbc.270.51.30274 · DOI
  25. 10.1074/jbc.M000397200 · DOI
  26. 10.1038/s41467-020-20241-w · DOI · Paper page
  27. 10.3390/biom11070996 · DOI
  28. 10.1038/s41467-022-28084-3 · DOI
  29. 10.1074/jbc.272.7.4378 · DOI
  30. 10.1158/0008-5472.CAN-05-1683 · DOI
  31. 10.1016/J.MOLCEL.2022.10.016 · DOI
  32. 10.1016/j.molcel.2019.09.004 · DOI
  33. 10.1158/2159-8290.CD-21-1494 · DOI
  34. 10.1016/J.MOLCEL.2023.03.008 · DOI
  35. 10.1007/s13361-011-0235-4 · DOI
  36. 10.1021/acs.analchem.9b01682 · DOI
  37. 10.1073/pnas.1816184116 · DOI
  38. 10.1073/pnas.1921968117 · DOI
  39. 10.1093/NAR/GKAB1061 · DOI · Paper page
  40. 10.1016/j.str.2014.12.017 · DOI
  41. 10.1073/pnas.91.13.5982 · DOI
  42. 10.1038/nature25478 · DOI
  43. 10.1016/j.semcdb.2011.09.002 · DOI
  44. 10.1002/cbic.201800359 · DOI
  45. 10.1074/jbc.273.34.21578 · DOI
  46. 10.1074/jbc.M501185200 · DOI
  47. 10.1074/jbc.RA119.011536 · DOI
  48. 10.1038/nature23297 · DOI
  49. 10.1074/jbc.273.37.24052 · DOI
  50. 10.1038/ng1749 · DOI
  51. 10.1126/science.1124642 · DOI
  52. 10.1038/nature23291 · DOI · Paper page
  53. 10.1016/BS.MIE.2015.06.035 · DOI

Metadata

Authors
Trebino, T., Markusic, B., Nan, H., Banerjee, S., & Wang, Z.
Affiliations
  • Rowan University (US)
  • Max Planck Institute of Biophysics (DE)
  • Wenzhou Medical University (CN)
Corresponding author
Wang, Zhihong
Venue
bioRxiv (Cold Spring Harbor Laboratory)
Publisher
openRxiv
Published
2023-04-24
OpenAlex
W4366988117
Cited by
1
References
3
Citations by year
2026: 1
Type
posted content
Language
en
Open access
Licence
cc-by
Locations
  • bioRxiv (Cold Spring Harbor Laboratory) (acceptedVersion, cc-by)
  • PubMed (publishedVersion)
  • PubMed Central (submittedVersion, cc-by)
Funders
  • University of Pennsylvania
  • National Institutes of Health
  • National Institute of General Medical Sciences (R01GM138671, R15GM128099)
Topics
  • Life Sciences › Biochemistry, Genetics and Molecular Biology › Molecular Biology › Protein Kinase Regulation and GTPase Signaling
  • Life Sciences › Biochemistry, Genetics and Molecular Biology › Molecular Biology › Melanoma and MAPK Pathways
  • Life Sciences › Biochemistry, Genetics and Molecular Biology › Molecular Biology › Protein Tyrosine Phosphatases
Keywords
BRAF, Ras isoforms, autoinhibition, cysteine-rich domain, kinase domain, Ras-binding domain, MAPK signaling, MEK phosphorylation, oncogenic BRAF, protein-protein interaction, cancer therapy

About these checks

Registry, retraction, Cites and statistics results are computed, not judged, with one exception: a printed reference that no index lists is read once by a model before it counts as a citation error. Claims are extracted by a model and kept only when their quote appears verbatim in the text; each cited source is then checked, with a model’s help, for whether it says what the claim relies on. Those verdicts can be wrong — read the claim’s quote and the cited source before relying on one.

Statistics and arithmetic are recomputed, not judged.

Confidence bands are shown only for fields calibrated on our annotated test set. None is calibrated yet, so no band is shown.

What counts as a claim ›How we measure confidence ›How we check this ›

Are you an author, or do you see a problem with this page? Request a review

How to cite

Cite CoChat for the checks on this page, and the paper for its own findings.

This page
CoChat. (2026). Citation check: Unveiling the Domain-Specific and RAS Isoform-Specific Details of BRAF Regulation. https://app.cochat.ai/papers/10.1101/2023.04.24.538112
The paper
Trebino, T., Markusic, B., Nan, H., Banerjee, S., & Wang, Z. (2023). Unveiling the Domain-Specific and RAS Isoform-Specific Details of BRAF Regulation. bioRxiv (Cold Spring Harbor Laboratory). https://doi.org/10.1101/2023.04.24.538112