PreprintCited by 12Circadian rhythm and melatoninRNA Research and SplicingPlant Molecular Biology Research

The DOI matches its Crossref record; 1 of the 1 references it cites were found in a registry or an index.

Coordination of rhythmic RNA synthesis and degradation orchestrates 24-hour and 12-hour RNA expression patterns in mouse fibroblasts

Open access
Unruh, Benjamin A., Weidemann, Douglas E., Kojima, Shihoko·2023·Proceedings of the National Academy of Sciences

Preprint — published as 10.1073/pnas.2314690121

Abstract

Circadian RNA expression is essential to ultimately regulate a plethora of downstream rhythmic biochemical, physiological, and behavioral processes. Both transcriptional and post transcriptional mechanisms are considered important to drive rhythmic RNA expression, however, the extent to which each regulatory process contributes to the rhythmic RNA expression remains controversial. To systematically address this, we monitored RNA dynamics using metabolic RNA labeling technology during a circadian cycle in mouse fibroblasts. We find that rhythmic RNA synthesis is the primary contributor of 24 hr RNA rhythms, while rhythmic degradation is more important for 12 hr RNA rhythms. These rhythms were predominantly regulated by Bmal1 and/or the core clock mechanism, and interplay between rhythmic synthesis and degradation has a significant impact in shaping rhythmic RNA expression patterns. Interestingly, core clock RNAs are regulated by multiple rhythmic processes and have the highest amplitude of synthesis and degradation, presumably critical to sustain robust rhythmicity of cell-autonomous circadian rhythms. Our study yields invaluable insights into the temporal dynamics of both 24 hr and 12 hr RNA rhythms in mouse fibroblasts.

Overview

The claims and statistics of this paper haven’t been checked yet.

Run the check — free, no account needed. It reads the open-access text and checks the sources it cites.

A few free checks a day · papers already verified open instantly · results are public

Integrity signals

Registry

Crossref · 10.1101/2023.07.26.550672

Cites

1 of 1 references verified0 citation errors · 0 not checkable

Statistics

Figures

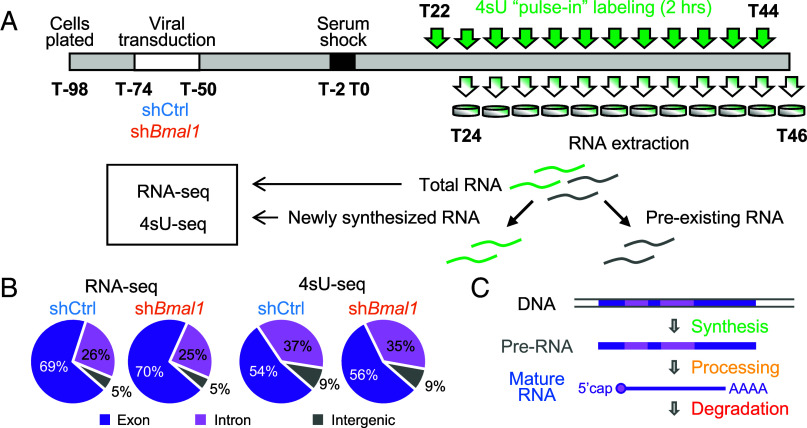
Fig. 1. Rhythmic 4sU-seq and RNA-seq analysis in NIH3T3 cells. (A) Experimental design. Cells were plated 24 h before lentiviral transduction (72 h) containing scrambled shRNA (shCtrl) or shRNA targeting Bmal1 (shBmal1) (40, 41). Cells were then incubated with 50% horse serum for 2 h to synchronize cellular circadian rhythms. Twenty-two hours after the serum shock, 400 mM 4sU was added to the culture media for 2 h to label newly synthesized RNAs of the first sample. At the end of the 2-h incubation, RNAs were harvested. We repeated this procedure every 2 h starting from T22 until T44. Newly synthesized RNAs were then isolated from total RNAs, and both total and newly synthesized RNAs were subjected to RNA-seq analysis. (B) Percentage of read counts mapped to exon (dark purple), intron (light purple), or intergenic region (gray). The average from all time points in each dataset was used. (C) Schematic representation of the lifecycle of an RNA.
Fig. 1. Rhythmic 4sU-seq and RNA-seq analysis in NIH3T3 cells. (A) Experimental design. Cells were plated 24 h before lentiviral transduction (72 h) containing scrambled shRNA (shCtrl) or shRNA targeting Bmal1 (shBmal1) (40, 41). Cells were then incubated with 50% horse serum for 2 h to synchronize cellular circadian rhythms. Twenty-two hours after the serum shock, 400 mM 4sU was added to the culture media for 2 h to label newly synthesized RNAs of the first sample. At the end of the 2-h incubation, RNAs were harvested. We repeated this procedure every 2 h starting from T22 until T44. Newly synthesized RNAs were then isolated from total RNAs, and both total and newly synthesized RNAs were subjected to RNA-seq analysis. (B) Percentage of read counts mapped to exon (dark purple), intron (light purple), or intergenic region (gray). The average from all time points in each dataset was used. (C) Schematic representation of the lifecycle of an RNA.CC BY-NC-ND · PubMed Central
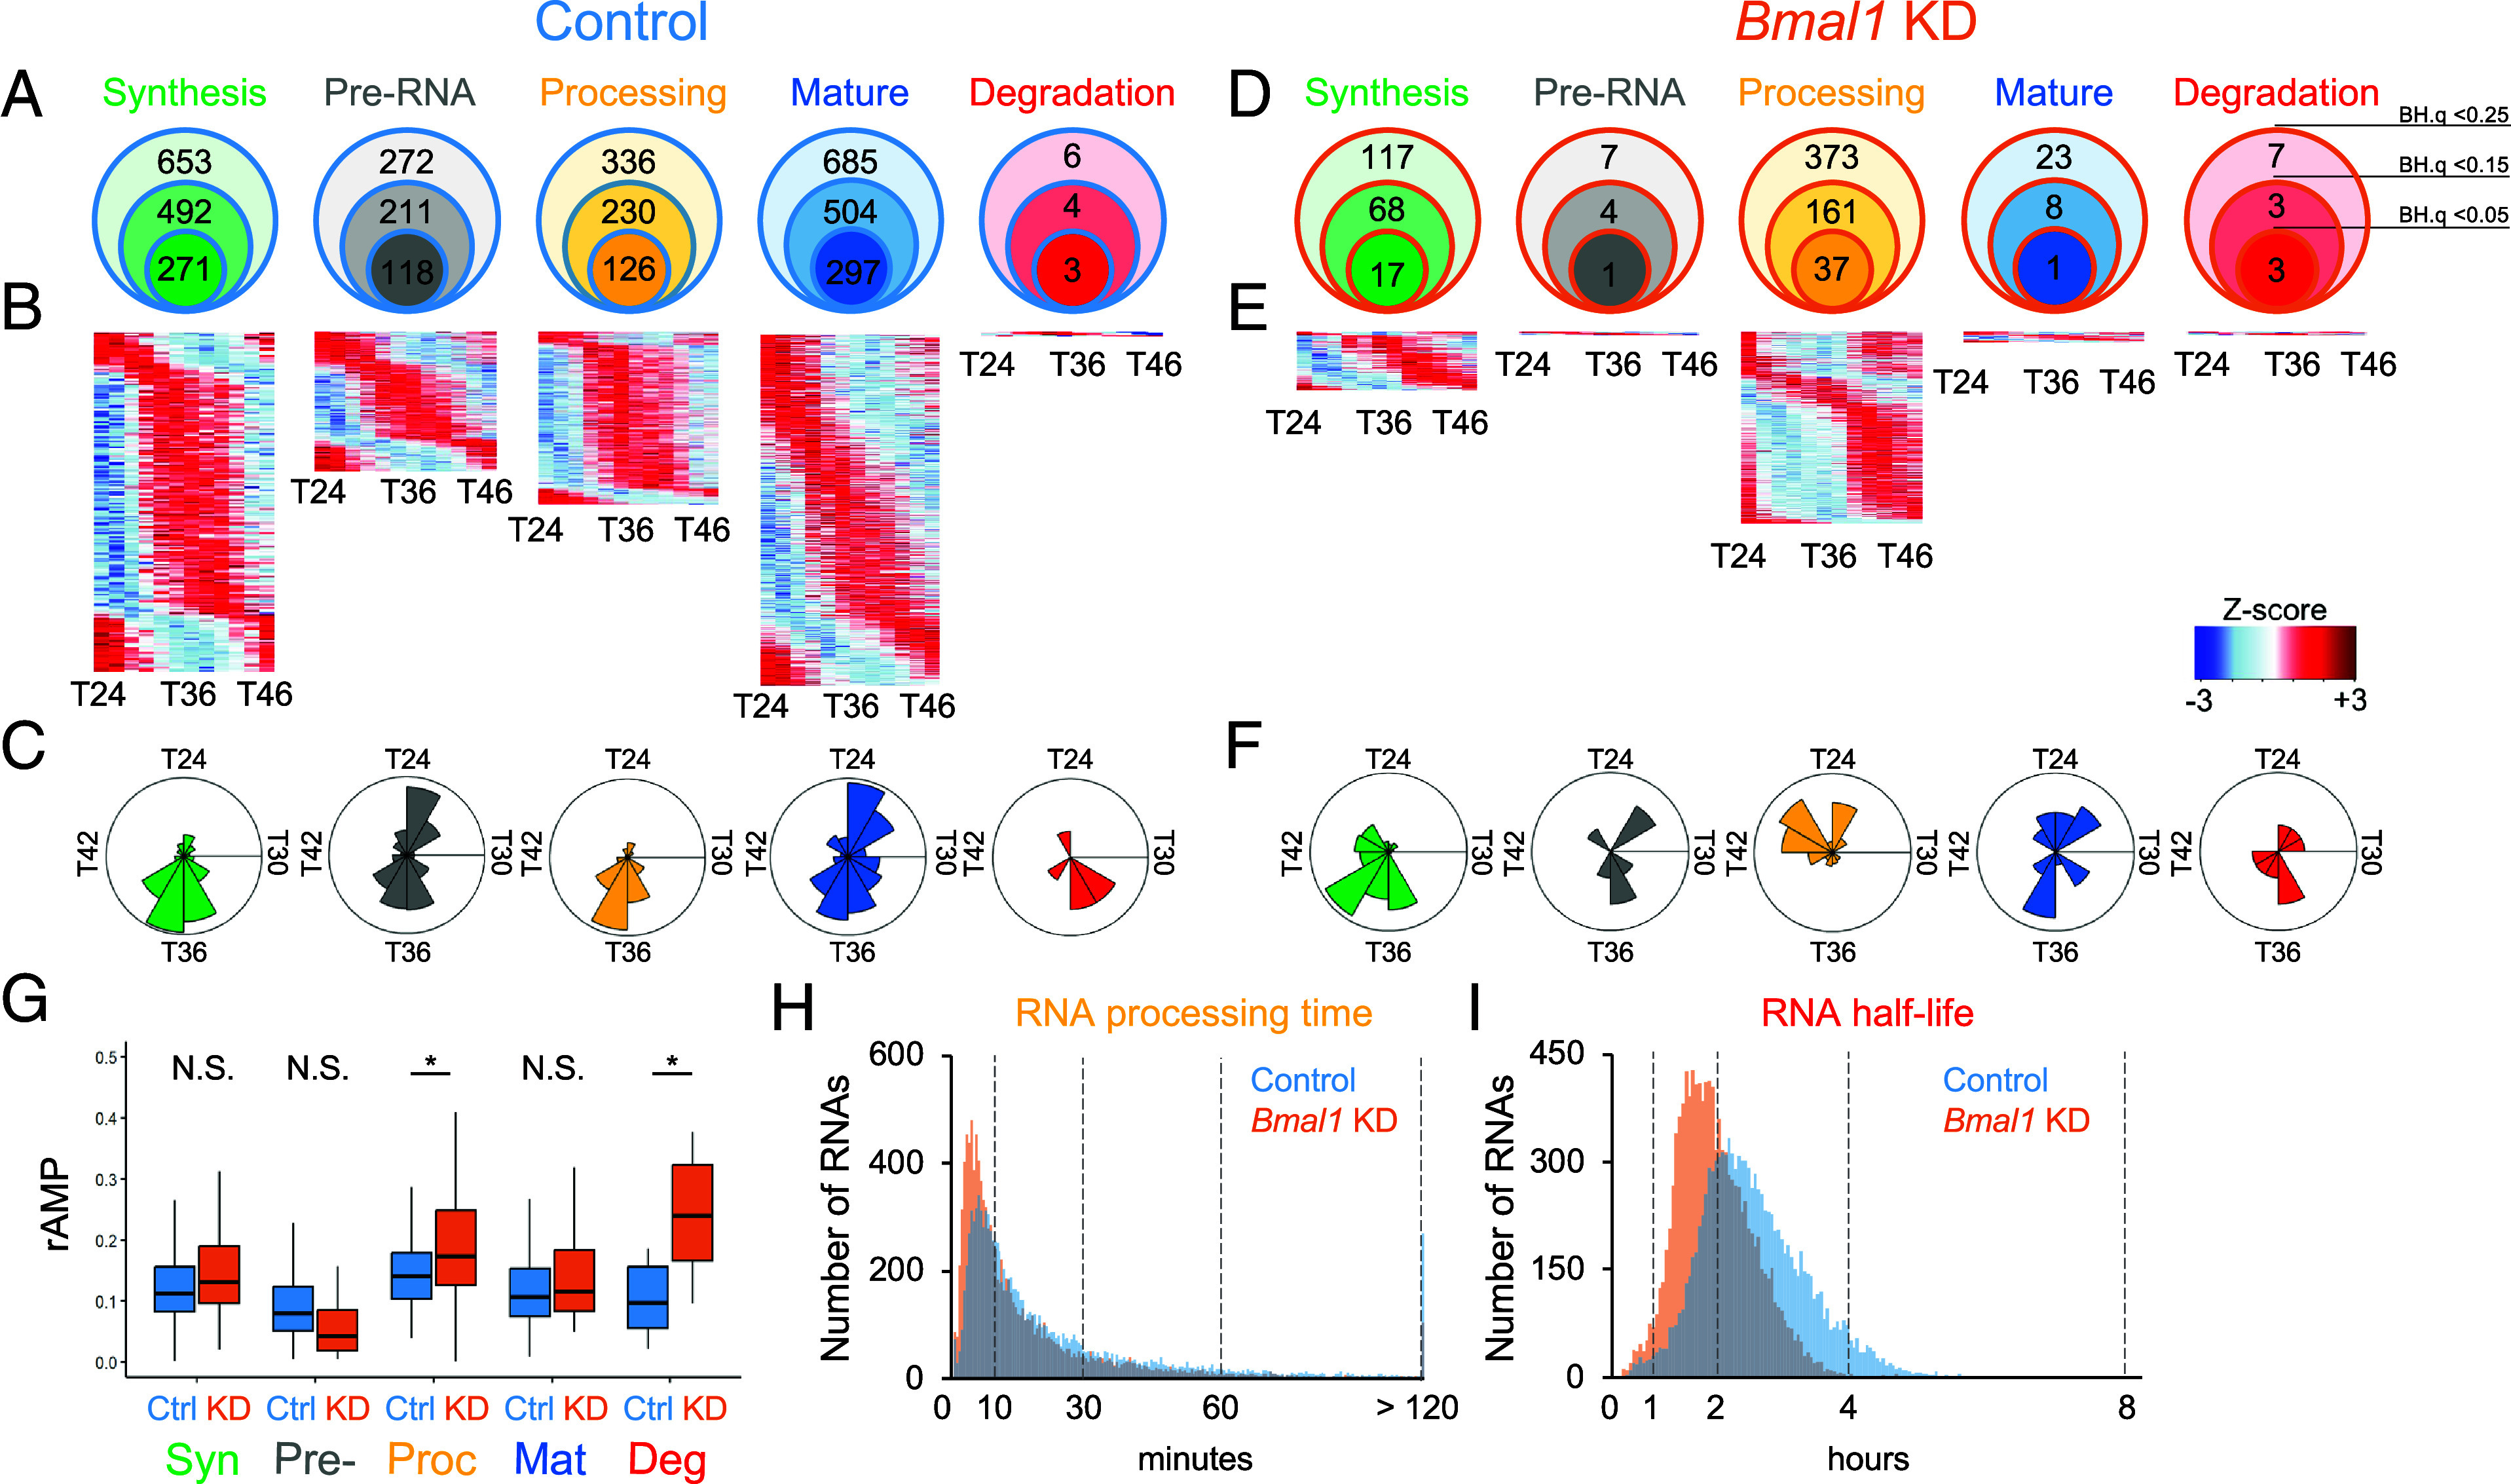
Fig. 2. Rhythmicity of RNA dynamics in NIH3T3 cells. A total of 11,313 genes were analyzed in all datasets. (A and D) Number of RNAs whose RNA synthesis (green), processing (yellow), or degradation (red) as well as unprocessed (gray) or mature RNA (blue) levels were rhythmic in control (A) or Bmal1 KD (D) cells with various statistical thresholds (B.H. q < 0.25, 0.15, or 0.05). (B and E) Phase-sorted heatmap of RNAs with rhythmic RNA synthesis (green), unprocessed RNA levels (gray), processing (yellow), mature RNA levels (blue), and degradation (red) in control (B) or Bmal1 KD (E) cells with the rhythmicity cutoff as B.H. q < 0.25. Color represents Z-scores, in which red is high while blue is low. Each line represents one RNA. (C and F) Circular histograms representing the peak phase distribution of rhythmic RNA synthesis (green), processing (yellow), or degradation (red) as well as pre- (gray) or mature RNA (blue) levels. Each bin represents 2 h. Number of genes are represented by the radius, and the outer radius represented 170 (synthesis), 60 (pre-RNA), 120 (processing), 120 (mature RNA), and 3 (degradation) RNAs in control and 30 (synthesis), 3 (pre-RNA), 100 (processing), 6 (mature RNA), and 3 (degradation) RNAs in Bmal1 KD cells. (G) Distribution of relative amplitude (rAMP) for rhythmic RNAs in control (blue) and Bmal1 KD (orange) cells. Boxplots represent two quartiles ± 1.5 interquartile range from the median (midline). *; P < 0.05, N.S.; P > 0.05 (two-tailed Student’s t test). (H and I) Distribution of RNA processing time (H) and half-life (I) in control (blue) and Bmal1 KD (orange) cells. The average of all time points was used.
Fig. 2. Rhythmicity of RNA dynamics in NIH3T3 cells. A total of 11,313 genes were analyzed in all datasets. (A and D) Number of RNAs whose RNA synthesis (green), processing (yellow), or degradation (red) as well as unprocessed (gray) or mature RNA (blue) levels were rhythmic in control (A) or Bmal1 KD (D) cells with various statistical thresholds (B.H. q < 0.25, 0.15, or 0.05). (B and E) Phase-sorted heatmap of RNAs with rhythmic RNA synthesis (green), unprocessed RNA levels (gray), processing (yellow), mature RNA levels (blue), and degradation (red) in control (B) or Bmal1 KD (E) cells with the rhythmicity cutoff as B.H. q < 0.25. Color represents Z-scores, in which red is high while blue is low. Each line represents one RNA. (C and F) Circular histograms representing the peak phase distribution of rhythmic RNA synthesis (green), processing (yellow), or degradation (red) as well as pre- (gray) or mature RNA (blue) levels. Each bin represents 2 h. Number of genes are represented by the radius, and the outer radius represented 170 (synthesis), 60 (pre-RNA), 120 (processing), 120 (mature RNA), and 3 (degradation) RNAs in control and 30 (synthesis), 3 (pre-RNA), 100 (processing), 6 (mature RNA), and 3 (degradation) RNAs in Bmal1 KD cells. (G) Distribution of relative amplitude (rAMP) for rhythmic RNAs in control (blue) and Bmal1 KD (orange) cells. Boxplots represent two quartiles ± 1.5 interquartile range from the median (midline). *; P < 0.05, N.S.; P > 0.05 (two-tailed Student’s t test). (H and I) Distribution of RNA processing time (H) and half-life (I) in control (blue) and Bmal1 KD (orange) cells. The average of all time points was used.CC BY-NC-ND · PubMed Central
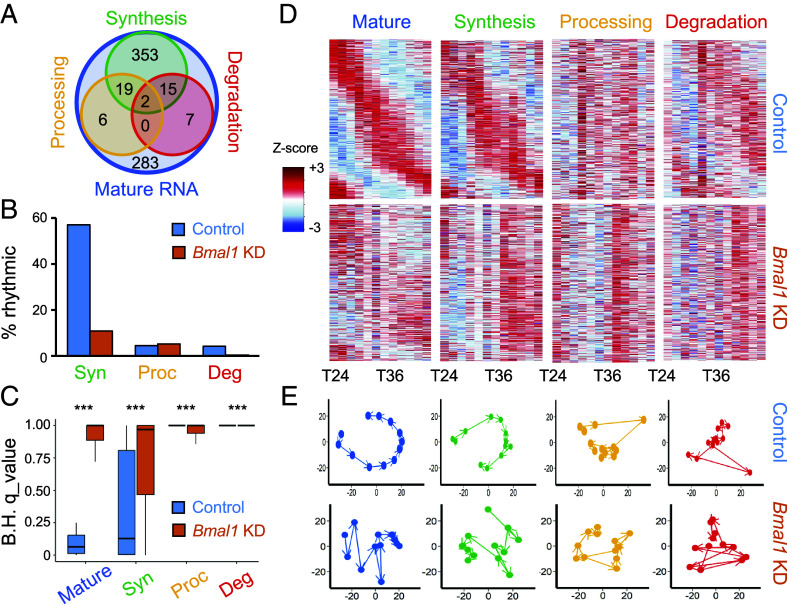
Fig. 3. Rhythmic RNA synthesis is the major driver for rhythmic RNA expression in NIH3T3 cells. 685 rhythmic mature RNAs in control cells were analyzed in all datasets. (A) Venn diagram shows the number of rhythmic RNAs in synthesis (green), processing (yellow), and degradation (red) was rhythmic (B.H. q < 0.25). (B) The percentage of RNAs with statistically significant synthesis, processing, or degradation rhythms (B.H. q < 0.25) among the 685 rhythmic mature RNAs in control cells. (C) Distribution of adjusted B.H. q values for the 685 rhythmic RNAs in each dataset. Box plots represent two quartiles ± 1.5 interquartile range from the median (midline). ***; P < 1.0 × 10⁻¹³ (two-tailed Mann–Whiney U test). (D) Phase-sorted heatmap of 685 rhythmic mature RNAs (blue) for their RNA synthesis (green), processing (yellow), and degradation (red) in control (Top) and Bmal1 KD (Bottom) cells. Color represents Z-scores, in which red is high while blue is low. Each line represents one RNA. (E) Principal component analyses of the 685 rhythmic RNAs in each dataset in control (Top) or Bmal1 KD (Bottom) cells. The first two components in each dataset are plotted against each other. Arrows represent the progression of time from T24 to T46. Variation of each principal component in control cells: Mature RNA (PC1—49%, PC2—29%), Synthesis (PC1—40%, PC2—22%), Processing (PC1—28%, PC2—16%), and Degradation (PC1—23%, PC2—18%); or in Bmal1 KD cells: Mature RNA (PC1—39%, PC2—24%), Synthesis (PC1—38%, PC2—26%), Processing (PC1—33%, PC2—16%), and Degradation (PC1—33%, PC2—24%).
Fig. 3. Rhythmic RNA synthesis is the major driver for rhythmic RNA expression in NIH3T3 cells. 685 rhythmic mature RNAs in control cells were analyzed in all datasets. (A) Venn diagram shows the number of rhythmic RNAs in synthesis (green), processing (yellow), and degradation (red) was rhythmic (B.H. q < 0.25). (B) The percentage of RNAs with statistically significant synthesis, processing, or degradation rhythms (B.H. q < 0.25) among the 685 rhythmic mature RNAs in control cells. (C) Distribution of adjusted B.H. q values for the 685 rhythmic RNAs in each dataset. Box plots represent two quartiles ± 1.5 interquartile range from the median (midline). ***; P < 1.0 × 10⁻¹³ (two-tailed Mann–Whiney U test). (D) Phase-sorted heatmap of 685 rhythmic mature RNAs (blue) for their RNA synthesis (green), processing (yellow), and degradation (red) in control (Top) and Bmal1 KD (Bottom) cells. Color represents Z-scores, in which red is high while blue is low. Each line represents one RNA. (E) Principal component analyses of the 685 rhythmic RNAs in each dataset in control (Top) or Bmal1 KD (Bottom) cells. The first two components in each dataset are plotted against each other. Arrows represent the progression of time from T24 to T46. Variation of each principal component in control cells: Mature RNA (PC1—49%, PC2—29%), Synthesis (PC1—40%, PC2—22%), Processing (PC1—28%, PC2—16%), and Degradation (PC1—23%, PC2—18%); or in Bmal1 KD cells: Mature RNA (PC1—39%, PC2—24%), Synthesis (PC1—38%, PC2—26%), Processing (PC1—33%, PC2—16%), and Degradation (PC1—33%, PC2—24%).CC BY-NC-ND · PubMed Central
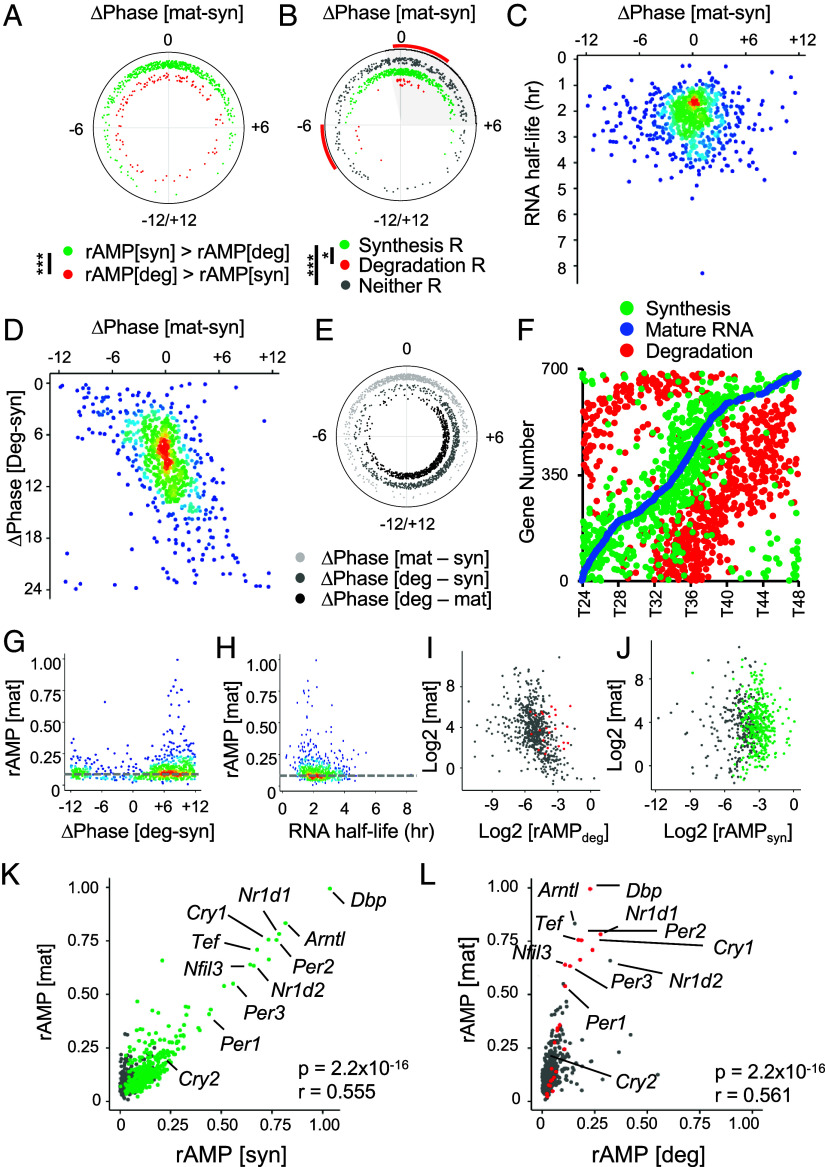
Fig. 4. Effects of rhythmic RNA synthesis and degradation on the phase and amplitude of RNA rhythms. 685 rhythmic mature RNAs in control cells were analyzed in all datasets. (A and B) Phase difference between mature RNA expression and RNA synthesis (ΔPhase [mat-syn] in h) when the relative amplitude of RNA synthesis (rAMP [syn]) is higher than that of RNA degradation (rAMP [deg]) (green) or the relative amplitude of RNA degradation (rAMP [deg]) is higher than that of RNA synthesis (rAMP [syn]) (red) (A) or when RNA synthesis is rhythmic (green), degradation is rhythmic (red), and neither is rhythmic (gray) (B.H. q < 0.25) (B). ***; P < 0.001, *; P < 0.05 (Watson–Wheeler test). (C) Relationship between RNA half-lives (average of all time points) and phase difference between mature RNA expression and RNA synthesis (ΔPhase [mat-syn]). (D) Relationship between the phase difference between mature RNA levels and RNA synthesis (ΔPhase [mat-syn]) and the phase difference between RNA synthesis and degradation (ΔPhase [deg-syn]). (E) Phase difference (h) between mature RNA levels and RNA synthesis (light gray), RNA synthesis and degradation (dark gray), and mature RNA and RNA degradation (black). (F) Peak phases of RNA synthesis (green), mature RNA (blue), and degradation (red). (G and H) Relationship between the relative amplitude of mature RNA expression (rAMP [mat]) and the phase difference between RNA synthesis and degradation (ΔPhase [deg-syn]) (G) or RNA half-lives (H). (I and J) Correlation between the level of mature RNA and relative amplitude of RNA degradation rate (rAMP [deg]) (I) or synthesis rate (rAMP [syn]) (J). All values are log2 transformed. (K and L) Correlation between the relative amplitude of mature RNA (rAMP [mat]) and that of RNA synthesis (K) or degradation rate (L). r: Pearson correlation coefficient. Colored dots represent those that are statistically rhythmic (B.H. q < 0.25) for synthesis (J and K) or degradation (I and L), whereas gray dots are statistically not rhythmic.
Fig. 4. Effects of rhythmic RNA synthesis and degradation on the phase and amplitude of RNA rhythms. 685 rhythmic mature RNAs in control cells were analyzed in all datasets. (A and B) Phase difference between mature RNA expression and RNA synthesis (ΔPhase [mat-syn] in h) when the relative amplitude of RNA synthesis (rAMP [syn]) is higher than that of RNA degradation (rAMP [deg]) (green) or the relative amplitude of RNA degradation (rAMP [deg]) is higher than that of RNA synthesis (rAMP [syn]) (red) (A) or when RNA synthesis is rhythmic (green), degradation is rhythmic (red), and neither is rhythmic (gray) (B.H. q < 0.25) (B). ***; P < 0.001, *; P < 0.05 (Watson–Wheeler test). (C) Relationship between RNA half-lives (average of all time points) and phase difference between mature RNA expression and RNA synthesis (ΔPhase [mat-syn]). (D) Relationship between the phase difference between mature RNA levels and RNA synthesis (ΔPhase [mat-syn]) and the phase difference between RNA synthesis and degradation (ΔPhase [deg-syn]). (E) Phase difference (h) between mature RNA levels and RNA synthesis (light gray), RNA synthesis and degradation (dark gray), and mature RNA and RNA degradation (black). (F) Peak phases of RNA synthesis (green), mature RNA (blue), and degradation (red). (G and H) Relationship between the relative amplitude of mature RNA expression (rAMP [mat]) and the phase difference between RNA synthesis and degradation (ΔPhase [deg-syn]) (G) or RNA half-lives (H). (I and J) Correlation between the level of mature RNA and relative amplitude of RNA degradation rate (rAMP [deg]) (I) or synthesis rate (rAMP [syn]) (J). All values are log2 transformed. (K and L) Correlation between the relative amplitude of mature RNA (rAMP [mat]) and that of RNA synthesis (K) or degradation rate (L). r: Pearson correlation coefficient. Colored dots represent those that are statistically rhythmic (B.H. q < 0.25) for synthesis (J and K) or degradation (I and L), whereas gray dots are statistically not rhythmic.CC BY-NC-ND · PubMed Central
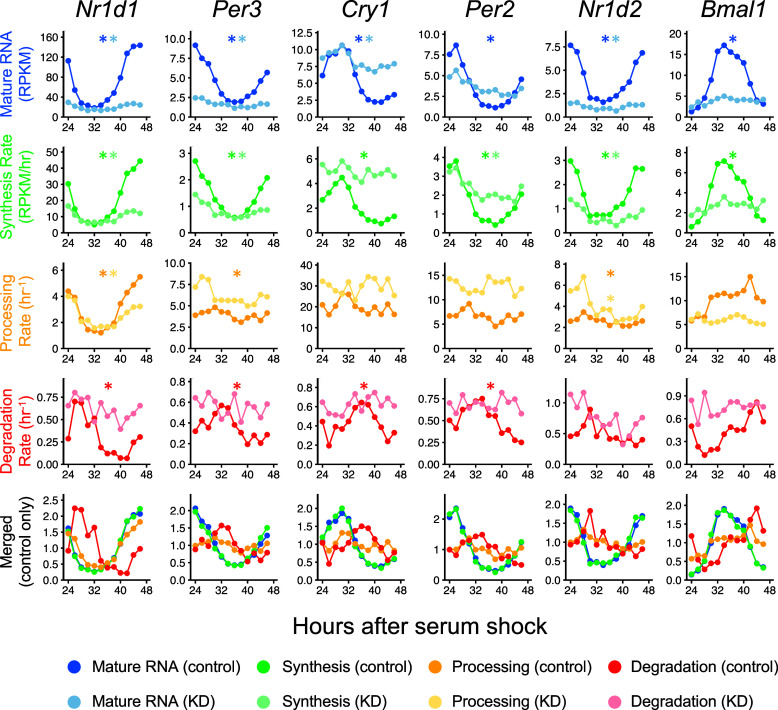
Fig. 5. Multiple rhythmic processes regulate most core clock gene expression. Time-series data of mature RNA levels (blue), RNA synthesis rate (green), processing rate (yellow), and degradation rate (red) in control and Bmal1 KD cells. In the merged plots (Bottom), all values were normalized by dividing values at each time point by the average across all time points for each gene. Asterisks represent adjusted B.H. q < 0.25.
Fig. 5. Multiple rhythmic processes regulate most core clock gene expression. Time-series data of mature RNA levels (blue), RNA synthesis rate (green), processing rate (yellow), and degradation rate (red) in control and Bmal1 KD cells. In the merged plots (Bottom), all values were normalized by dividing values at each time point by the average across all time points for each gene. Asterisks represent adjusted B.H. q < 0.25.CC BY-NC-ND · PubMed Central
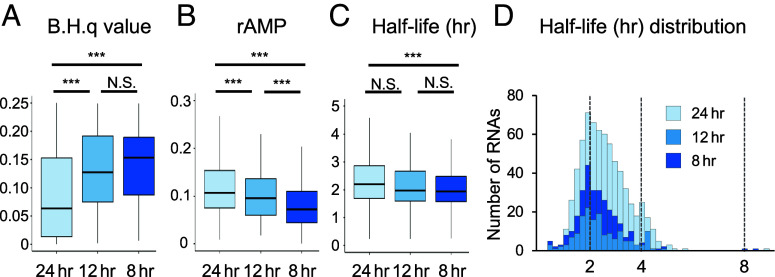
Fig. 6. Comparison between 8-, 12-, and 24-h RNA rhythms. (A) Distribution of B.H. q values, (B) relative amplitude (rAMP), and (C) RNA half-lives (h) of RNAs with 24-h (n = 685), 12-h (n = 161), and 8-h (n = 293) rhythms (B.H. q < 0.25). Box plots represent two quartiles ± 1.5 interquartile range from the median (midline). Tests for differences among groups: (A) Kruskal–Wallis test, P = 6.4 × 10⁻²⁸; (B) Kruskal–Wallis test, P = 4.5 × 10⁻²³; and (C) one-way ANOVA, P = 0.0003. Asterisks indicate results of post hoc pairwise comparisons (A and B: Mann–Whitney U test with Bonferroni correction. C: Tukey HSD test): ***; P < 0.01, N.S.; P > 0.05. (D) Distribution of RNA half-life for rhythmic RNAs with 24-h (median: 2.20 h), 12-h (median: 1.97 h), and 8-h (median: 1.94 h) periods.
Fig. 6. Comparison between 8-, 12-, and 24-h RNA rhythms. (A) Distribution of B.H. q values, (B) relative amplitude (rAMP), and (C) RNA half-lives (h) of RNAs with 24-h (n = 685), 12-h (n = 161), and 8-h (n = 293) rhythms (B.H. q < 0.25). Box plots represent two quartiles ± 1.5 interquartile range from the median (midline). Tests for differences among groups: (A) Kruskal–Wallis test, P = 6.4 × 10⁻²⁸; (B) Kruskal–Wallis test, P = 4.5 × 10⁻²³; and (C) one-way ANOVA, P = 0.0003. Asterisks indicate results of post hoc pairwise comparisons (A and B: Mann–Whitney U test with Bonferroni correction. C: Tukey HSD test): ***; P < 0.01, N.S.; P > 0.05. (D) Distribution of RNA half-life for rhythmic RNAs with 24-h (median: 2.20 h), 12-h (median: 1.97 h), and 8-h (median: 1.94 h) periods.CC BY-NC-ND · PubMed Central
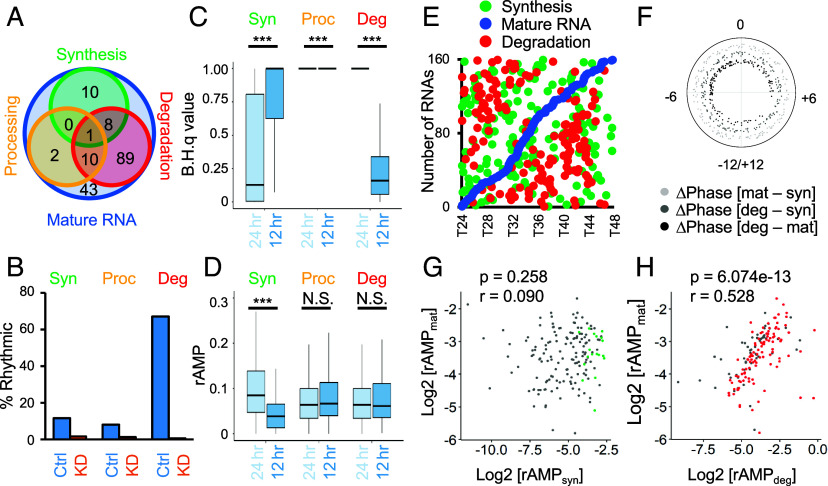
Fig. 7. Twelve-hour RNA rhythms are primarily driven by rhythmic degradation. 161 rhythmic mature RNAs with a period of 12 h in control cells were analyzed. (A) Venn diagram showing the number of RNAs whose RNA synthesis (green), processing (yellow), and degradation (red) was rhythmic (B.H. q < 0.25). (B) The percentage of RNAs with statistically significant synthesis, processing, or degradation rhythms (B.H. q < 0.25) among the 161 rhythmic mature RNAs with a period of 12 h in control (blue) and Bmal1 KD (orange) cells. (C) Distribution of adjusted B.H. q values for the 685 24-h (Left) or 161 12-h rhythmic RNAs (Right) in control cells. (D) Distribution of relative amplitude (rAMP) for the 685 24-h or 161 12-h rhythmic RNAs in control cells. Box plots represent two quartiles ± 1.5 interquartile range from the median (midline). ***; P-value < 0.001, N.S.; P > 0.05 (C: two-tailed Mann–Whitney U test, D: two-tailed Student’s t test). (E) Peak phases of RNA synthesis rate (green), mature RNA levels (blue), and degradation rate (red). (F) Phase difference (h) between mature RNA levels and RNA synthesis (light gray), RNA synthesis and degradation (dark gray), and mature RNA and RNA degradation (black). (G and H) Correlation between the relative amplitude of mature RNA and RNA synthesis rate (G) or degradation rate (H). All values are log2 transformed. r: Pearson correlation coefficient. Colored dots represent those that are statistically rhythmic (B.H. q < 0.25), whereas gray dots are statistically not rhythmic.
Fig. 7. Twelve-hour RNA rhythms are primarily driven by rhythmic degradation. 161 rhythmic mature RNAs with a period of 12 h in control cells were analyzed. (A) Venn diagram showing the number of RNAs whose RNA synthesis (green), processing (yellow), and degradation (red) was rhythmic (B.H. q < 0.25). (B) The percentage of RNAs with statistically significant synthesis, processing, or degradation rhythms (B.H. q < 0.25) among the 161 rhythmic mature RNAs with a period of 12 h in control (blue) and Bmal1 KD (orange) cells. (C) Distribution of adjusted B.H. q values for the 685 24-h (Left) or 161 12-h rhythmic RNAs (Right) in control cells. (D) Distribution of relative amplitude (rAMP) for the 685 24-h or 161 12-h rhythmic RNAs in control cells. Box plots represent two quartiles ± 1.5 interquartile range from the median (midline). ***; P-value < 0.001, N.S.; P > 0.05 (C: two-tailed Mann–Whitney U test, D: two-tailed Student’s t test). (E) Peak phases of RNA synthesis rate (green), mature RNA levels (blue), and degradation rate (red). (F) Phase difference (h) between mature RNA levels and RNA synthesis (light gray), RNA synthesis and degradation (dark gray), and mature RNA and RNA degradation (black). (G and H) Correlation between the relative amplitude of mature RNA and RNA synthesis rate (G) or degradation rate (H). All values are log2 transformed. r: Pearson correlation coefficient. Colored dots represent those that are statistically rhythmic (B.H. q < 0.25), whereas gray dots are statistically not rhythmic.CC BY-NC-ND · PubMed Central

Verification

Claims the paper makes

The claims and statistics of this paper haven’t been checked yet.

Run the check — free, no account needed. It reads the open-access text and checks the sources it cites.

A few free checks a day · papers already verified open instantly · results are public

Self-check

Percentages, sums and reported differences re-computed from the paper’s own numbers.

The self-check needs the paper’s full text.

Citations

Cites

  • Global quantification of mammalian gene expression control

    Schwanhäusser, B., Busse, D., Li, N., Dittmar, G., Schuchhardt, J., Wolf, J., Chen, W., & Selbach, M. (2011) · Nature · doi:10.1038/nature10098 · Cited by 6,566 · cited 3×

    “Nevertheless, our data from NIH3T3 cells closely align with other circadian transcriptome and 4sU-seq studies 38, 47 and provide critical RNA dynamics information to fully understand how the core circadian clock machinery shapes RNA rhythms.”
    Influential

Research works printed but not linked: 76

  1. 10.1038/nrn1177 · DOI
  2. 10.1146/annurev.genom.5.061903.175925 · DOI · Paper page
  3. 2020, The Making and Breaking of RNAs: Dynamics of Rhythmic RNA Expression in Mammals, J Biol Rhythms, 35, 519, 10.1177/0748730420957498 · DOI
  4. 10.1242/jcs.1992.supplement_16.15 · DOI
  5. 10.1073/pnas.1715225115 · DOI
  6. 10.1016/j.celrep.2014.09.021 · DOI
  7. 10.1038/nrg.2016.150 · DOI
  8. 10.1038/ng1504 · DOI
  9. 10.1073/pnas.1408886111 · DOI · Paper page
  10. 10.1038/s41598-020-78851-9 · DOI
  11. 2023, Defining the age-dependent and tissue-specific circadian transcriptome in male mice, Cell Rep, 42, 111982, 10.1016/j.celrep.2022.111982 · DOI
  12. 10.1101/gr.222430.117 · DOI
  13. 10.7554/eLife.00011 · DOI
  14. 10.1126/science.1226339 · DOI · Paper page
  15. 10.1073/pnas.1515308112 · DOI
  16. 10.1016/j.cub.2013.08.005 · DOI
  17. 2020, microRNA-25 as a novel modulator of circadian Period2 gene oscillation, Exp Mol Med, 52, 1614, 10.1038/s12276-020-00496-5 · DOI
  18. 10.1242/jcs.065771 · DOI
  19. 10.1101/gad.208306.112 · DOI
  20. 2018, Temporal Control of Metabolic Amplitude by Nocturnin, Cell Rep, 22, 1225, 10.1016/j.celrep.2018.01.011 · DOI
  21. 10.1093/nar/gkn893 · DOI
  22. 10.1128/MCB.01154-09 · DOI
  23. 10.1016/j.cell.2013.10.026 · DOI
  24. 10.1101/gad.1781009 · DOI
  25. Du NH , Arpat AB , De Matos M , Gatfield D . MicroRNAs shape circadian hepatic gene expression on a transcriptome-wide scale. Elife 3, e02510 (2014). · DOI
  26. 10.1371/journal.pone.0011264 · DOI
  27. 10.1126/science.3388044 · DOI
  28. 10.1523/JNEUROSCI.3228-11.2012 · DOI
  29. Wada T , Becskei A . Impact of Methods on the Measurement of mRNA Turnover. Int J Mol Sci 18, (2017). · DOI
  30. 2019, Contributions of regulated transcription and mRNA decay to the dynamics of gene expression, Wiley Interdiscip Rev RNA, 10, e1508, 10.1002/wrna.1508 · DOI
  31. 10.1126/science.1217726 · DOI
  32. 10.1016/S0092-8674(00)00205-1 · DOI · Paper page
  33. 10.1016/S0092-8674(00)81199-X · DOI · Paper page
  34. 10.1016/j.ymeth.2017.02.003 · DOI
  35. Rädle B , Rutkowski AJ , Ruzsics Z , Friedel CC , Koszinowski UH , Dölken L . Metabolic labeling of newly transcribed RNA for high resolution gene expression profiling of RNA synthesis, processing and decay in cell culture. J Vis Exp, (2013). · DOI
  36. 10.1177/0748730417728663 · DOI
  37. 10.1093/bioinformatics/btv288 · DOI
  38. 10.1093/bioinformatics/btw309 · DOI
  39. 10.1093/bioinformatics/btw405 · DOI
  40. 10.1371/journal.pgen.1000442 · DOI
  41. 2022, Venn diagram analysis overestimates the extent of circadian rhythm reprogramming, Febs j, 289, 6605, 10.1111/febs.16095 · DOI
  42. 10.1177/0748730418813785 · DOI
  43. Obodo D , Outland EH , Hughey JJ . LimoRhyde2: genomic analysis of biological rhythms based on effect sizes. bioRxiv, (2023). · DOI
  44. 2020, Critical role of deadenylation in regulating poly(A) rhythms and circadian gene expression, PLoS Comput Biol, 16, e1007842, 10.1371/journal.pcbi.1007842 · DOI · Paper page
  45. 10.1261/rna.062877.117 · DOI
  46. 10.1093/nar/gkp542 · DOI · Paper page
  47. 10.1261/rna.1136108 · DOI
  48. 10.1101/gr.156919.113 · DOI
  49. 10.1096/fj.201600872R · DOI
  50. 2017, A Cell-Autonomous Mammalian 12 hr Clock Coordinates Metabolic and Stress Rhythms, Cell Metabolism, 25, 1305, 10.1016/j.cmet.2017.05.004 · DOI · Paper page
  51. 10.1371/journal.pbio.3000580 · DOI · Paper page
  52. 10.1371/journal.pbio.1001442 · DOI
  53. 10.1016/j.cell.2014.10.022 · DOI
  54. 2019, RNA sequencing: the teenage years, Nat Rev Genet, 20, 631, 10.1038/s41576-019-0150-2 · DOI
  55. 2022, Mechanisms of cellular mRNA transcript homeostasis, Trends in Cell Biology, 32, 655, 10.1016/j.tcb.2022.05.003 · DOI
  56. 10.1016/J.MOLCEL.2018.08.023 · DOI
  57. 10.1016/j.cell.2013.05.012 · DOI
  58. 10.1016/j.molcel.2016.06.036 · DOI
  59. 10.1371/journal.pgen.1002273 · DOI
  60. 10.1016/j.molcel.2013.09.010 · DOI
  61. 10.1101/gr.130161.111 · DOI
  62. 10.1016/j.molcel.2017.08.014 · DOI
  63. 10.1080/15476286.2019.1621121 · DOI
  64. Mufteev M , et al. Transcriptional buffering and 3’UTR lengthening are shaped during human neurodevelopment by shifts in mRNA stability and microRNA load. bioRxiv, (2023). · DOI
  65. 10.1371/journal.pgen.1007156 · DOI
  66. Ramanathan C , Khan SK , Kathale ND , Xu H , Liu AC . Monitoring cell-autonomous circadian clock rhythms of gene expression using luciferase bioluminescence reporters. J Vis Exp, (2012). · DOI
  67. 10.1371/journal.pgen.1004244 · DOI
  68. 10.4161/rna.22036 · DOI
  69. 10.1016/j.molcel.2015.07.023 · DOI
  70. 10.1093/bioinformatics/btp352 · DOI · Paper page
  71. 10.1093/nar/gku365 · DOI · Paper page
  72. 10.1093/bioinformatics/btu712 · DOI
  73. Warnes GR , et al. gplots: Various R programming tools for plotting data. R package version 2, 1 (2009).
  74. 2019, Welcome to the Tidyverse, Journal of Open Source Software, 4, 1686, 10.21105/joss.01686 · DOI · Paper page
  75. 10.1152/physiolgenomics.00199.2006 · DOI
  76. 10.1128/MCB.00701-15 · DOI

Metadata

Authors
Unruh, B. A., Weidemann, D. E., & Kojima, S.
Affiliations
Virginia Tech (US)
Corresponding author
Kojima, Shihoko
Venue
Proceedings of the National Academy of Sciences
Publisher
openRxiv
Published
2023-07-26
Volume
121
Issue
7
Pages
e2314690121-e2314690121
ISSN
0027-8424 (ISSN-L)
OpenAlex
W4391527909
Cited by
12
References
1
Citations by year
2026: 3 · 2025: 5 · 2024: 4
FWCI
2.59
Type
journal article
Language
en
Open access
Licence
cc-by-nc-nd
Locations
  • Proceedings of the National Academy of Sciences (publishedVersion, cc-by-nc-nd)
  • bioRxiv (Cold Spring Harbor Laboratory) (acceptedVersion, cc-by-nc-nd)
  • PubMed Central (publishedVersion, cc-by-nc-nd)
  • PubMed (publishedVersion)
  • VTechWorks (Virginia Tech) (submittedVersion, cc-by-nc-nd)
  • PubMed Central (submittedVersion, cc-by-nc-nd)
Funders
  • Université de Genève
  • National Institutes of Health
  • National Institute on Aging (F31AG071393)
  • National Institute of General Medical Sciences (R01GM126223)
Topics
  • Life Sciences › Neuroscience › Endocrine and Autonomic Systems › Circadian rhythm and melatonin
  • Life Sciences › Biochemistry, Genetics and Molecular Biology › Molecular Biology › RNA Research and Splicing
  • Life Sciences › Agricultural and Biological Sciences › Plant Science › Plant Molecular Biology Research
Keywords
RNA degradation, Bmal1, mouse fibroblasts, post-transcriptional regulation

About these checks

Registry, retraction, Cites and statistics results are computed, not judged, with one exception: a printed reference that no index lists is read once by a model before it counts as a citation error. Claims are extracted by a model and kept only when their quote appears verbatim in the text; each cited source is then checked, with a model’s help, for whether it says what the claim relies on. Those verdicts can be wrong — read the claim’s quote and the cited source before relying on one.

Statistics and arithmetic are recomputed, not judged.

Confidence bands are shown only for fields calibrated on our annotated test set. None is calibrated yet, so no band is shown.

What counts as a claim ›How we measure confidence ›How we check this ›

Are you an author, or do you see a problem with this page? Request a review